

Article Figures & Data
Figures
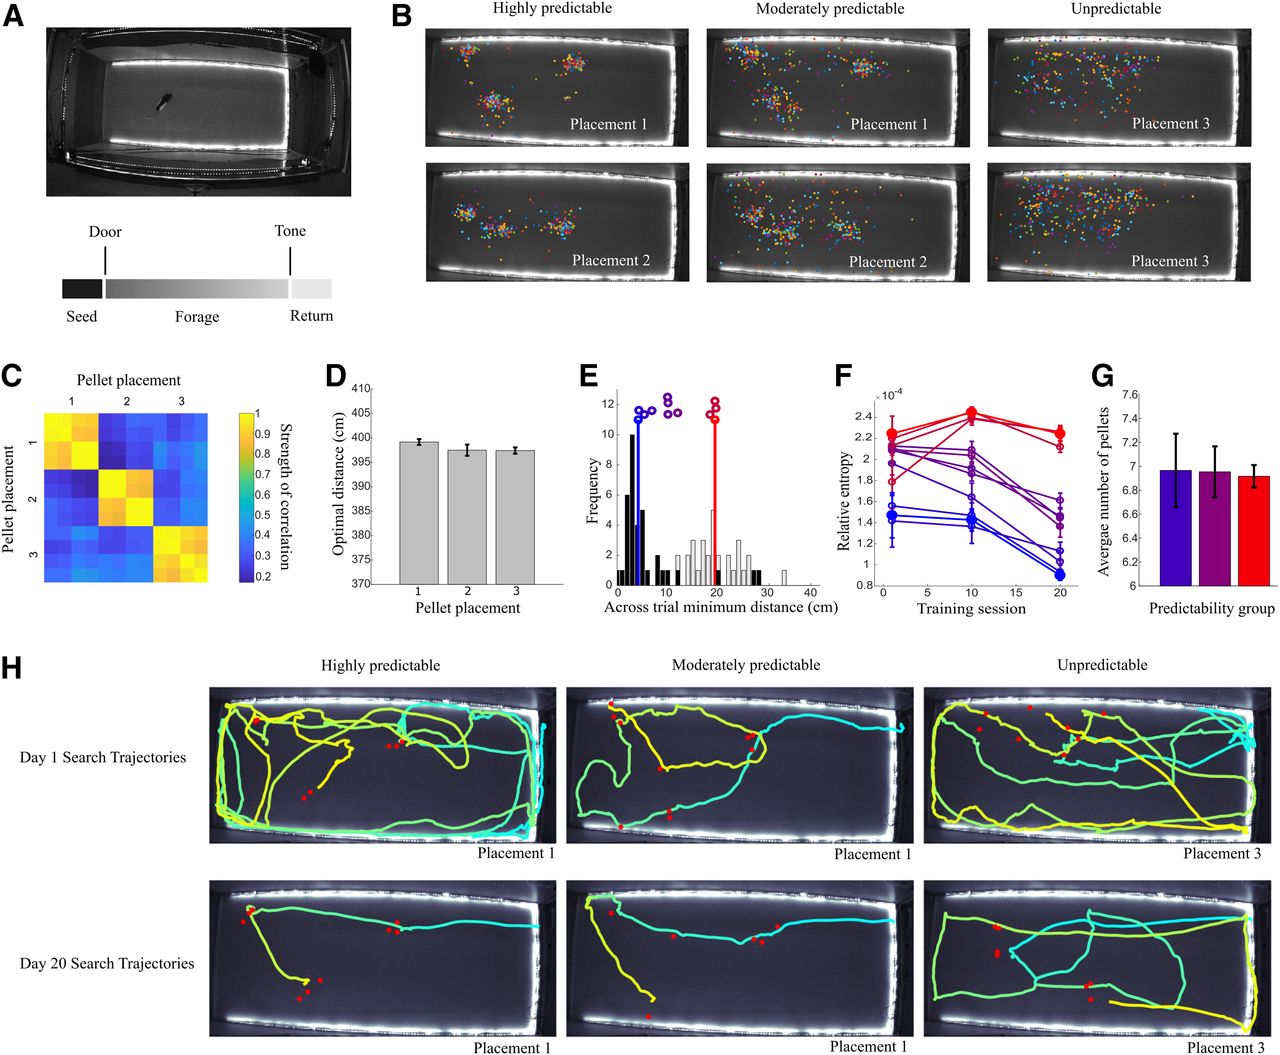
- Figure 1.
A computer-controlled probabilistic traveling salesman task enables direct tests of behavioral strategies under uncertainty. A, top, A large, automated arena with a rat shown for scale. Bottom, The temporal structure of a typical trial. B, Rats forage for pellets in highly predictable (left), moderately predictable (center), and actively randomized (right) pellet placements. Placements are shown across all trials (20 d, 3 trials per day). C, The automated system allows for reproducible pellet placement across animals. From the top to bottom of the matrix correlation coefficients are shown for two different predictable distributions and the single unpredictable distribution. D, Pellet distributions from each placement shown in panels B, C have equivalent optimal path lengths. Error bars are standard error of the mean. E, Example histograms are shown for the most predictable (black) and least predictable (gray) distributions that were tested. Vertical colored lines show the mean for the predictable (blue) and unpredictable (red) distributions. The distributions for all animals are plotted as colored circles, with color corresponding to across trial minimum distance. F, RE for each predictability grouping (high, blue; medium, purple; randomized, red) across sessions of training. Higher values indicate higher entropy. G, Average number of pellets per trial for each predictability level. H, Examples of routes taken by rats on the first trial of the first day (top panels) and after 20 d of training (bottom panels). Color shifts from cyan to yellow as each animal’s trajectory progresses.
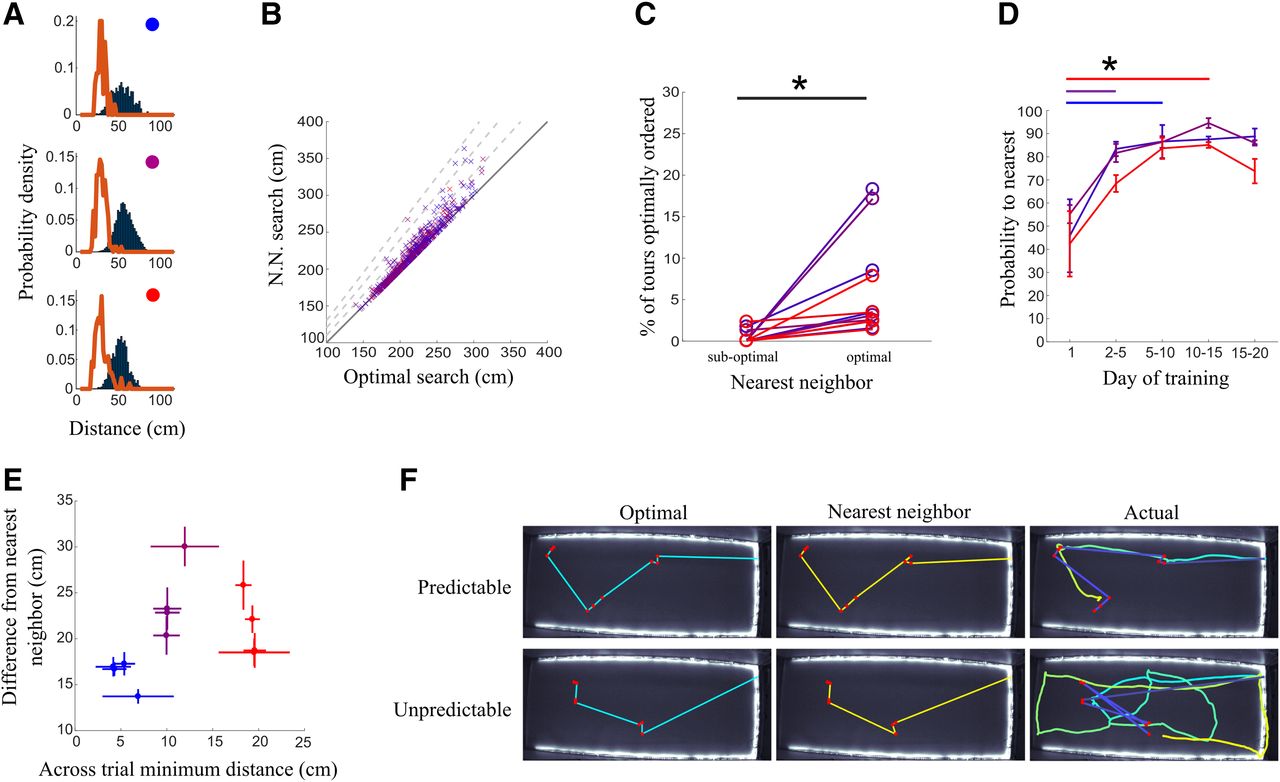
- Figure 2.
Search performance approaches a nearest neighbor heuristic after experience with reward locations. A, Average distance per pellet. Rats acquire pellets in a sequence that is extremely efficient (red lines) compared with a random sampling of all possible sequences (blue bars). Predictability decreases from top to bottom. B, Performance of a nearest neighbor strategy on all distributions tested in this study when compared with the optimal path length. Dashed lines represent 10%, 20%, and 30% above optimal. C, Animal performance on trials in which a nearest neighbor search is optimal versus trials in which a nearest neighbor search is suboptimal. Asterisk indicates significant difference between the groups. D, The probability that rats in each predictability group acquire the nearest pellet during search increases during training for all groups. The initial training epoch at which rats showed significant improvement from the first day is indicated by color-matched horizontal lines and asterisks. E, Scatter plot showing the relation between predictability of distribution (x-axis) and difference between animal acquisition sequence and nearest neighbor sequence (y-axis) for all 12 animals. Error bars are standard error of the mean across trials for each animal. F, Example of optimal and nearest neighbor pellet acquisition sequences and the actual sequences and trajectories taken by animals. For the right panels, color shifts from cyan to yellow as the animal’s trajectory progresses and from dark to light blue as the pellet acquisition sequence progresses.
- Figure 3.
Predictability supports increased route efficiency. A, Animals searching in predictable environments increase efficiency with training (for efficiency metric, see Materials and Methods). Efficiency was measured on paths to rewards that were located >40 cm away and were assessed on day 1 and then on blocks of 5 d until day 20. The first day of training that showed significant improvement in efficiency from the first day is indicated by color-matched horizontal lines and asterisks. B, Animals in both predictable groups significantly increased the efficiency of their search routes on the last block of training when compared with the first day. Significant improvement is marked by a horizontal line and asterisk. C, Efficiency of search routes measured on the last block of training (days 15–20) show a strong negative correlation to the unpredictability of the foraging environment, here measured as the cross trial minimum pellet distance (see Materials and Methods). D, All animals increase speed during training. Average speed was taken without including pauses. Color matched horizontal bars indicate the first point at which speed was significantly greater than day 1 for each predictability condition. E, Animals spend a small amount of time pausing during the task and this does not significantly change with training. F, The number of pauses per route as a function of training.
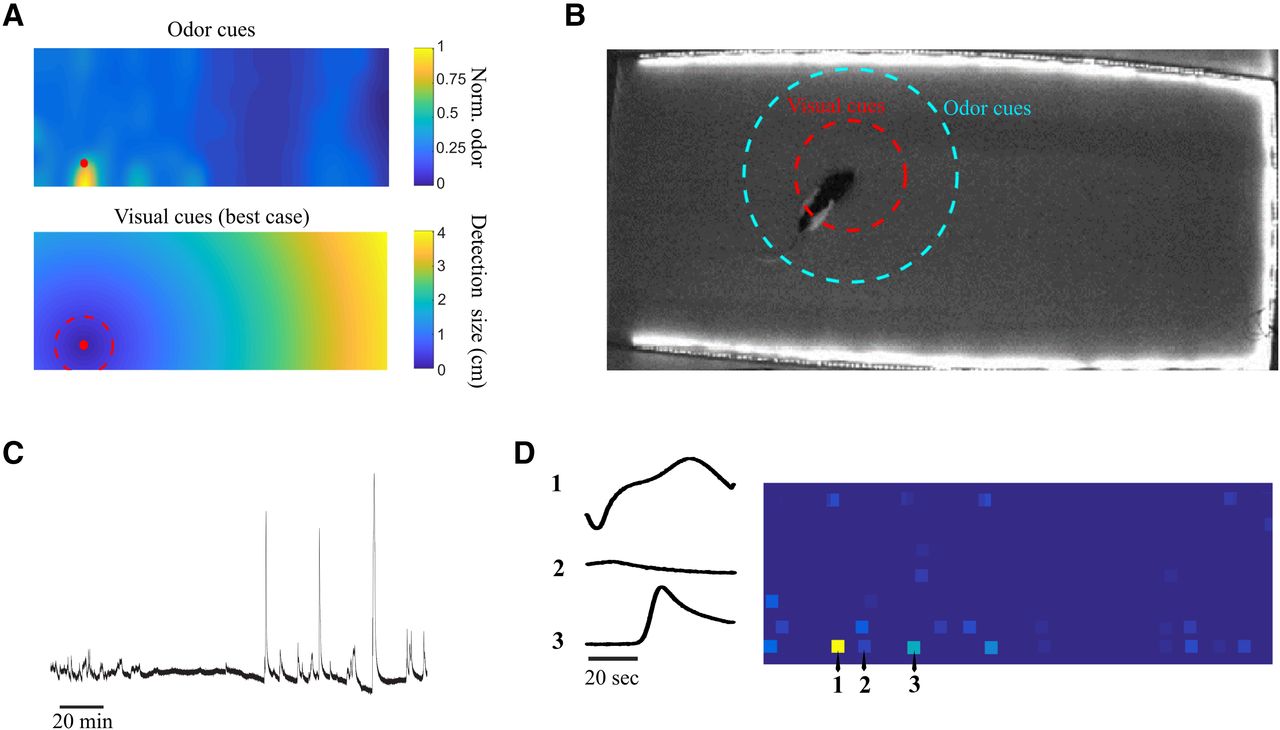
- Figure 4.
Sensory cues are local. A, top, Experimentally determined spread of odor in the foraging arena (see Materials and Methods). Bottom, Calculated size of a pellet necessary for it to be visible for a foraging rat under bright, broad-spectrum lighting conditions with high contrast, based on reported values for rat visual acuity Prusky et al. (2000, 2002). The dashed red line indicates the actual size of the pellets used (and thus the distance for detection under ideal conditions). All experiments in the current study were done under dim red light using pellets matched in color to the arena floor, further limiting the range for visual detection. B, Estimated best-case pellet detection distances for olfactory (cyan) and visual (red) sensory cues. Because of both the dim, red lighting conditions and the lightly odorized pellets, actual detection distances are likely to be much smaller. C, The entire time course of odor for one mapping experiment (∼180 min) used to establish the distribution in panel A. As the sensor is moved closer to the source (later in the experiment), odor fluctuations become much larger. D, A grid of mean odor intensity values that were sampled during the experiment and convolved with a Gaussian function to create the estimated odor density function in panel A. Odor sensor activation over time from the indicated locations (1, 2, and 3) is shown to the left of the grid.
- Figure 5.
Modeling behavior as a Bayesian search with adaptive sensory acuity and memory depth explains performance under uncertainty. A, Examples of prior distributions accumulated over all trials for one predictable and one unpredictable set of pellet locations. Distributions have been normalized to their largest value (color bar). B, Correlation to animal performance of models with parameters emphasizing sensory (S) or memory (M) guidance or an adaptive model (A) individually fit to each animal. Horizontal lines indicate comparisons with significant differences between groups. C, Correlation of agent’s search performance with animal behavior when using parameters fit to other animals (all others) or the best fit to that specific animal (best fit). The best fit is significantly better than the fits from other animals (p = 0.0043, n = 12; significance indicated by horizontal line and asterisk). D, Correlation between animal behavior and a Bayesian search with either single trial memory (1) or best performance with cumulative memory (C). Significant difference is indicated by the horizontal line with an asterisk. E, Performance ratio (path length with priors from different distributions/path length with correct prior) for all animals plotted as a function of the across trial minimum distance for the distributions presented to each animal (significant correlation: R = −0.85, p = 0.0004). A higher value for the performance ratio indicates longer path length with a shuffled prior. Agents searching with unpredictable distributions (red) show identical performance regardless of the prior used. F, left, Sensory acuity based on the best fit search parameters versus RE based on the distributions that animals have experienced. Right, Long-term memory usage versus RE of pellet distributions encountered.
- Figure 6.
Schematic of two strategies selected to solve the probabilistic traveling salesman task. A schematic of the main results, showing that animals adaptively change the strategies used for a search depending on the level of uncertainty of the environment, here depicted as a spectrum from red (uncertain) to blue (predictable).


In this issue


