

Article Figures & Data
Figures
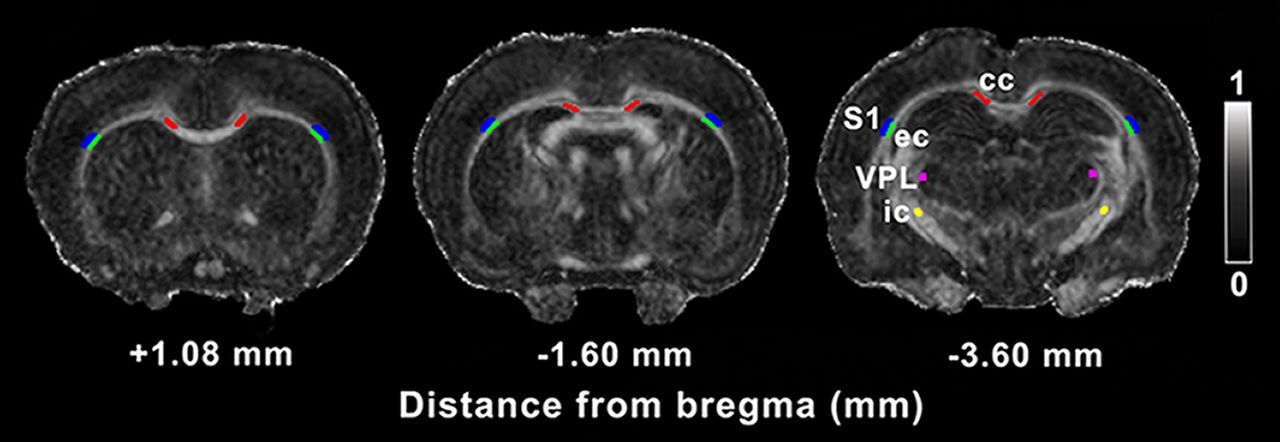
- Figure 1.
ROIs included in the DTI analysis. ROIs are outlined in a representative coronal FA map of a sham-operated animal. Gray scale indicates FA values between 0 (black) and 1 (white). cc, corpus callosum; ec, external capsule; ic, internal capsule; S1, somatosensory cortex; VPL, ventral posterolateral thalamic nucleus.
- Figure 2.
Whole-brain voxel-wise group analysis of FA, AD, MD, and RD parameters comparing sham-operated and mTBI animals at day 3. The mTBI rats showed significantly reduced FA, AD, MD, and RD parameters. The figure shows 1 – p, where p is the permutation-based FWE corrected p value after TFCE enhancement of the test statistic; a corrected p < 0.05 was considered significant (blue-light blue color scale). AD, axial diffusivity; FA, fractional anisotropy; MD, mean diffusivity; RD, radial diffusivity.
- Figure 3.
Whole-brain voxel-wise group analysis of Westin’s derived DTI parameters comparing sham-operated and mTBI animals at 3 and 28 d. The mTBI rats showed significantly reduced Westin’s derived DTI parameters. The figure shows 1 – p, where p is the permutation-based FWE corrected p value after TFCE enhancement of the test statistic; a corrected p < 0.05 was considered significant (blue-light blue color scale). CL, linear anisotropy; CP, planar anisotropy; CS, spherical anisotropy indices.
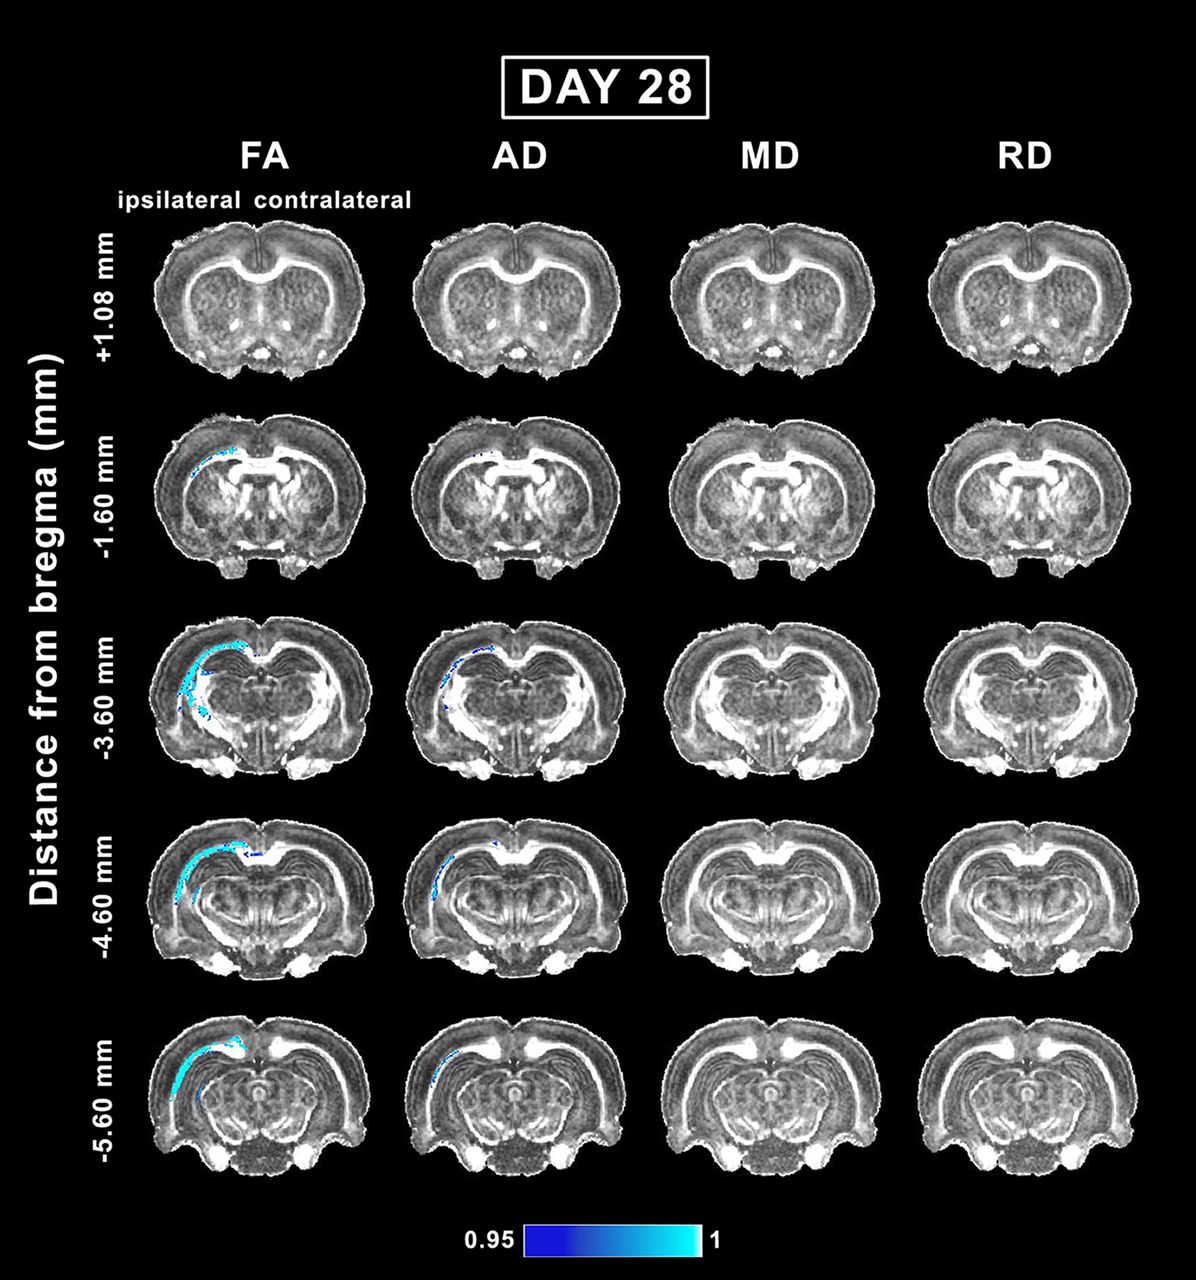
- Figure 4.
Whole-brain voxel-wise group analysis of FA, AD, MD, and RD parameters comparing sham-operated and mTBI animals at day 28. The mTBI rats showed significantly reduced FA, AD, MD, and RD parameters. The figure shows 1 – p, where p is the permutation-based FWE corrected p value after TFCE enhancement of the test statistic; a corrected p < 0.05 was considered significant (blue-light blue color scale). AD, axial diffusivity; FA, fractional anisotropy; MD, mean diffusivity; RD, radial diffusivity.
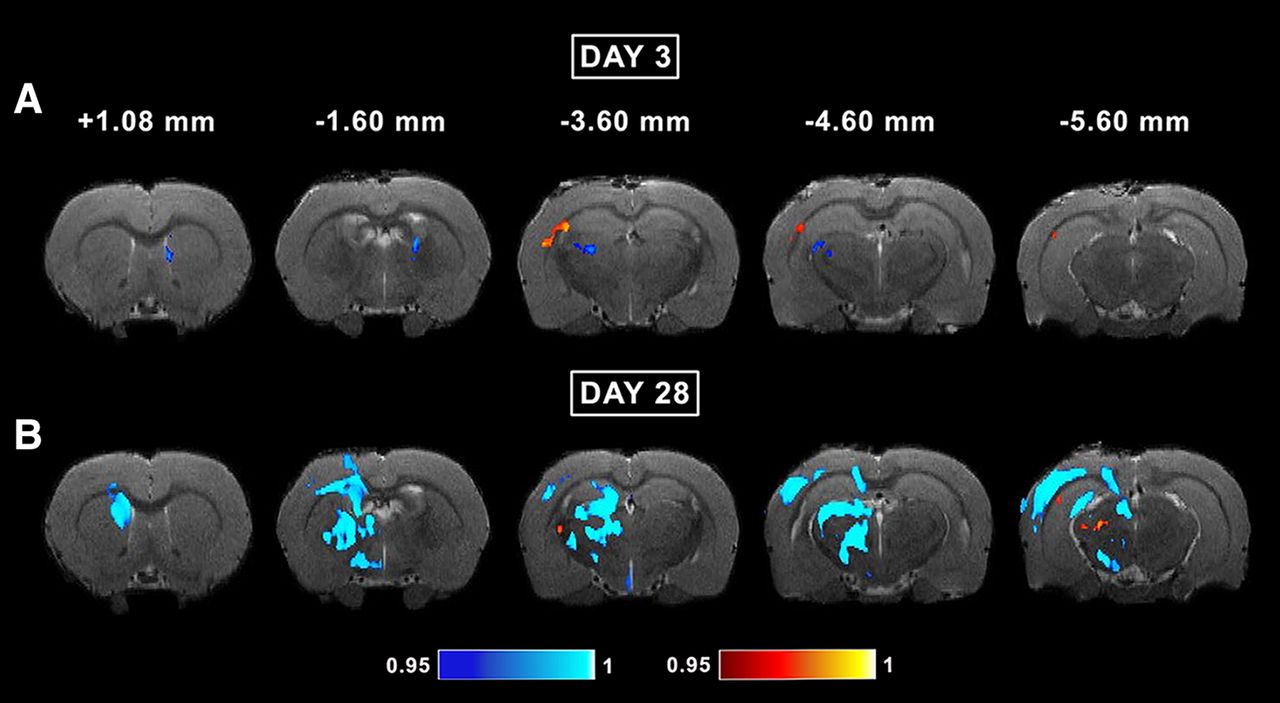
- Figure 5.
Whole-brain group deformation-based morphometry analysis of T2-weighted images comparing sham-operated and mTBI animals at day 3 ( A ) and 28 ( B ). Brain volume differences between sham-operated and mild TBI animals observed in acute and subacute phases post-mTBI. The mTBI rats showed both volume enlargement (red-yellow color scale), and volume reduction (blue-light blue color scale) compared with the sham-operated rats. The figure shows 1 – p, where p is the permutation-based FWE corrected p value after TFCE enhancement of the test statistic; a corrected p < 0.05 was considered significant.
- Figure 6.
Representative whole-brain myelin-stained section of a sham-operated animal at +1.08 mm from bregma ( A ). White squares in A indicate the location of high-magnification photomicrographs of myelin-stained and Nissl-stained sections of a sham-operated ( i and iii ) and mTBI animal ( ii and iv ) in the corpus callosum ( B ), external capsule ( C ), and somatosensory cortex ( D ). The same animals are shown in both stainings. White arrowheads indicate axonal damage. cc, corpus callosum; ec, external capsule; S1, somatosensory cortex. Scale bars: 2 mm ( A ) and 50 μm ( B–D ).
- Figure 7.
Representative whole-brain myelin-stained section of a sham-operated animal at −1.60 mm from bregma ( A ). White squares in panel A indicate the location of high-magnification photomicrographs of myelin-stained sections and Nissl-stained sections of a sham-operated ( i and iii ) and mTBI animal ( ii and iv ) in the corpus callosum ( B ), external capsule ( C ), and somatosensory cortex ( D ). The same animals are shown in both stainings. White arrowheads indicate axonal damage, and black arrowheads indicate gliosis shown by increased cellularity in Nissl-staining sections. cc, corpus callosum; ec, external capsule; S1, somatosensory cortex. Scale bars: 2 mm ( A ) and 50 μm ( B–D ).
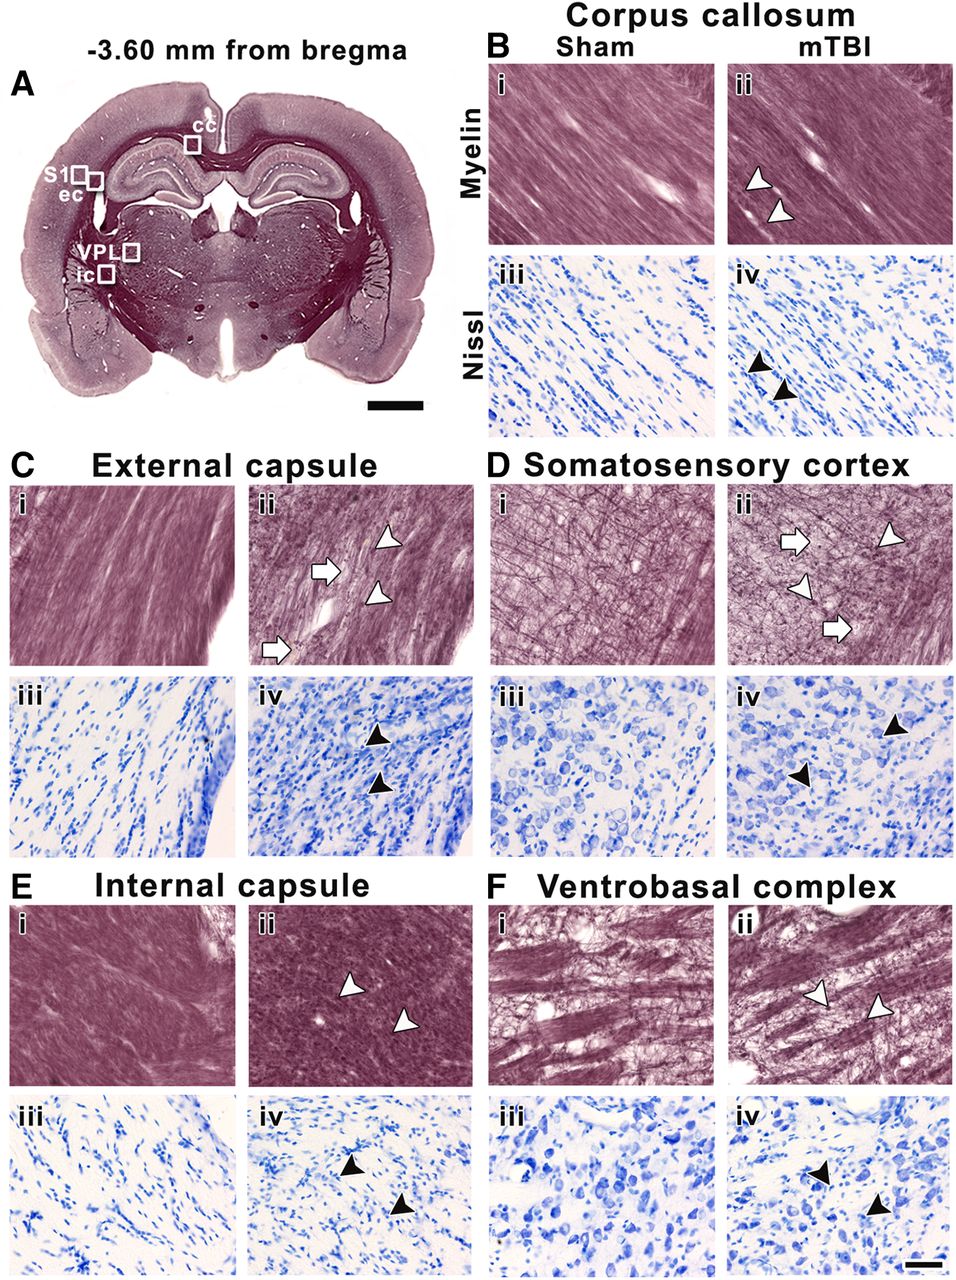
- Figure 8.
Representative whole-brain myelin-stained section of a sham-operated animal at −3.60 mm from bregma ( A ). White squares in panel A indicate the location of high-magnification photomicrographs of myelin-stained sections and Nissl-stained sections of a sham-operated ( i and iii ) and mTBI animal ( ii and iv ) in the corpus callosum ( B ), external capsule ( C ), and somatosensory cortex ( D ), internal capsule ( E ), and ventrobasal complex ( F ). The same animals are shown in both stainings. White arrowheads indicate axonal damage, and white arrows point to loss of myelinated axons. Black arrowheads indicate gliosis shown by increased cellularity in Nissl-staining sections. cc, corpus callosum; ec, external capsule; ic, internal capsule; S1, somatosensory cortex; VPL, ventral posterolateral thalamic nucleus. Scale bars: 2 mm ( A ) and 50 μm ( B–F ).
- Figure 9.
Representative multiple linear regression analyses of quantitative DTI and histologic analysis parameters at +1.08 mm ( A , B ), −1.60 mm ( C , D ), and −3.60 mm ( E–H ) from bregma. The thick black line is the regression line, and the two thin dotted lines represent the 95% confidence interval. Both sham-operated and mTBI animals (ipsilateral and contralateral hemispheres) are represented by colors, and the brain areas by shapes. The x-axis represents the χ values obtained with the expression: χ = βAI × AI + βCD × CD, where β is the weighting value. The y-axis represents FA or AD (×10−3 mm2/s). CD values are scaled (×10−2 cell/μm2). AD, axial diffusivity; AI, anisotropy index; cc, corpus callosum; CD, cell density; ec, external capsule; FA, fractional anisotropy; ic, internal capsule; S1, somatosensory cortex; VPL, ventral posterolateral thalamic nucleus.


Tables
Level +1.08 mm t test Ipsilateral Contralateral AI CD (×10−2 cell/μm2) AI CD (×10−2 cell/μm2) Mean ± SD t(AI) Mean ± SD t(CD) Mean ± SD t(AI) Mean ± SD t(CD) cc Sham 0.81 ± 0.05 0.61 0.53 ± 0.03 0.41 0.80 ± 0.04 0.51 0.52 ± 0.04 0.38 mTBI 0.83 ± 0.03 0.52 ± 0.04 0.81 ± 0.03 0.52 ± 0.02 ec Sham 0.73 ± 0.04 0.94 0.43 ± 0.03 0.62 0.75 ± 0.03 0.25 0.44 ± 0.05 0.47 mTBI 0.71 ± 0.04 0.44 ± 0.04 0.75 ± 0.03 0.46 ± 0.05 S1 Sham 0.43 ± 0.06 1.06 0.39 ± 0.02 0.56 0.47 ± 0.04 0.11 0.39 ± 0.01 0.80 mTBI 0.47 ± 0.06 0.40 ± 0.06 0.47 ± 0.01 0.38 ± 0.03 Level –1.60 mm cc Sham 0.85 ± 0.02 2.06 0.51 ± 0.05 1.46 0.84 ± 0.04 0.04 0.50 ± 0.02 1.89 mTBI 0.82 ± 0.04 0.55 ± 0.04 0.82 ± 0.03 0.53 ± 0.03 ec Sham 0.71 ± 0.06 1.91 0.43 ± 0.04 2.91 0.73 ± 0.02 0.51 0.42 ± 0.03 1.22 mTBI 0.66 ± 0.03 0.50 ± 0.05 0.72 ± 0.05 0.44 ± 0.04 S1 Sham 0.38 ± 0.05 0.23 0.39 ± 0.02 1.18 0.45 ± 0.05 0.52 0.39 ± 0.02 0.45 mTBI 0.38 ± 0.06 0.41 ± 0.03 0.44 ± 0.05 0.39 ± 0.02 Level –3.60 mm cc Sham 0.83 ± 0.04 1.18 0.50 ± 0.06 0.50 0.80 ± 0.06 1.25 0.49 ± 0.03 0.37 mTBI 0.78 ± 0.05 0.52 ± 0.06 0.75 ± 0.07 0.50 ± 0.06 ec Sham 0.76 ± 0.03 4.97 0.44 ± 0.03 4.71 0.73 ± 0.04 2.44 0.43 ± 0.03 0.47 mTBI 0.60 ± 0.08* 0.56 ± 0.06* 0.78 ± 0.03 0.42 ± 0.03 S1 Sham 0.34 ± 0.07 1.40 0.39 ± 0.02 4.01 0.35 ± 0.09 0.63 0.39 ± 0.03 1.04 mTBI 0.30 ± 0.05 0.46 ± 0.05* 0.33 ± 0.04 0.38 ± 0.01 ic Sham 0.53 ± 0.09 1.40 0.38 ± 0.03 4.23 0.56 ± 0.08 0.23 0.38 ± 0.02 1.19 mTBI 0.47 ± 0.04 0.45 ± 0.02* 0.57 ± 0.04 0.35 ± 0.04 VPL Sham 0.43 ± 0.03 0.49 0.33 ± 0.03 3.08 0.45 ± 0.05 0.28 0.33 ± 0.03 0.30 mTBI 0.43 ± 0.03 0.38 ± 0.04 0.44 ± 0.04 0.34 ± 0.03 Statistically significant FDR-corrected q values are shown (* q < 0.05 corresponding to uncorrected * p < 3.10 × 10⁻³; unpaired t test) for the anisotropy index (AI) and CD (×10−2 cell/μm2). AI, anisotropy index; cc, corpus callosum; CD, cell density; ec, external capsule; ic, internal capsule; S1, somatosensory cortex; VPL, ventral posterolateral thalamic nucleus.
- Table 2
Multiple linear regression between quantitative DTI and histologic analysis at +1.08, −1.60, and −3.60 mm from bregma
Level +1.08 mm FA AD (×10–3 mm2/s) R² adj F stat t(AI) t(CD) R² adj F stat t(AI) t(CD) cc 0.02 1.24 –1.42 0.14 0 0.46 –0.20 –0.94 ec 0.11 2.64 1.38 1.88 0.15 3.45 2.58* 0.58 S1 0.01 1.09 –0.11 1.47 0 0.15 –0.16 –0.48 cc + ec 0.68*** 60.0 5.10*** 6.28*** 0.66*** 55.1 6.34*** 4.53*** Level –1.60 mm cc 0.51*** 14.8 1.49 –4.97*** 0.09 2.25 –0.42 –2.12 ec 0.08 2.14 0.14 –1.94 0.25* 5.52 2.08 –1.87 S1 0 0.40 0.66 –0.55 0.05 1.65 –0.98 –1.60 cc + ec 0.33*** 14.5 5.39*** –2.40 0.55*** 34.3 7.54*** –0.28 Level –3.60 mm cc 0.20 4.29 2.91* –0.78 0 0.87 1.17 –0.79 ec 0.72*** 35.4 3.00* –2.37 0.69*** 31.4 4.54*** –0.32 S1 0.08 2.19 –0.35 –2.06 0.03 1.47 –0.36 0.10 ic 0.23* 4.95 1.98 –1.51 0.33** 7.76 3.72** 0.19 VPL 0.15 3.37 –1.96 –2.03 0 0.59 0.28 –0.98 cc + ec 0.53*** 32.0 5.02*** –4.63*** 0.48*** 26.5 5.45*** –3.17** cc + ec + ic 0.51*** 44.2 –1.09 –8.52*** 0.33*** 21.6 5.44*** –5.23*** S1 + VPL 0.39*** 18.6 –5.12*** –0.33 0.14* 5.48 –2.95* –0.52 Statistically significant FDR-corrected q values are shown (*q < 0.05; **q < 0.01; ***q < 0.001 corresponding to uncorrected *p < 1.97 × 10⁻², **p < 2.5 × 10⁻³, ***p < 1.22 × 10⁻⁴, respectively; multiple linear regression test) for the AI, CD (×10−2 cell/μm2), and both parameters. AD, axial diffusivity; AI, anisotropy index; cc, corpus callosum; CD, cell density; ec, external capsule; FA, fractional anisotropy; ic, internal capsule; S1, somatosensory cortex; VPL, ventral posterolateral thalamic nucleus.
In this issue


