

Article Figures & Data
Figures
- Figure 1.
HFS results in excess glutamate accumulation in the Q175FDN Het hippocampus that is not alleviated by ceftriaxone. A, Representative maximum projection images of the iGluSnFR response to HFS in WT-saline (Sal), Het-Sal, WT-Cef, and Het-Cef conditions. A bright-field image depicting the field of view containing the hippocampus is shown on the top left for the WT-Sal example. Scale bar, top right (top five images), 500 μm. The bottom panels represent the response to HFS over time (z-axis). Gray shading indicates the timing of HFS. Scale bar, bottom right, 1 s. B, Mean iGluSnFR responses (±SEM) in each group during HFS. The red box represents the portion of the response at stimulus offset used for the decay tau analysis in D. Gray shading above the response indicates SEM. The 1 s of HFS is indicated by the black horizontal bar above the response, and the shading underneath each response is representative of the area under the curve. Responses are normalized to the peak. C, Analysis of iGluSnFR sustain in WT and Het mice treated with Sal or Cef. D, Decay tau comparisons for each condition. E, Representative response at the end of stimulation showing the difference in iGluSnFR decay between WT-Sal and Het-Sal. F–H, Peak (F), time to reach the peak (G), and the area under the curve (AUC; H) in WT and Het mice treated with Sal or Cef. I, J, iGluSnFR responses (I) and peak values (J) in WT and Het slices exposed to 100 μm TBOA. All data are presented as the mean ± SEM. *p < 0.05, **p < 0.01, ***p < 0.001.
- Figure 2.
Glutamate dynamics in response to TBS are normal in the Q175FDN Het hippocampus. A, Representative maximum projection images of the iGluSnFR response to TBS in WT-saline (Sal), Het-Sal, WT-Cef, and Het-Cef conditions. A bright-field image depicting the field of view containing the hippocampus is shown on the top left for the WT-Sal example. Scale bar, top right (top five images), 500 μm. The bottom panels represent the response to TBS over time (z-axis). Gray shading indicates the timing of the 10 bursts of TBS. Calibration, bottom right: 1 s. B, Mean iGluSnFR responses (±SEM) in each group during TBS. Gray shading above the response indicates SEM. Each burst associated with TBS is indicated by a vertical black bar above the response, and the shading underneath each response is representative of the area under the curve. Calibration (all four responses): 1% ΔF/F; 400 ms. C, D, Mean (±SEM) peak response to each of the 10 bursts associated with TBS in WT and Het mice treated with Sal (C) or Cef (D). E, Comparison of average peak over TBS in WT and Het treated with Sal or Cef. F, G, Decay tau for each of the 10 bursts associated with TBS in WT and Het mice treated with Sal (F) or Cef (G). H, Comparison of the average decay tau throughout TBS in WT and Het treated with Sal or Cef. I, Comparison of AUC in WT and HET mice treated with Sal or Cef. J, iGluSnFR decay tau values evoked by a single pulse. All data are presented as the mean ± SEM; **p < 0.01, ***p < 0.001. ns, non-significant.
- Figure 3.
Ceftriaxone increases CA3–CA1 basal excitability and impairs synaptic plasticity. A, Representative image of the multielectrode array used to stimulate and record hippocampal responses. Scale bar, 450 μm. B–D, Input–output curve measuring fEPSP responses to increasing stimulus intensities in WT and Het mice treated with saline (Sal) or Cef. Mean fEPSP slopes at 50 μA are shown in C to compare the effect of treatment and genotype on the fEPSP. Data for Het and WT responses were grouped in D to demonstrate the effect of ceftriaxone treatment on fEPSP slope. Sidak’s multiple-comparisons test showed significant post hoc effects at 55–60 μA (*p < 0.05), 65–70 μA (**p < 0.01), and 75–90 μA (***p < 0.001). E–G, Paired-pulse ratios at three different interpulse intervals for the indicated genotypes and treatments. H, I, LTP in WT and Het mice treated with Sal or Cef. Representative fEPSP traces before (black) and 55–60 min after LTP induction (red) are shown in H. fEPSP traces are scaled so that the baseline peak is matched for each trace. Scale bar, 10 ms. High-frequency stimulation is administered at time = 0 in I. J, LTP expressed as the percentage potentiation 55–60 min following high-frequency stimulation. K, Post-tetanic potentiation expressed as the percentage of potentiation 0–3 min following high-frequency stimulation. All data are presented as the mean ± SEM. *p < 0.05, **p < 0.01, ***p < 0.001.
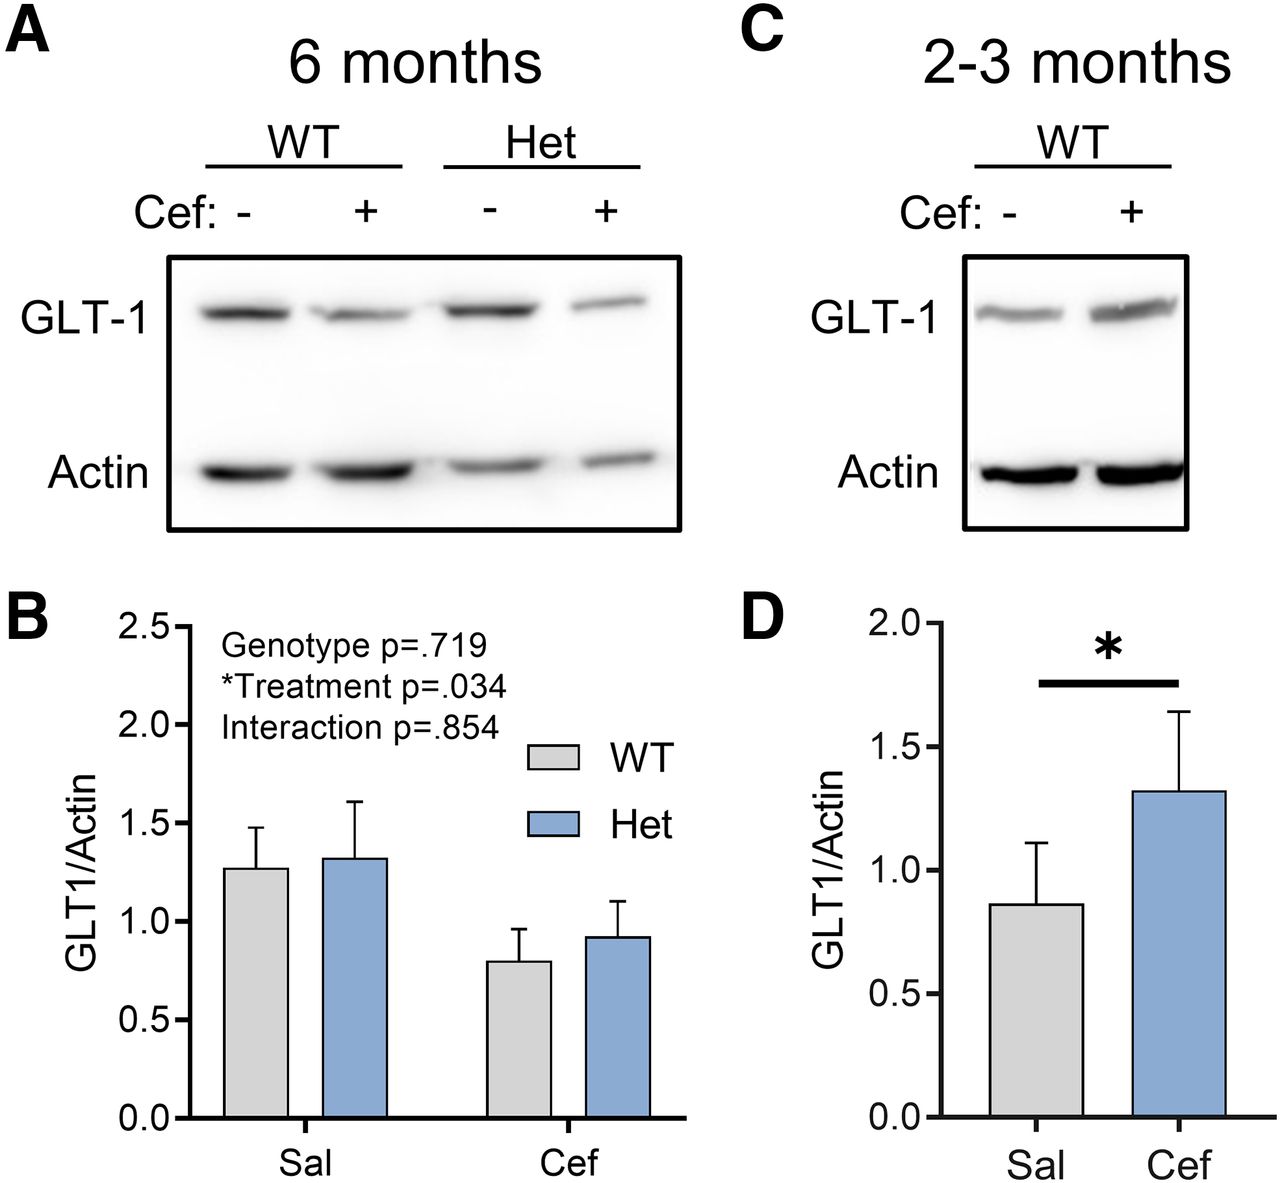
- Figure 4.
Ceftriaxone exerts an age-dependent effect on hippocampal GLT-1 expression. A, B, Western blots comparing GLT-1 expression in WT and Het mice treated with saline (Sal) or Cef at 6 months of age. C, D, Western blots comparing GLT-1 expression in WT mice treated with Sal or Cef at 2–3 months of age. All data are presented as the mean ± SEM. *p < 0.05.


In this issue


