

Article Figures & Data
Figures
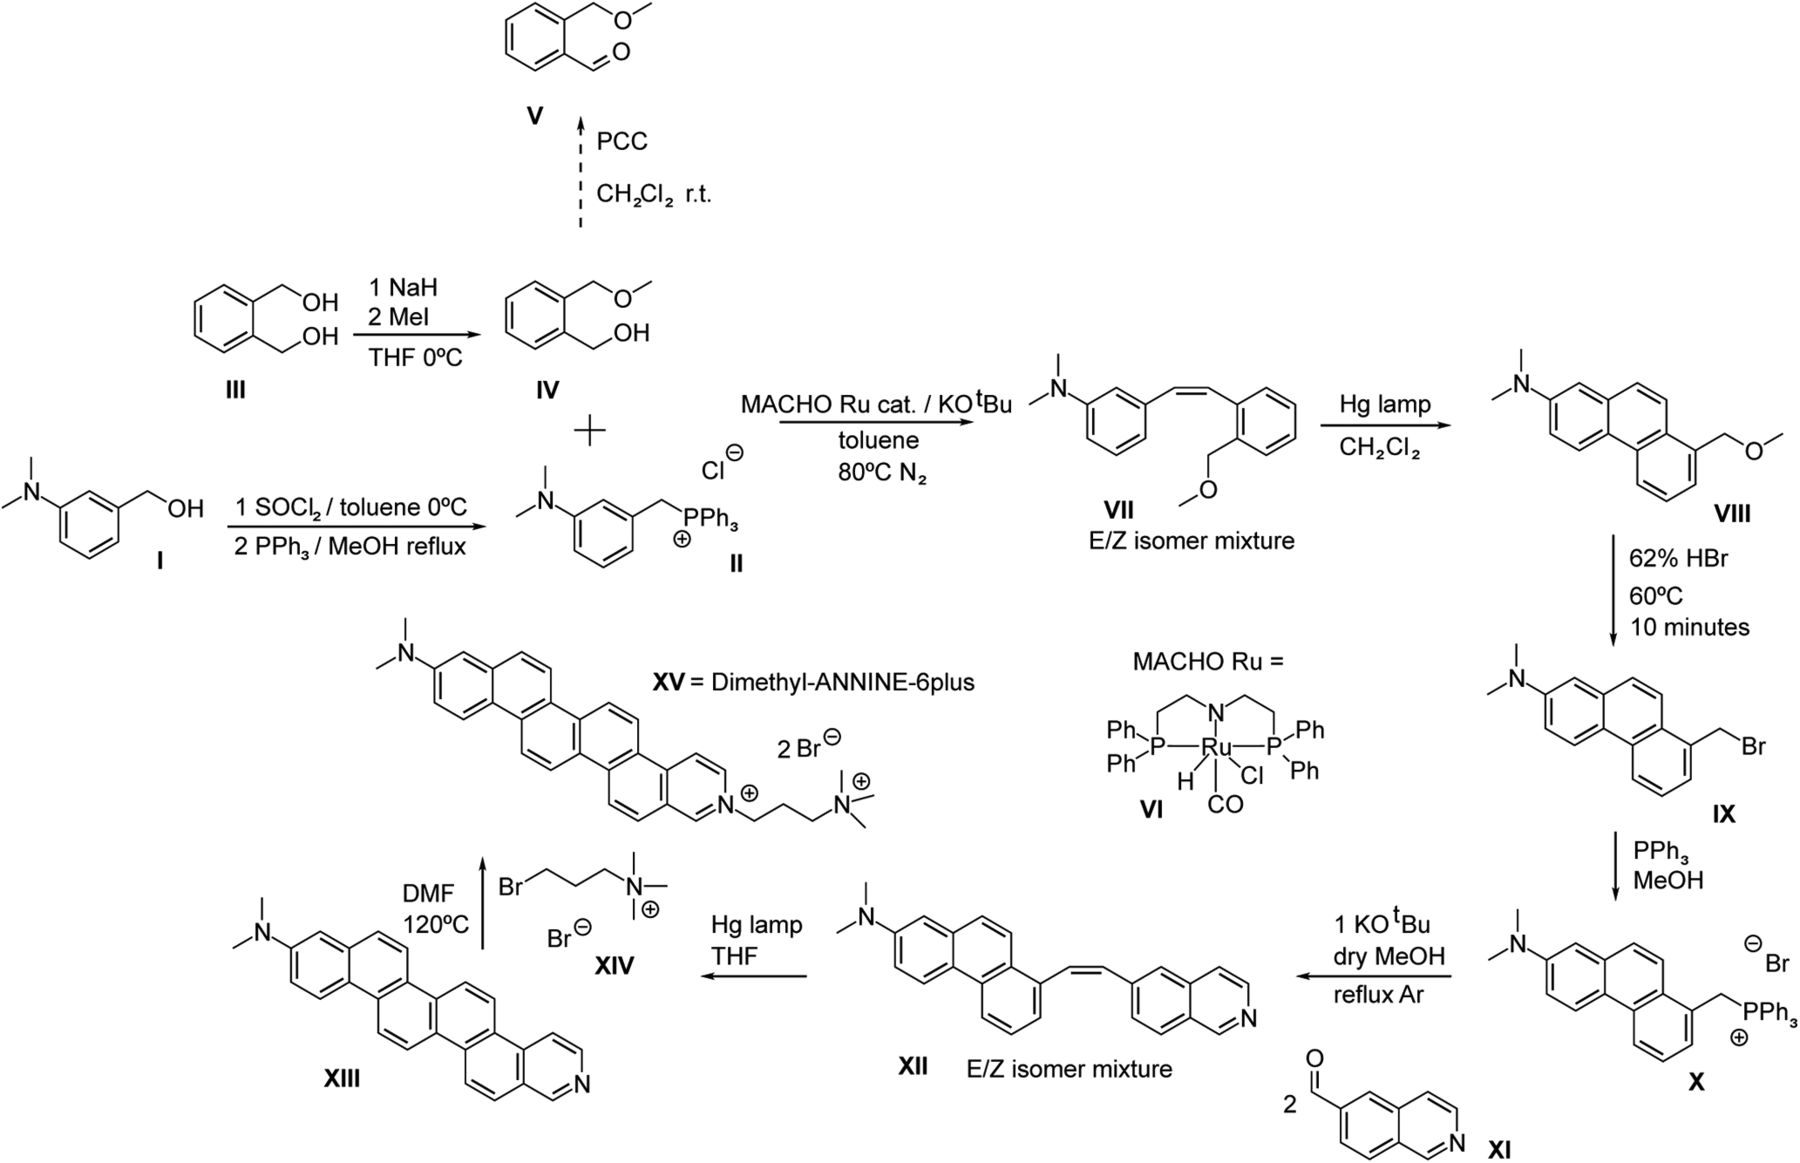
- Figure 1.
Synthesis schema for di1-ANNINE-6plus. Synthesis was adapted from Hübener et al. (2003).
- Figure 2.
1HNMR of di1-ANNINE-6plus in DMSO-d6. a, Full spectrum. b, Aromatic expansion. c, Aliphatic expansion.
- Figure 3.
HRMS of di1-ANNINE-6plus. Expansion of relevant region.
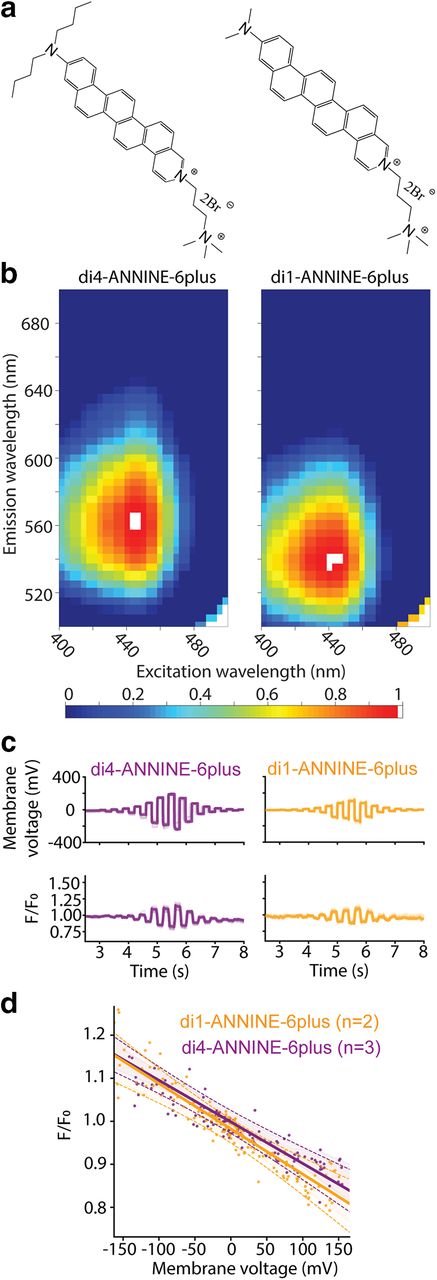
- Figure 4.
Structure, fluorescence spectrum, and sensitivity of di1-ANNINE-6plus. a, Structure of di4-ANNINE-6plus (previously published under the name ANNINE-6plus) and di1-ANNINE-6plus. b, 2D fluorescence spectra of both dyes measured in cortical tissue, normalized but otherwise not corrected. c, HEK293 cells in a single confluent layer were simultaneously current injected with a patch pipette and voltage imaged (488 nm excitation, 561 nm long-pass filter). Recordings were made with di1-ANNINE-6plus and di4-ANNINE-6plus (orange and purple traces, respectively). d, Fluorescence changes over membrane voltage change per voltage step (n indicates the number of cells). A linear regression was calculated for each dye (solid line), as well as the 95% confidence interval for each regression line (dotted lines), supporting that both dyes show the same sensitivity as expected from the same chromophores.
- Figure 5.
Cranial window surgery. a, After drilling the channel through most of the bone around the circular bone patch, a wooden toothpick was glued to the circular bone patch. Dental cement (pink) covers the bone beyond the window area. The blue ink marked the position of the craniotomy. b, Using the toothpick as a handle, the bone patch was gently removed, and saline was added to wash away any blood. c, Hydrogen peroxide was added to the dura so that a bubble forms. Gel foam, forming a well on the craniotomy, was removed for clarity. d, After dye injection, the bubble below the dura was deflated during the mounting of the window glass. The cranial window was clear and ready for imaging.
- Figure 6.
Immunofluorescence staining for GFAP, a reactive astrocyte-specific marker. Mice were killed 3 h (top) or 1 week (bottom) postsurgery. Surgeries were either a standard chronic cranial window surgery (left) or a bubble surgery (right). There is no noticeable increase in GFAP 3 h following surgery, but in both chronic cranial window and bubble surgery preparations there is a similar increase 1 week postsurgery. Surgery was performed on the left hemisphere in each coronal slice shown. White rectangles indicate the positions of magnified areas (lower half).
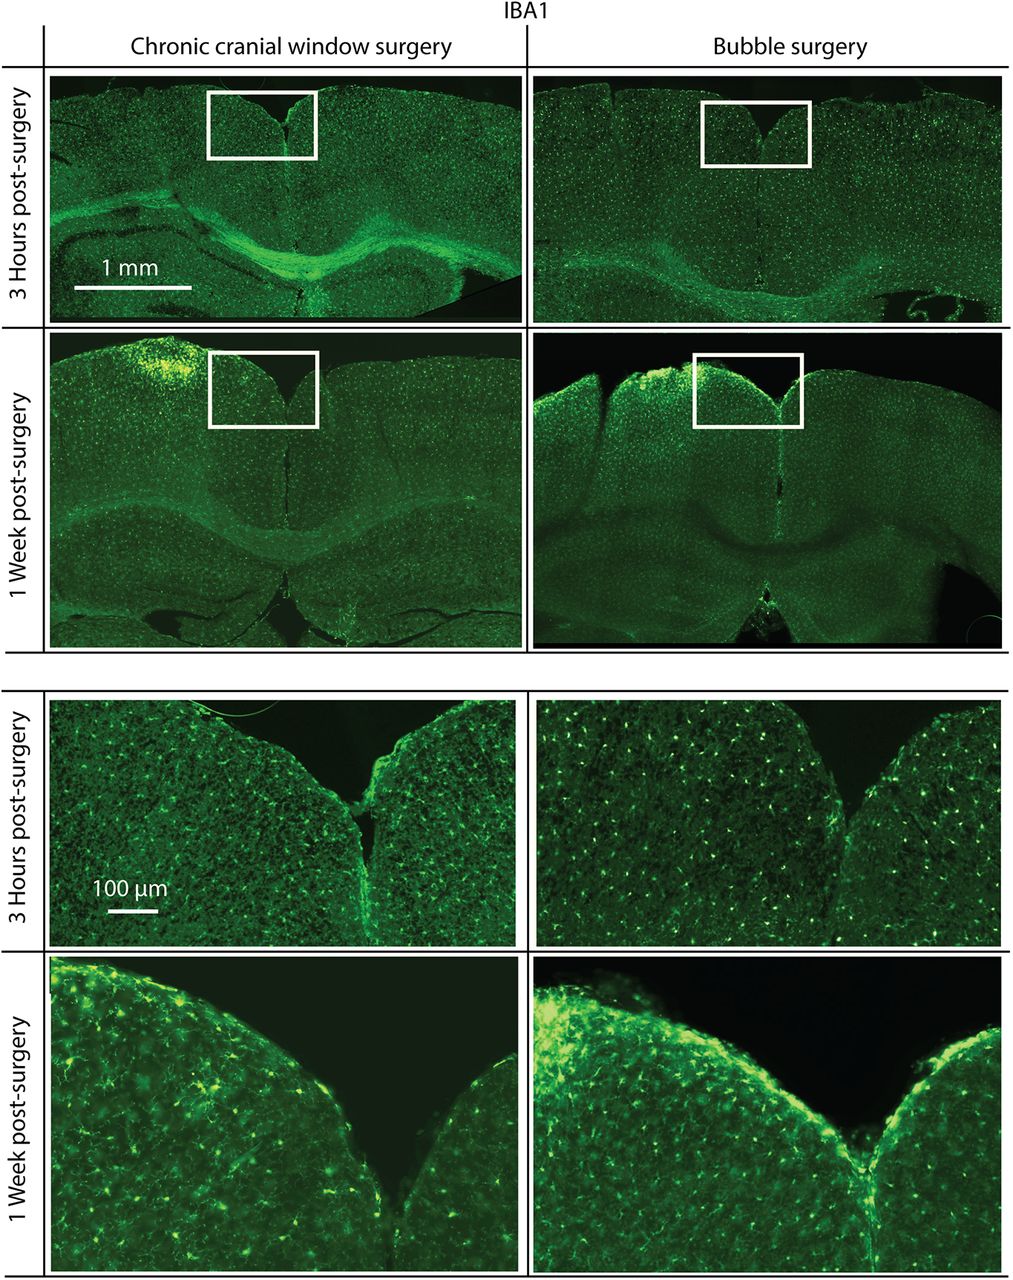
- Figure 7.
Immunofluorescence staining for IBA1, a microglia activation-specific marker. Mice were killed 3 h (top) or 1 week (bottom) postsurgery. Surgeries were either a standard chronic cranial window surgery (left) or a bubble surgery followed by the mounting of a chronic cranial window (right). There is no noticeable increase in IBA1 3 h following surgery, but in both chronic cranial window surgery and bubble surgery preparations there is a similar increase in IBA1 1 week postsurgery. Surgery was done on the left hemisphere in each coronal slice shown. White rectangles indicate the positions of magnified areas (lower half).
- Figure 8.
Comparison of labeling with di4-ANNINE-6plus and di1-ANNINE-6plus after bubble surgery. a, Images taken from an image stack of di4-ANNINE-6plus (left) and di1-ANNINE-6plus (right) staining in barrel cortex in vivo. Following the same cortical surface application protocol (i.e., filling the bubble with staining solution), di1-ANNINE-6plus diffuses deeper into cortex. b, Two-photon image of di1-ANNINE-6plus spread over cortical L1, following bubble surgery. Dye is spread >1.2 mm laterally across the cortex. c, Image stack of di4-ANNINE-6plus applied in a bubble surgery. The deepest point at which dye reliably reached is ∼35–40 μm below the dura. Orthogonal projections of the image stack at the crosshairs show the extent of the dye penetration through L1, which is notably less than that of di1-ANNINE-6plus.
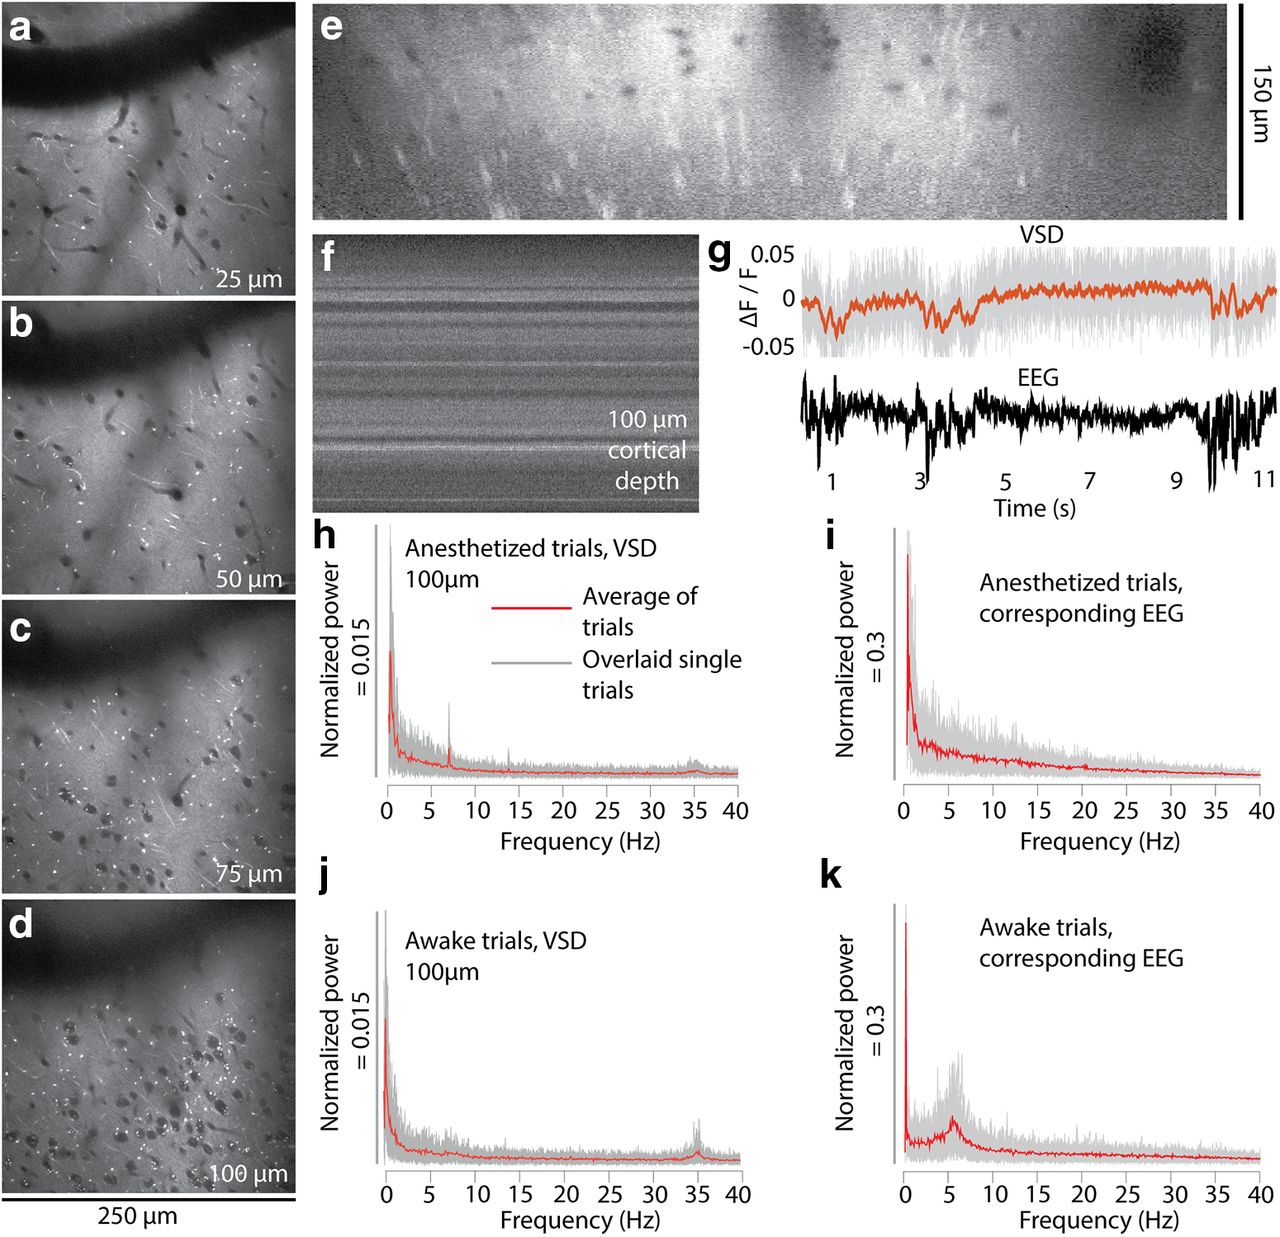
- Figure 9.
In vivo two-photon imaging of cortical L1 and 2 after labeling with di1-ANNINE-6plus. a–e, Labeling with di1-ANNINE-6plus in vivo in different depths (a–d) and the corresponding x–z reconstruction (e). Bright spots indicate lipid-rich structures, most likely myelinated axons. f, g, Line-scan recordings (2 kHz recording; dwell time, 1 μs/pixel; f) and example of paired VSD and EEG recordings (g; 11 s anesthetized trace, 75 μm below dura; gray, raw VSD data; red, filtered recording; low-pass filtered at 30 Hz, eighth order; black, EEG) under isoflurane anesthesia showing spindle activity. h–k, Frequency spectra of membrane voltage and corresponding EEG recordings calculated from 30 recordings (11 s each; gray background, overlay of single trials; red line, average) in an awake and anesthetized mouse.
- Figure 10.
Two-photon calcium imaging of L1 fibers after bubble surgery. a–c, Successive slices in an image stack with intact fibers throughout L1. d, Reconstruction of the image stack. The reconstruction confirms that the bubble surgery does not affect L1. e, A recording during wakefulness was taken in L1. f, Individual regions of interest, indicated in e, show typical dendritic calcium activity. Recordings were taken at 4 Hz. This supports the observation that bubble surgery and peroxide application do not disrupt neuronal processes or kill neurons in the upper cortical layers.
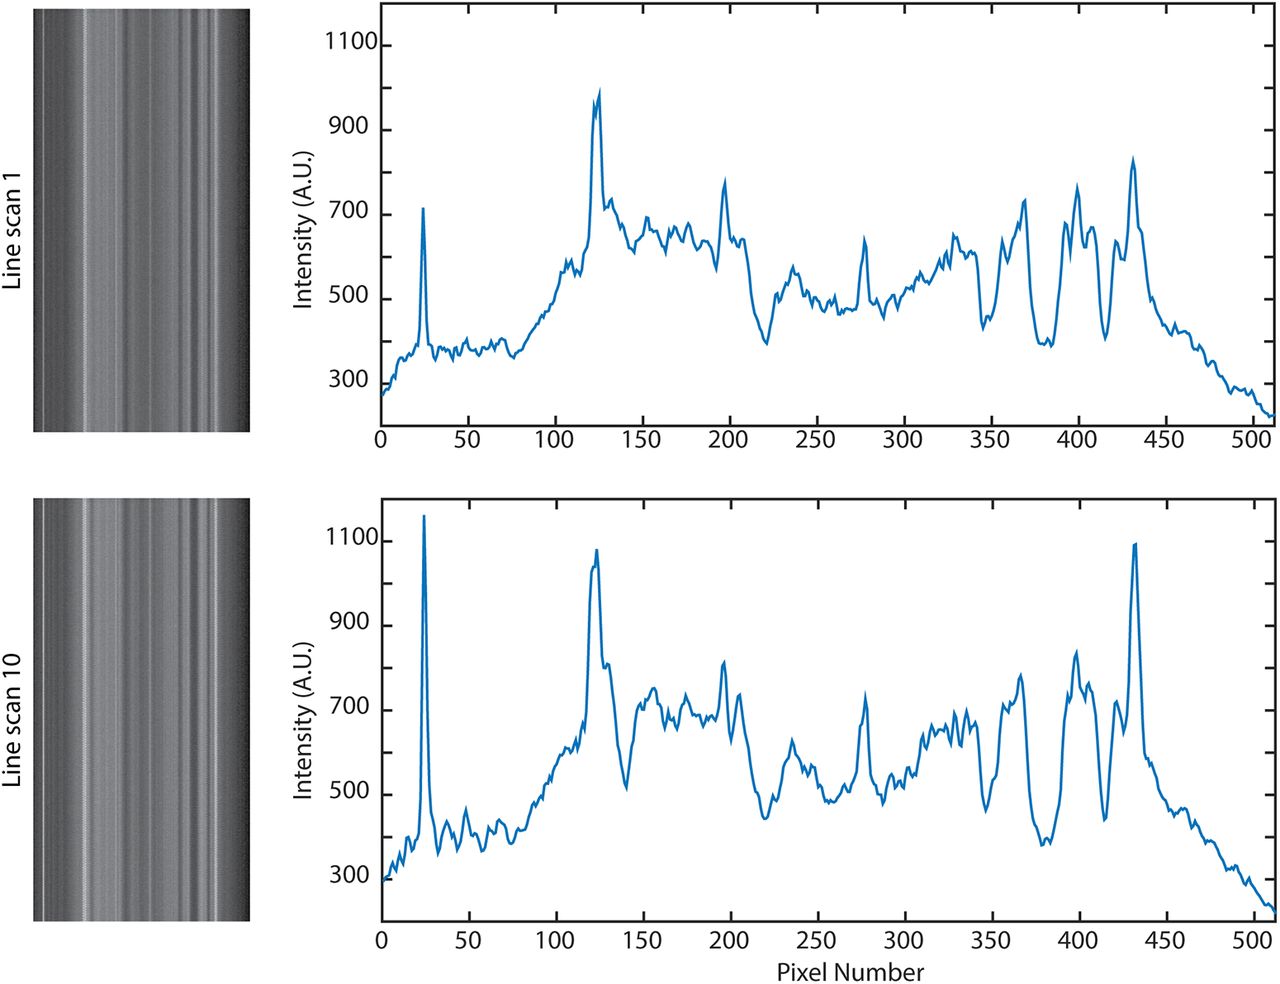
- Figure 11.
Consecutive line scans over the same area do not cause bleaching. Over 10 consecutive line scans (11 s each, during a 5 min period), the brightness did not decrease, although small changes have occurred due to movement.
- Figure 12.
Example spectra from awake recordings with 1 s movement segments separated from 1 s still segments (based on rotation of the treadmill during the 1 s epoch). Movement alters oscillations; however, peaks can be found in both movement and still periods. The small segment size used reduces the frequency resolution of these spectra to 1 Hz, and the low-frequency cutoff to 1 Hz. The number of epochs averaged for each movement trace in each respective graph (top to bottom) are 69, 205, 194, and 161, 1 s each; the number of still epochs averaged are 261, 125, 136, and 169, 1 s each.
- Figure 13.
Gamma and other oscillations disappear under deep anesthesia. Spectrum recorded under awake conditions (magenta) was acquired 30 min after allowing the mouse to wake up from deep anesthesia (>1% isoflurane, temperature control set to 34°C, blue). Theta, beta, and gamma activity bands arise as the mouse wakes up. Each trace is the average of 30 recordings, 11-second each, at a depth of 40 μm below dura.
- Figure 14.
Average frequency spectra. a–f, Average membrane voltage and EEG frequency spectra for awake and lightly anesthetized conditions, separated by cortical depth (210 averages, 7 mice; a–d), and difference between awake and anesthetized spectra (e, f). g, h, Small frequency bands were examined, and the maximum power was plotted for anesthetized (g) and awake (h) spectra. Colors indicate cortical depth; error bars show the SD (7 mice).
- Figure 15.
a, b, Normalized power of frequency bands delta (0.5–4 Hz), theta (4–10 Hz), lower beta (10–20 Hz), upper beta (20–30 Hz), and lower gamma (30–40 Hz) during light anesthesia (a) and wakefulness (b) over cortical depth. c, The difference between wakefulness and light anesthesia was calculated within each mouse, and then averaged. Error bars show the SD (30 trials for each of six mice at each depth, so n = 360).


Tables
- Table 1
Gamma oscillation peak in ΔF/F, corresponding to the average voltage change if a conversion factor of −0.47%/mV (Kuhn et al., 2004) is applied, and the voltage change under the assumption that only dendrites participate and that 23% of the membrane surface is contributed by dendrites (Braitenberg and Schüz, 1998)
Cortical depth Light anesthesia Awake ΔF/F (%) Average voltage change (mV) Dendritic voltage change (mV) ΔF/F (%) Average voltage change (mV) Dendritic voltage change (mV) 25 μm 0.048 0.10 0.44 0.053 0.11 0.49 50 μm 0.044 0.092 0.40 0.067 0.14 0.62 75 μm 0.045 0.097 0.2 0.057 0.12 0.53 100 μm 0.045 0.095 0.41 0.061 0.13 0.56
In this issue


