

Article Figures & Data
Figures
- Figure 1.
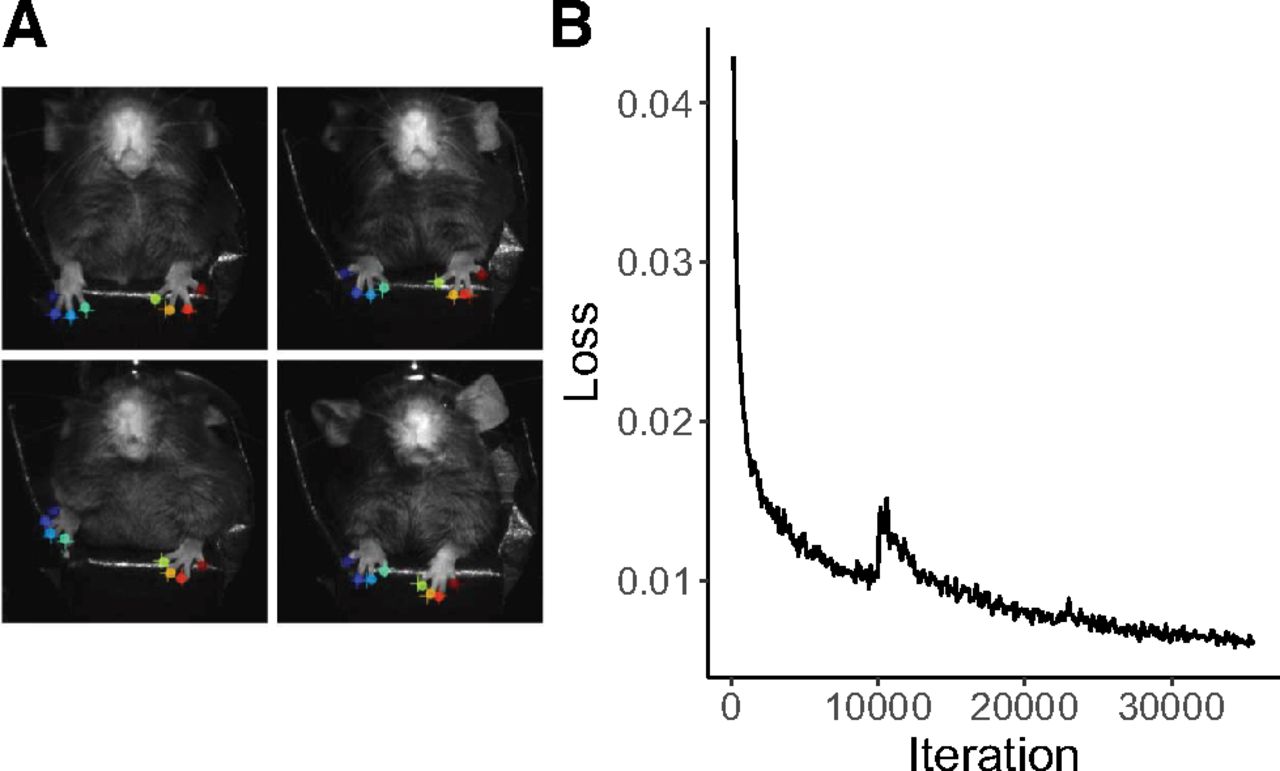
Automated labeling of paws using DeepLabCut for near real-time tracking. A) A comparison of human labels (circles) and DeepLabCut’s automated labels (crosses) for both paws across four different mice in the testing set of the model. B) The loss of our model converged near zero after approximately 30,000 iterations.
- Figure 2.
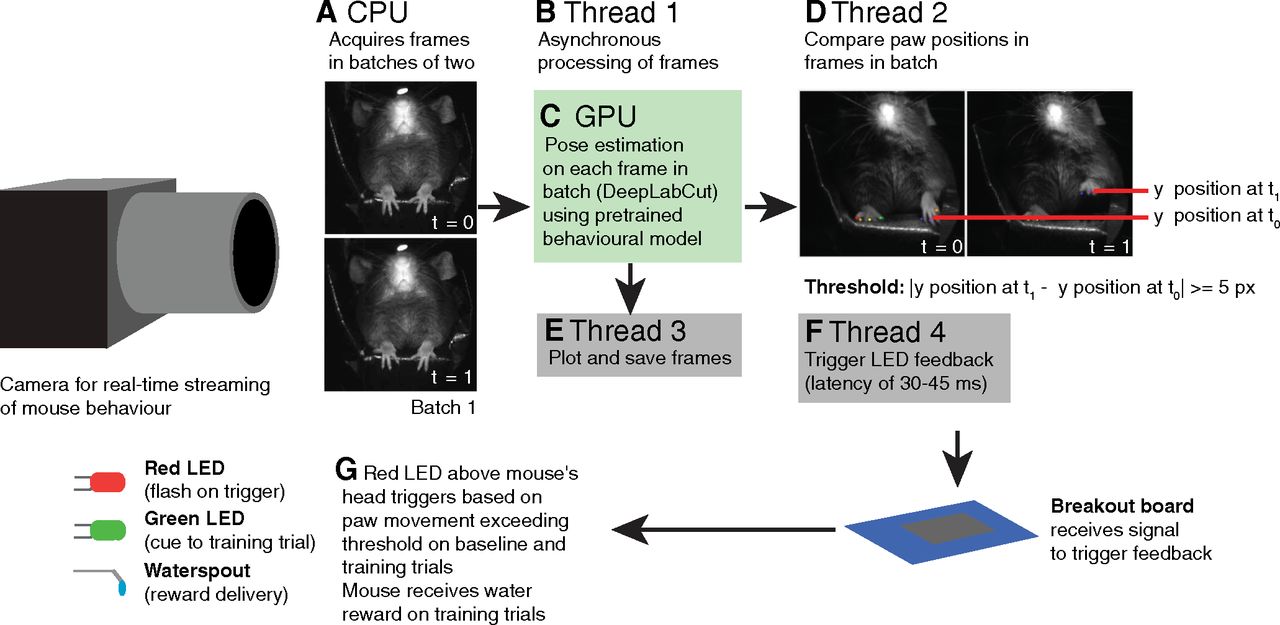
Outline of the acquisition and processing pipeline for selective paw tracking and behavioral triggering. A) Frames are acquired from the camera in batches of two at a time, to enable the direct comparison of movement from one frame to the next. The two frames are passed to a processing thread B) using Python’s _thread library to allow this batch of two frames to be processed simultaneously with the other frames. C) The frames are analyzed for locations of the body parts identified in the user-trained DeepLabCut machine learning model using GPU acceleration, outputting the coordinates of the paw positions. D) The positions of each of the four paws on the mouse’s toes are averaged across each paw; this averaged paw position is used to compare the paw position between the first and second frames of the two-frame batch. If the absolute vertical movement of the left paw equals or exceeds 5 pixels while the vertical movement of the right paw does not exceed 10 pixels, a signal is sent to the GPIO breakout board to trigger the LED. While each frame – labelled with the predicted body part locations – is saved in a separate thread E) to limit computational load on the main thread, the LED feedback itself is sent in another thread F) to ensure that the feedback can be delivered asynchronously relative to the rest of the code. G) The LED, which is attached to the head-fixing pole above the mouse’s head, is illuminated, demonstrating the procedure of feedback to the animal. On training trials, a water reward is also delivered to the animal at this time.
- Figure 3.
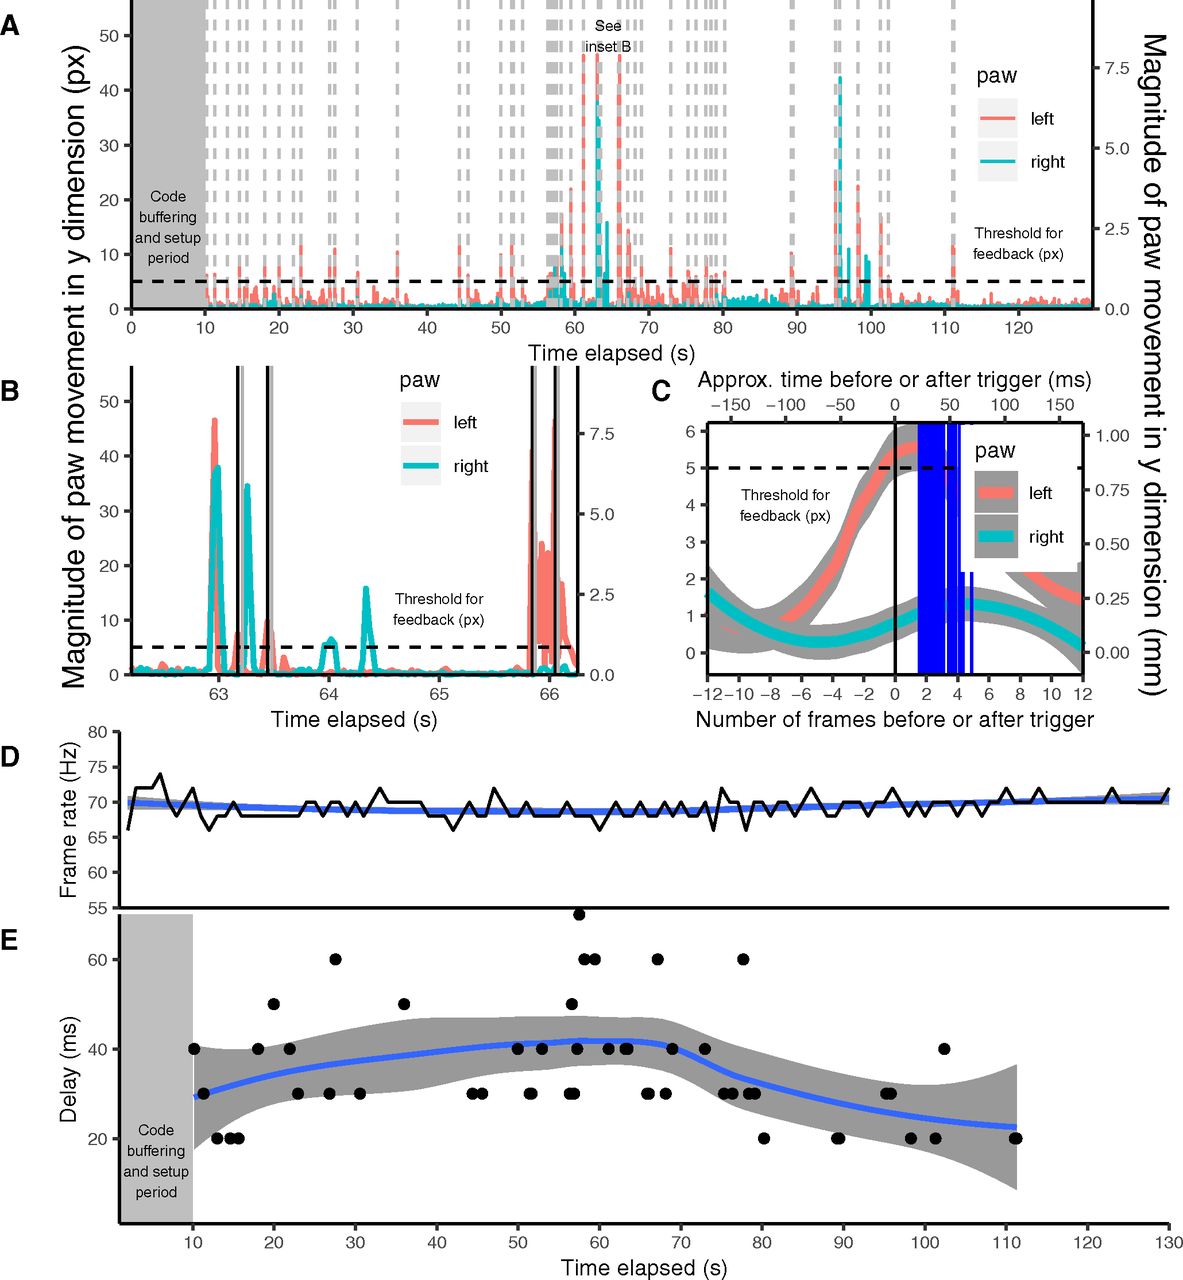
Selective paw movements tracked with short latency and coincident with behavioral feedback triggering. A) Magnitude of movement in the vertical direction for the mouse’s left and right paws across one trial, recorded with an input frame rate of 220 Hz and having an output frame rate of 70 Hz. The dotted vertical lines represent times in the trial when the mouse’s left paw movements exceeded the threshold, triggering feedback via the LED. B) Detail of the mouse’s vertical paw movements over a period of 280 frames. The solid black lines indicate the time at which the frame during which the mouse’s movements crossed the threshold was sent from the camera; the red region and lighter grey line represent the time between frame acquisition and the LED being triggered as feedback. C) Magnitude of movement in the vertical direction for the mouse’s left and right paw for each trigger in the trial depicted in A), averaged for each frame before and after the trigger. Each solid blue line represents a single trigger at the actual time of the trigger, depicting the delay between the time at which the frame containing the above-threshold movement was received and the time at which the command was sent to activate the LED trigger. D) Dynamics of output frame rate for each second during the trial; the background curve is a Loess curve showing the smoothed average frame rate at that moment. E) Time of each behavioral trigger during the trial, plotted against the delay between the time at which the frame containing the above-threshold movement was received and the time at which the command was sent to activate the LED trigger. Note: For all plots with movement distance in mm, this distance in mm was calculated by measuring the width of the floor of the mouse’s tube and cross-referencing this distance with the width of the floor of the mouse’s tube in a frame recorded from this trial, in pixels. For plot C) the time elapsed in milliseconds is an approximate measure because of slight variations in the number of frames processed per second across the trial (as highlighted in D).
- Figure 4.
Example of contrast changes from LED flash during one trial. A) Example of contrast changes from LED flash during one trial. Y axis represents magnitude of contrast level in a user-defined region of interest surrounding the LED relative to baseline, averaged across all trials in which contrast increased by at least three standard deviations above baseline. B) Example of all contrast changes from LED flash during one trial. Y axis represents magnitude of contrast level in a user-defined region of interest surrounding the LED relative to baseline, averaged across all trials in which contrast increased by at least three standard deviations above baseline. Each blue tick (“trigger”) represents a time at which the mouse made a vertical left-paw movement greater than or equal to 5 px while the right paw did not move more than 10 px vertically.
- Figure 5.
Average number of real-time behavioral triggers on baseline and training trials. Error bars represent standard errors of the mean. A) Average number of triggers represents the average number of times, per trial, that animals made a left paw movement greater than or equal to 5 pixels while not simultaneously making a right paw movement greater than 10 pixels. B) Average number of triggers represents the average number of times, per trial, that animals made a right paw movement greater than 10 pixels on the frame immediately after the animal made a left paw movement greater or equal to 5 pixels (while not simultaneously making a right paw movement greater than 10 pixels). On training trials, each trigger was associated with a water reward and flash of the red feedback LED. On baseline trials, each trigger was only associated with a flash of the red feedback LED. We used paired-samples t-tests that were Bonferroni corrected for multiple comparisons to evaluate between-day differences in average trigger count during training on the first day to average trigger counts across all training sessions on all other days. We also used these tests to evaluate within-day differences in average trigger count between training and baseline trials on each day.
- Figure 6.
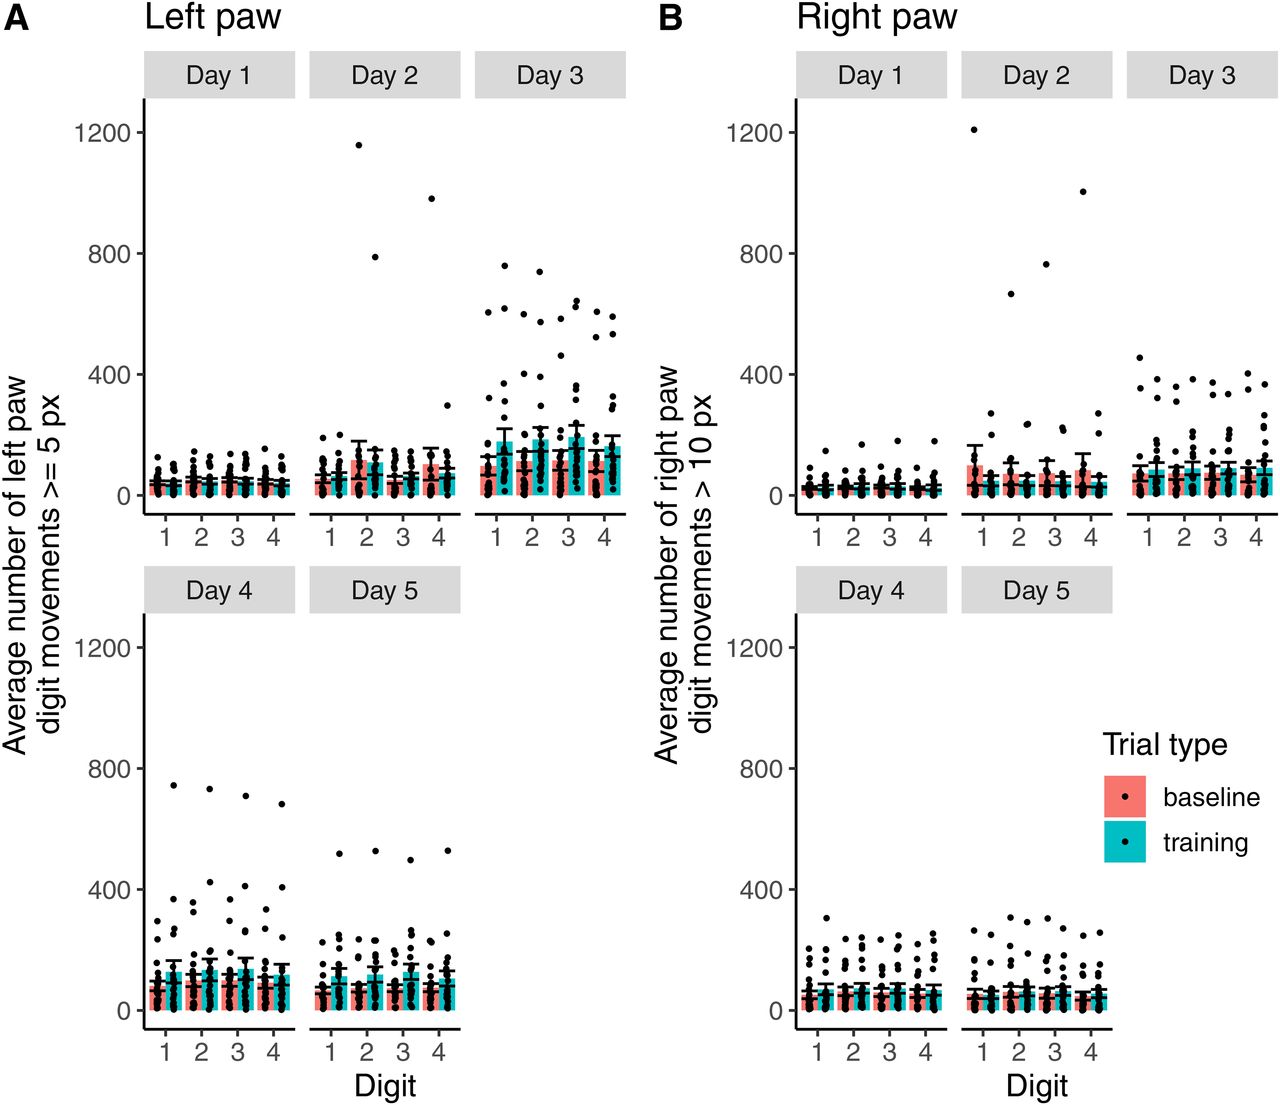
Average number of reaches above threshold on baseline and training trials by digit. A) The average number of vertical left-paw digit movements ≥5 px by digit on training and baseline trials. B) The average number of vertical right-paw digit movements > 10 px by digit on training and baseline trials. Digits are numbered from the rightmost to leftmost digit (from the mouse’s perspective) on each forepaw. We used ANOVAs to evaluate differences in the average number of vertical left-paw digit movements ≥5 px on training and baseline trials per day, and for the average number of vertical right-paw digit movements > 10 px on training and baseline trials per day.
- Figure 7.
Estimation statistics for the mean difference in trigger count between training and baseline trials on each day and between training trials on each day. A) Slopegraph of mean difference in trigger count by animal between training and baseline trials, and the bootstrapped 95% confidence interval around the mean difference. B) The bootstrapped 95% confidence intervals around the mean differences in trigger count on training trials on each day minus the trigger count on training trials on day 1. C) The bootstrapped 95% confidence intervals around the mean differences in trigger count on baseline trials on each day minus the trigger count on baseline trials on day 1.


Tables
Input frame rate (Hz) Mean output frame rate (Hz) SD output frame rate (Hz) Mean delay (ms) SD delay (ms) Mean accuracy SD accuracy n 90 46.95 1.53 34.34 5.94 0.97 0.01 13 180 68.13 5.10 39.85 42.97 0.94 0.02 13 200 70.17 7.07 32.56 10.70 0.95 0.00 13 220 69.31 0.33 33.82 15.10 0.95 0.03 6 270 80.83 18.27 55.93 55.69 0.94 0.01 13 300 91.45 5.27 60.62 77.71 0.94 0.01 11 320 109.76 49.24 53.28 43.80 0.93 0.04 9 Input frame rate, the streaming frame rate set in the software for our camera, representing the frame rate of the camera without any additional analyses; mean output frame rate, the mean number of frames per second processed by our system across all recordings at each input frame rate; SD output frame rate, the SD in the number of frames per second processed by our system across all recordings at each input frame rate; mean delay, the mean amount of time, in milliseconds, between the system receiving a frame that contains a left paw movement exceeding 5 pixels of vertical movement and the system sending a signal to the breakout board to trigger the LED to provide feedback for that movement; SD delay, the SD, in milliseconds, of the delay discussed above; mean accuracy, the mean output of the sigmoid function by TensorFlow for all body parts for all trials at each frame rate; SD accuracy, the SD of the output of the aforementioned sigmoid function; n, the number of trials recorded at each frame rate.
Day Input framerate (Hz) Mean outputframe rate (Hz) SD outputframe rate (Hz) Mean delay(ms) SD delay(ms) Meanaccuracy SDaccuracy n 1 200 65.00 0.53 37.00 10.30 0.99 0.00 21 2 200 66.70 18.26 39.50 10.81 0.94 0.01 20 3 200 66.05 0.65 29.69 7.01 0.90 0.04 24 4 200 65.89 0.57 31.03 7.50 0.95 0.02 24 5 200 65.76 0.54 30.96 8.34 0.95 0.03 21 Input frame rate, the streaming frame rate set in the software for our camera, representing the frame rate of the camera without any additional analyses; mean output frame rate, the mean number of frames per second processed by our system across all recordings at each input frame rate; SD output frame rate, the SD in the number of frames per second processed by our system across all recordings at each input frame rate; mean delay, the mean amount of time, in milliseconds, between the system receiving a frame that contains a left paw movement exceeding 5 pixels of vertical movement and the system sending a signal to the breakout board to trigger the LED to provide feedback for that movement; SD delay, the SD, in milliseconds, of the delay discussed above; mean accuracy, the mean output of the sigmoid function by TensorFlow for all body parts for all trials at each frame rate; SD accuracy, the SD of the output of the aforementioned sigmoid function; n, the number of trials recorded at each frame rate.
Movies
- Movie 1.
This video presents a recording of a mouse's behavior during a training session on the fifth and final day of training. It was created from frames automatically labelled with the position of each digit on each forepaw that were saved during the session, displayed at a frame rate of 30 Hz for clarity. The frames represent 2.90 s of real time recording (at an average frame rate of 65.76 Hz). The lower of the two LEDs in the top right of the image illuminates at the same time as the delivery of a water reward through the spout in front of the mouse's mouth. When there is a set of movements in rapid succession, the LED does not flash for every single movement because it operates with a 300 ms refractory period. This period ensures that the mouse is not reinforced for making a very large quantity of small movements as opposed to discrete, larger movements.
Extended Data 1
Supplementary LED analysis code. Download LED analysis code, ZIP file
Extended Data 2
Supplementary DeepCut2RealTime code. Download DeepCut2RealTime code, ZIP file
In this issue


