

Article Figures & Data
Figures
- Figure 1.
Multisensory responses of mouse OFC single neurons. A, left, Example of electrode tracks (arrowheads) shown in Nissl stains of brain slices showing recording locations in Lateral OFC/Ventral OFC (white box). B, Representative PSTHs of a single OFC neuron in response to auditory (tone = 33.9 kHz, green), visual (LED blink 12.6 lux, pink), and multisensory stimuli (blue). Inset, Spike shape. Mean LFPs on the same channel are shown below each PSTH. Ci–iii, top row, PSTHs of single neurons in response to multiple sound levels of a noise burst (i), multiple frequencies (ii), and multiple intensities of LED blink (iii) are shown. Bottom row, The mean rate response as a function of sound level, frequency, and light intensity are plotted. Asterisks represent the chosen values presented for the M stimulus in each case.
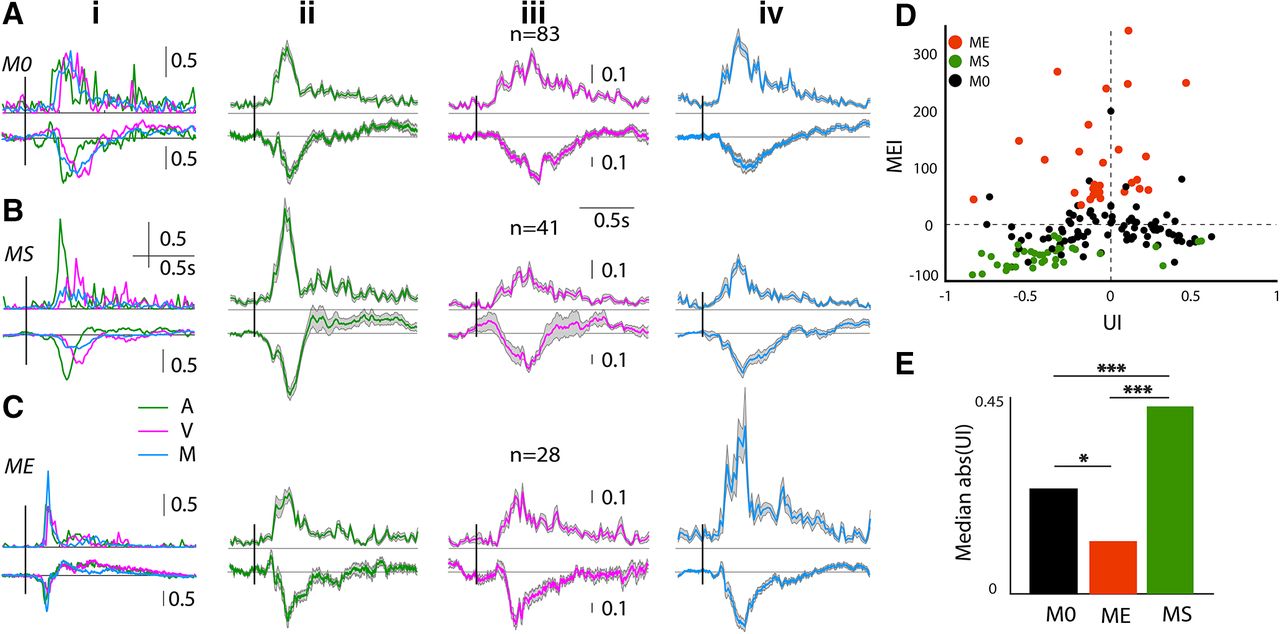
- Figure 2.
Multisensory modulation of mouse OFC single neurons. A–C, Each row shows representative examples of single-unit PSTHs (left column) in response to A (green), V (pink), and M (blue) followed by population PSTHs with SEM (gray shading; normalized by the maximum response of the A and V stimuli) in response to A (second column), V (third), and M (fourth). A, No modulation (M0). B, Suppressed (MS). C, Enhanced (ME). D, Scatter plot of MEI versus UI, each dot represents a single unit and shade indicates the kind of modulation. E, Barplots showing median absolute (UI) of the groups of three kinds of modulation (*p < 0.05, ***p < 0.001); n represents the number of single neurons, vertical bars over the example neurons and population PSTHs is the length of normalized rate responses (a.u.).
- Figure 3.
Dependence of latency and response durations of OFC units to A, V, M stimuli. Ai–iii, CDF plots of latencies of OFC single units with different types of modulations (identified by shading of lines) to A, V, and M (i–iii) stimuli. Aiv, Box plots of latencies of all single units to each of the stimuli, A, V, and M. Bi–iv, Same arrangement of CDF plots and box plots as in A for response duration. ***p < 0.001.
- Figure 4.
Origin of OFC afferents in the early sensory cortex, carrying auditory, visual, and multisensory information. Top row, Brightfield images of the frontal cortex section with retro bead injection site in OFC. Frontal cortical regions overlaid from mouse atlas, A, Summary data of injection sites from five animals in the top row. B, Example sequence of alternate 100-μm fluorescent images of sections encompassing rostrocaudal extent of the ACX. C, Sample areas in AuD and V2L (white boxes in B) with retro bead labeled cell bodies (marked by arrows). D, Number of labeled cells observed in the different areas.
- Figure 5.
Origin of OFC afferents in the early sensory cortex, carrying auditory, visual, and multisensory information. A, Nissil stain of an example brain section including the ACX showing electrode tracks (arrows) for recording locations. Bi, The rms amplitude of LFP responses to A (left) and V (right) for each of the four successive (medial to lateral, ML) recording sites (as in A) with 4 × 4 MEAs in an example mouse, overlaid with mean rms amplitude profile. Bii, Latency profile of the locations in Bi for both auditory (left), visual (right), overlaid with mean latencies. Biii, Mean ML profiles of rms response (left) and latency (right) to A and V averaged across four mice. C, Normalized PSTHs of 147 multisensory single units recorded from regions of ACX and VCX immediately dorsal to A1 (n = 18 mice) shown as rows in grayscale, in response to A, V, and M (upper, middle, and bottom). Mean of the normalized PSTHs with SEM (gray shading) in each case is overlaid. Vertical bar alongside is the length of normalized rate responses (a.u.).
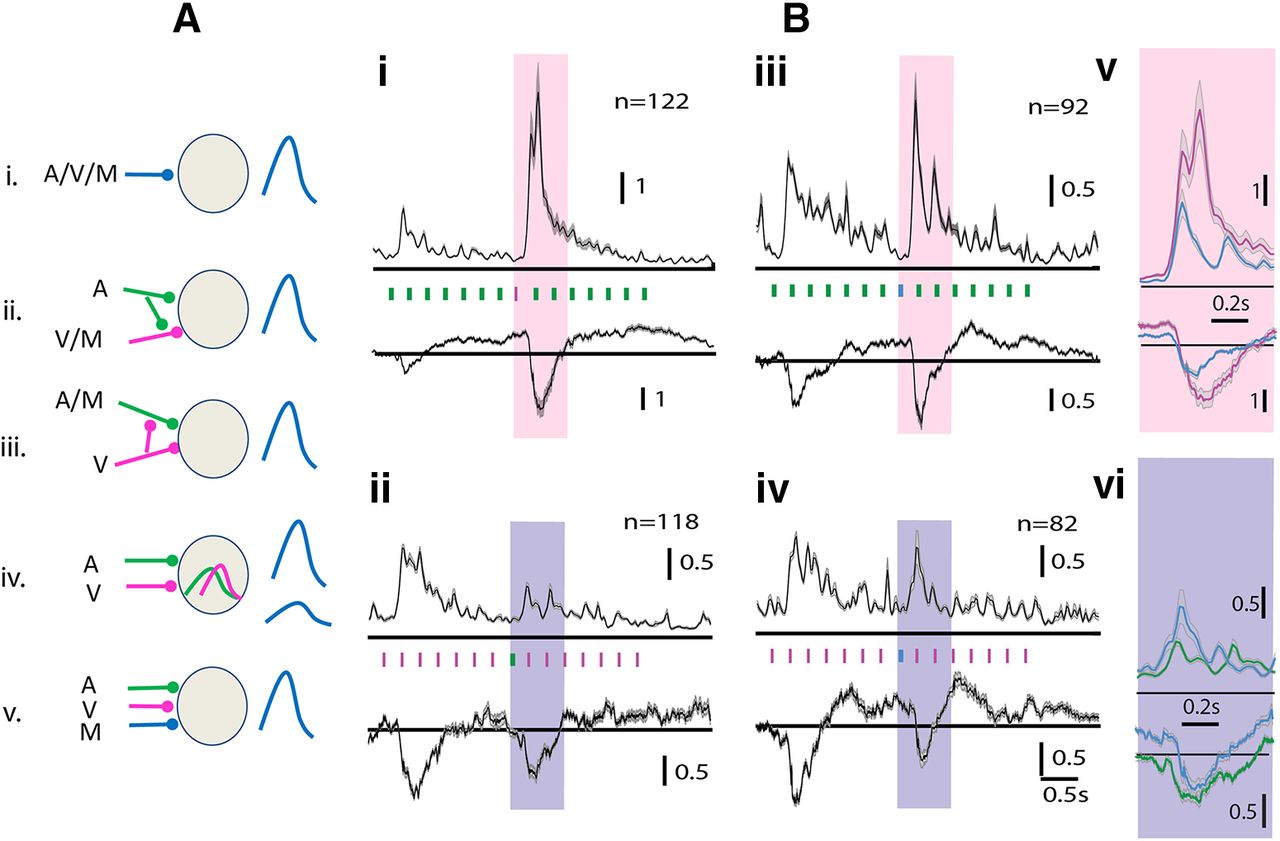
- Figure 6.
Multisensory oddball stimulation shows the presence of separate A, V, and M inputs to the OFC. Ai–v, Possible models of synaptic inputs on a single OFC neuron. Bi–vi, Multisensory oddball responses in mean normalized population PSTHs (and LFPs, below) are shown with (i) standard = A and deviant = V, (ii) standard = V and deviant = A, (iii) standard = A and deviant = M, and (iv) standard = V and deviant = M. Vertical bars between a PSTH and LFP (Bi–v) shows time of stimulus tokens. Colored rectangles (pink and purple) mark the response to the deviant, being compared (enlarged) in Bv and Bvi, respectively.
- Figure 7.
Population effects of audiovisual associations in the OFC. Row A, Experimental protocol is displayed in cartoon form along with reponse PSTHs for the same conditions. B–E, Each row shows PSTHs with SEM of populations of OFC single neurons combined across different experiments. Row B, Case of audiovisual pairing. Row C, Stability control (no exposure in between). Row D, Auditory only control. Row E, Visual only control. First two columns of all rows show mean responses (to 30 iterations) to A and V before the A-V pairing (or each of the control exposure), and the last two columns of all rows show the same after A-V pairing (or each of the control exposure). The middle column shows mean responses (to 100 iterations) during the A-V pairing (or each control exposure).
- Figure 8.
Differential rapid plasticity in A and V responses with A-V association. A–F, Each panel is organized in the same way showing scatter plots of after versus before responses of single neurons in OFC-spikes (A, B), OFC-LFP (C, D), and ACX-spikes (E, F) to auditory (A, C, E) and visual (B, D, F) stimuli. A–D are for data from the OFC, and E, F are for data recorded in AuD/V2L. Each row has four plots (i–iv) starting with A-V pairing followed by the three control cases. Gi, The response to A and V before (upper) and after (lower) pairing is shown with the population mean PSTHs (above) and mean LFPs (below). Overlaid on them are responses to M (before: based on the first 10 trials of pairing and after: based on the last 10 trials of pairing). Gii,iii, Distribution of latency differences between first and last 10 trials of pairing response and scatter plot of mean response rate of last 10 trials versus the first 10 trials. *p < 0.05, **p < 0.01, ***p < 0.001, ns = non significant.
- Figure 9.
Network model to explain the observations. Hypothetical network model showing inputs to the OFC: three excitatory inputs, A, V, and M (green neurons, blue synapses) and two inhibitory inputs, AI and MI (yellow) neurons with red synapses. MI (a low threshold inhibitory) also inhibits the A and V input neurons and another inhibitory neuron VI (low threshold inhibitory) inhibits A. Three separate input populations, along with a parallel (unknown, indicated by black box) auditory input to OFC (black neurons projecting to A, V, and M) activated in the presence of A, V, and M stimuli, respectively (M stimulus also activates inputs to A and V) form the overall inputs to the network.


In this issue


