

Article Figures & Data
Figures
- Figure 1.
TrAC permits fluorescent labeling of genetically defined neuron populations based on axonal projections. Schematic diagrams show a simple version of TrAC using two recombinases and a dual-recombinase-responsive fluorescent indicator allele. Fluorescent labeling is restricted to neurons expressing recombinase A which project to the brain region injected with the retrograde-transported virus encoding recombinase B.
- Figure 2.
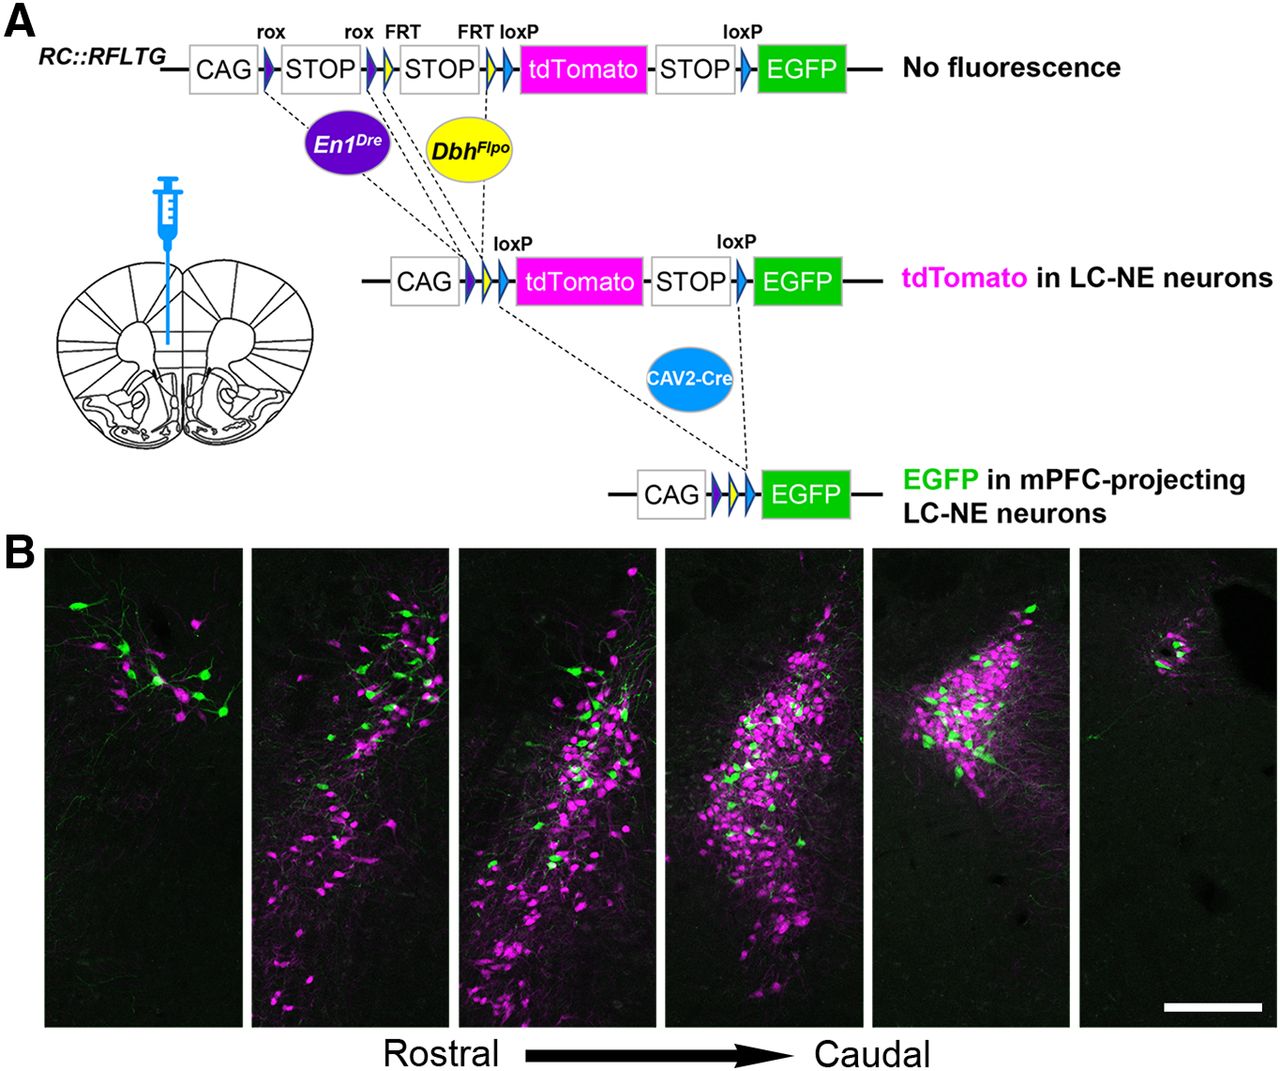
Location of mPFC-protecting noradrenergic neurons within the LC. A, Schematic diagram of the RC::RFLTG indicator allele and coronal schematic of mouse forebrain section showing position of CAV2-Cre injection. B, Representative coronal sections through the rostrocaudal extent of the ipsilateral LC from a TrAC-LC mouse (40-μm free-floating sections) showing distribution of EGFP-labeled (green) and tdTomato-labeled (magenta) neurons. Scale bar, 200 μm.
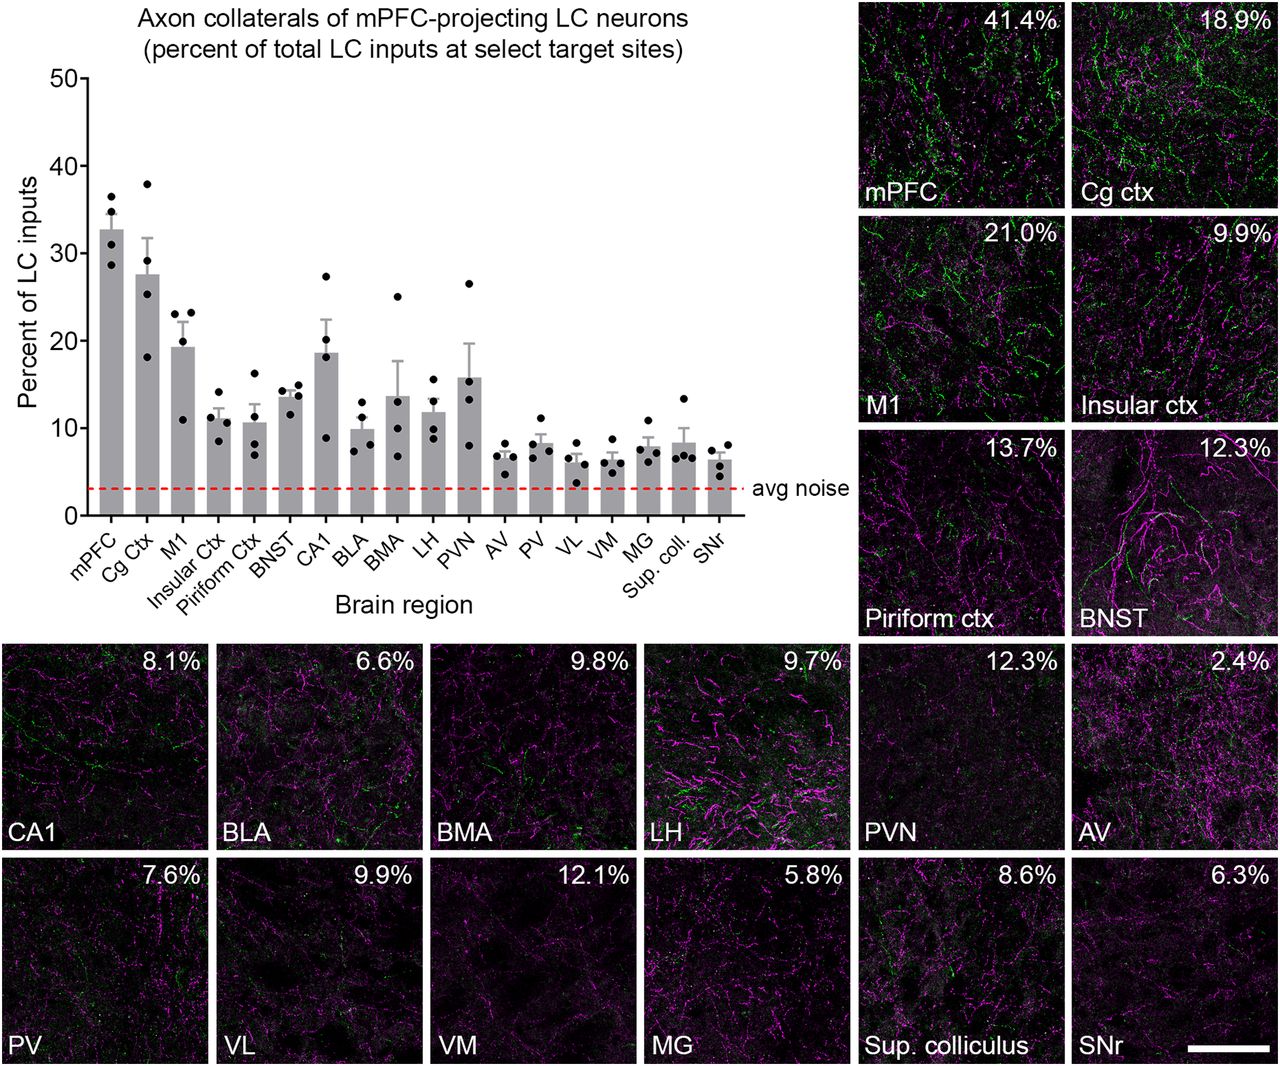
- Figure 3.
Distribution of axon collaterals from LC neurons projecting to mPFC. Representative fluorescent images show Cre+ (EGFP-labeled, green) and Cre-negative (tdTomato-labeled, magenta) axons in select forebrain and midbrain regions of a TrAC-LC mouse injected with CAV2-Cre in mPFC. Numbers in the upper right corner of each image indicate the percent of LC-NE axons in the image that are EGFP+. The bar graph (n = 4 mice) indicates percentage of LC-NE axons at each brain region that originate from EGFP+ mPFC-projecting LC-NE neurons (mean ± SEM). The dotted line represents the noise in the green channel (average green pixel count in areas qualitatively lacking EGFP-labeled axons divided by average total pixel count). Percentages below the dotted line are indistinguishable from noise. The scale bar for fluorescent images indicates 100 μm, and each image represents 13% of the volume quantified in the bar graph. mPFC, medial prefrontal cortex; Cg Ctx, cingulate cortex; M1, primary motor cortex; BNST, bed nucleus of the stria terminalis; CA1, area CA1 of the hippocampus; BLA, basolateral amygdala; BMA, basomedial amygdala; LH, lateral hypothalamus; PVN, paraventricular hypothalamic nucleus; AV, anteroventral thalamic nucleus; PV, paraventricular thalamic nucleus; VL, ventrolateral thalamic nucleus; VM, ventromedial thalamic nucleus; MG, medial geniculate nucleus; Sup. coll., superior colliculus; SNr, substantia nigra.
- Figure 4.
Location of motor cortex-projecting noradrenergic neurons within the LC. A, Coronal schematic of mouse forebrain section showing position of CAV2-Cre injection. B, Representative coronal sections through the rostrocaudal extent of the ipsilateral LC from a TrAC-LC mouse (40-μm virtual sections from PACT-cleared tissue) showing distribution of EGFP-labeled (green) and tdTomato-labeled (magenta) neurons. Scale bar, 200 μm.
- Figure 5.
Distribution of axon collaterals from LC neurons projecting to motor cortex. Representative fluorescent images show Cre+ (EGFP-labeled, green) and Cre-negative (tdTomato-labeled, magenta) axons in select forebrain and midbrain regions of a TrAC-LC mouse injected with CAV2-Cre in M1. Numbers in the upper right corner of each image indicate the percent of LC-NE axons in the image that are EGFP+. The bar graph (n = 3 mice) indicates the percentage of LC-NE axons at each target region that originate from EGFP+ M1-projecting LC-NE neurons (are mean ± SEM). The dotted line represents the noise in the green channel (average green pixel count in areas qualitatively lacking EGFP-labeled axons, divided by average total pixel count). Percentages below the dotted line are indistinguishable from noise. The scale bar for fluorescent images indicates 100 μm, and each image represents 13% of the volume quantified in the bar graph.
- Figure 6.
Distribution of axon collaterals from mPFC-projecting and M1-projecting LC-NE neurons differs from that of the LC as a whole and from each other. Bar graphs show fractional distribution of labeled mPFC-projecting, M1-projecting, or all LC-NE neurons at select target regions. Axon density at each region is represented as a fraction of labeled axons in all imaged regions. Bar graph data are mean ± SEM and were analyzed by two-way repeated measures ANOVA. A, Comparison of mPFC-projecting (n = 4 mice, EGFP+) and all LC-NE neurons (n = 7 mice, sum of EGFP+ and tdTomato+ axons). LC subpopulation by target region interaction: F(17,153) = 8.072, p < 0.0001. Bonferroni post hoc test, ****p < 0.0001 [95% confidence interval of difference (CI of diff.): mPFC, −0.1441 to −0.06482; Cg Ctx, −0.1059 to −0.02655; AV, 0.03218 to 0.1115]. B, Comparison of M1-projecting (n = 3 mice, EGFP+) and all LC-NE neurons (as above). LC subpopulation by target region interaction: F(17,136) = 21.87, p < 0.0001. Bonferroni post hoc test, *p = 0.0176, Cg Ctx (95% CI of diff.: −0.08,684 to −0.004373), *p = 0.0117 PV (95% CI of diff.: 0.005982 to 0.08845), ****p < 0.0001 (95% CI of diff.: mPFC, −0.2037 to −0.1213; M1, −0.2007 to −0.1182; AV, 0.06125 to 0.1437). C, Comparison of mPFC-projecting and M1-projecting LC-NE neurons. Injection site by target region interaction: F(17,85) = 5.152, p < 0.0001. Bonferroni post hoc test, *p < 0.0217 (95% CI of diff.: 0.004639 to 0.1114), ****p < 0.0001 (95% CI of diff.: 0.08626 to 0.1930).


Tables
Data structure Type of test 95% confidence interval of difference a Normal Unpaired t test 1.144 to 28.02 b Normal Unpaired t test –16.90 to 17.99 c Normal Two-way repeated measures ANOVA
(Bonferroni post hoc test)0.004639 to 0.1114 d Normal Two-way repeated measures ANOVA
(Bonferroni post hoc test)0.08626 to 0.1930 e Normal Unpaired t test 0.006947 to 0.1453 See also Figure 6 legend.
In this issue


