

Article Figures & Data
Figures
- Figure 1.
Experimental time-line diagram illustrating the temporal sequence of surgery, behavioral tests, killings, and the intervals between them. See also Extended Data Figure 1-1.
- Figure 2.
Groups performance during the cued version of the Morris water maze test at three months postinjection. In this task, the visually cued escape platform was moved to a different quadrant on each of the four daily trials, and average escape latencies ( A ) and swim distances ( B ) were recorded. Each point represents the mean value ± SEM for the block of four trials administered each day, over the three training days.
- Figure 3.
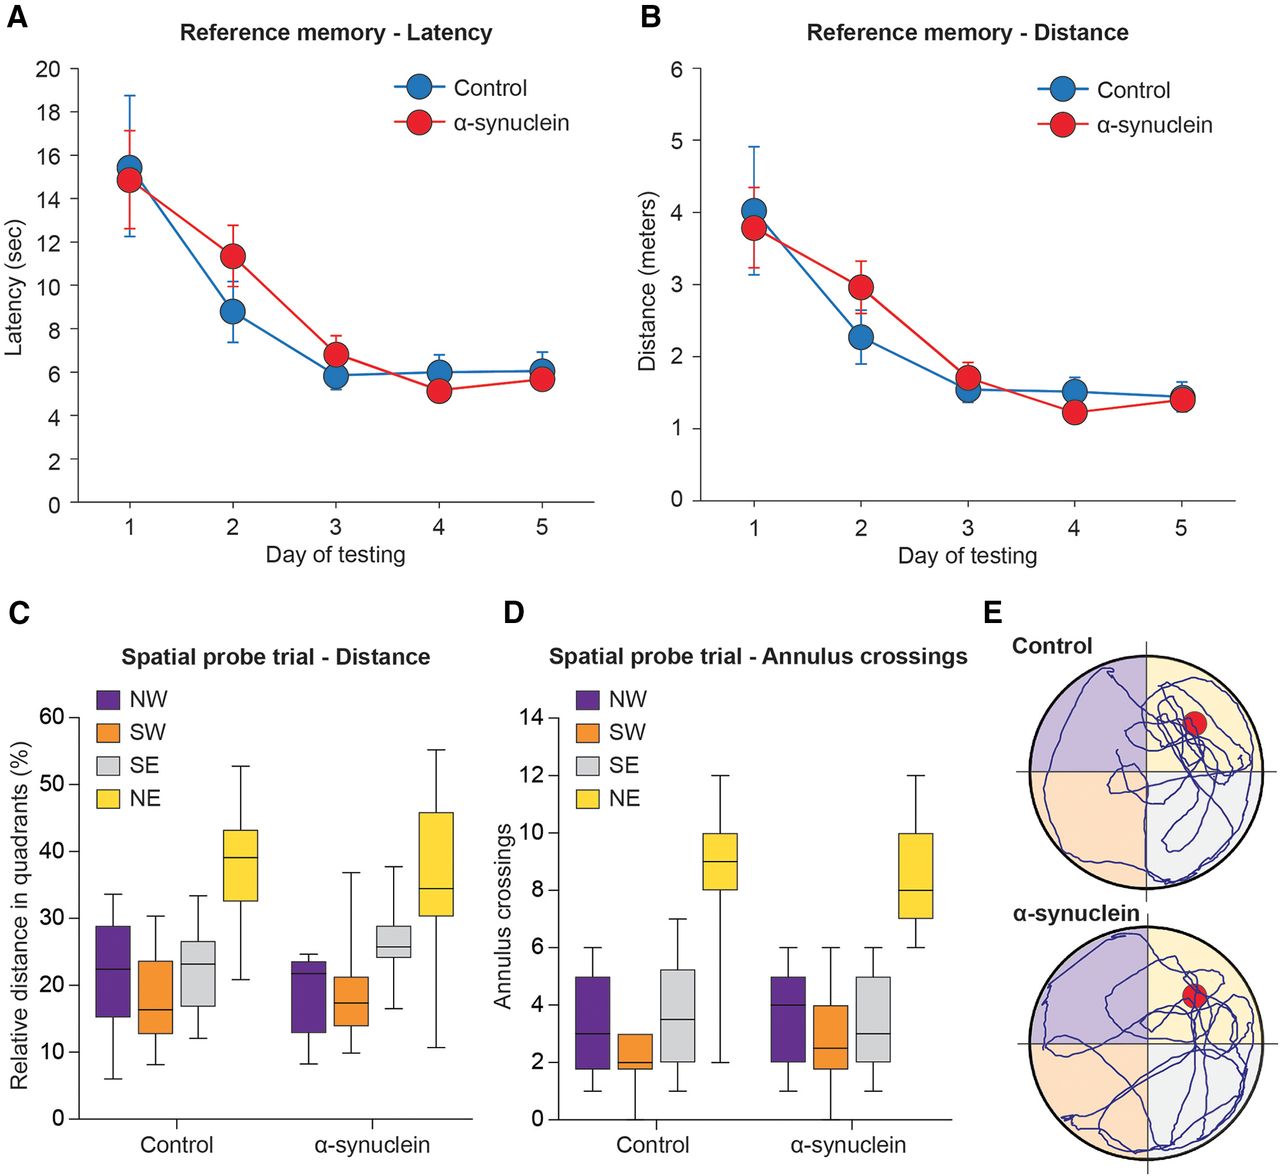
Performance during the Water maze reference memory test at three months postinjection. Average latency ( A ) and swim distance ( B ) required to locate the submerged platform during the acquisition phase of the spatial navigation task. Each sample point represents the mean value ± SEM for the block of four trials on each of the five consecutive days of testing. Lower diagrams illustrate the mean relative distance swum ( C ) and the average number of annulus crossings ( D ) in each quadrant during the spatial probe trial, once the escape platform was removed from the NE (training) quadrant. In E , the actual swim paths taken by representative animals from the different groups are shown. All groups exhibited an equally efficient performance, indicating that the α-syn injection had no effects on this task. NE, North-East; NW, North-West; SE, South-East; SW, South-West.
- Figure 4.
Performance during the spatial probe trial of the separate 3-d Morris water maze test administered just before killing, at 12 months postinjection. The mean relative distance swum ( A ), the average number of annulus crossings ( B ), and the actual swim paths taken by representative animals from the different groups ( C ) are illustrated. Consistent with the observations at the three-month time point, no long-term impairments in reference memory abilities were produced by the α-syn treatment.
- Figure 5.
Working memory performance in the RAWM task, at three months postinjection, illustrating latency ( A ) and number of entry errors ( B ) required by the animals to find the hidden platform. Each sample point represents the mean latency and errors ± SEM recorded during each 60-s trial over five consecutive testing days. In the lower diagrams, performances are plotted as percent savings between trials 1 and 2 for latency ( C ) and errors ( D ). In E , the actual swim paths taken by representative animals from the different groups are illustrated. All groups exhibited an equally efficient performance, indicating no clear-cut effects of α-syn on working memory at this time point.
- Figure 6.
Working memory performance during the two trials RAWM, from five to 12 months postinjection. Data represent the percentage rate of improvement between the first and the second trial (savings) in latency ( A ) and errors ( B ). All groups exhibited an equally efficient working memory during the first two blocks of weekly sessions, administered at five and seven months postinjection, respectively; however, α-syn-treated animals progressively worsened their performance and appeared significantly impaired during the third block of sessions, administered every two weeks. In C , the actual swim paths taken by representative animals from the different groups in the various blocks are illustrated. Asterisks indicate significant difference from control at p < 0.01.
- Figure 7.
Representative micrographs illustrating, on the coronal plane, the negligible expression of PK-resistant α-syn immunoreactivity at seven, nine, and 12 months postinjection in the hippocampal DG ( A–C , insets shown in A’–C’ ) and in the CA1 region ( D–F , insets shown in D’–F’ ) of control rats. Progressive aggregation of α-syn after injection of recombinant mouse α-syn fibrils into the hippocampus. Compared with control, a strong PK-resistant α-syn immunoreactivity was found at seven, nine, and 12 months postinjection in the DG ( G–I , insets shown in G’–I’ ) and in the CA1 region ( J–L , insets shown in J’–L’ ) of injected rats. PK-resistant α-syn aggregates occurred as darkly stained LB-like (arrows) and LN-like deposits (arrowheads) and are shown at higher magnification in M , N . Box-whiskers plots illustrate the stereologically estimated numbers at different time points ± min to max value of LB-like ( O ) and LN-like ( P ) inclusions in the hippocampus of rats injected with the α-syn fibrils. Scale bars: 500 μm (in A , D , G , J for A–C , D–F , G–I , J–L ), 100 μm (in A’ , D’ , G’ , J’ for A’–C’ , D’–F’ , G’–I’ , J’–L’ ), and 5 μm ( M , N ). Asterisk in O indicates significant time-dependent changes at p < 0.05.
- Figure 8.
Representative micrographs illustrating, on the coronal plane, the negligible expression of PK-resistant α-syn immunoreactivity at seven, nine, and 12 months postinjection in the entorhinal cortex ( A–C , insets shown in A’–C’ ) of control rats. Progressive α-syn aggregation after injection of recombinant mouse α-syn fibrils into the hippocampus. A strong PK-resistant α-syn immunoreactivity occurring as both LB-like (arrows) and LN-like (arrowheads) deposits was also found at seven, nine, and 12 months postinjection in the entorhinal cortex ( D–F , insets shown in D′–F′ ) of injected rats. Box-whiskers plots illustrate the stereologically estimated numbers at different time points ± min to max value of LB-like ( G ) and LN-like ( H ) inclusions in the two entorhinal cortex of the injected rats. Scale bar: 500 μm (in A , D for A–C , D–F ) and 100 μm (in A’ , D’ for A’–C’ , D’–F’ ). Asterisks in G , H indicate significant time-dependent changes at p < 0.05.
- Figure 9.
Representative micrographs illustrating, on the coronal plane, the negligible expression of PK-resistant α-syn immunoreactivity at seven, nine, and 12 months postinjection in the vertical limb of the DBB (vDBB; A , inset shown in A′ ), and the anterior and posterior piriform cortices (aPC and pPC; B , C , respectively, insets shown in B′ , C′ ). Spreading of α-syn aggregates. A strong PK-resistant α-syn immunoreactivity was also found at 12 months postinjection in the vDBB ( D , inset shown in D′ , arrow) and the anterior and posterior piriform cortices (aPC and pPC, E , F, insets shown in E′ , F′ ; arrows and arrowheads indicate LB-like and LN-like inclusions, respectively). Scale bar: 100 μm (in A , D , for A–C , D–F ) and 50 μm ( D for D–F ). Cresyl violet staining of the entorhinal cortex (ENT CTX), hippocampus (HPC), and piriform cortices (PC) of control ( G , H , I , respectively) and α-syn-injected animals ( J , K , L , respectively). Scale bar: 100 μm (in G for G–L ).
- Figure 10.
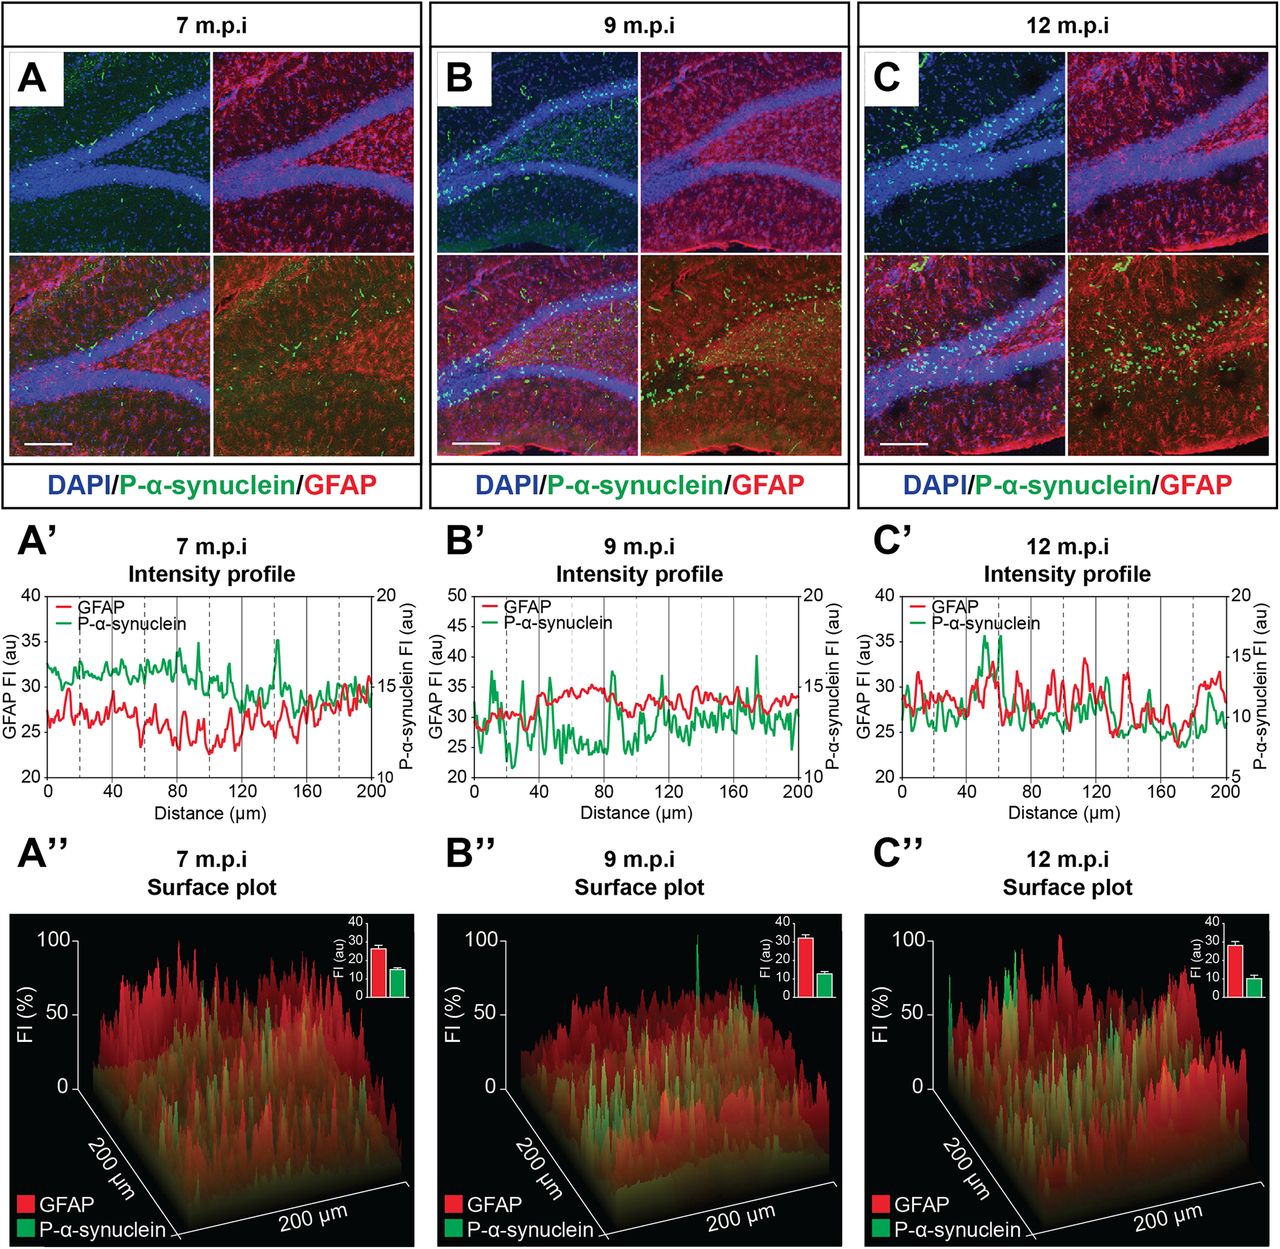
Confocal microscopy images illustrating the progressive increase of hippocampal Ser129-phosphorylated α-syn ( A–C ) and the lack of co-localization with GFAP at seven, nine, and 12 months after the injection of recombinant mouse α-syn fibrils into the hippocampus. In the lower diagrams, analysis of fluorescence intensity ( A’–C’ ) and surface plot profiles ( A”–C” ) of confocal images in A–C indicate very poor or no glial occurrence of the Ser129-phosphorylated α-syn. Scale bars: 50 μm ( A–C ).
- Figure 11.
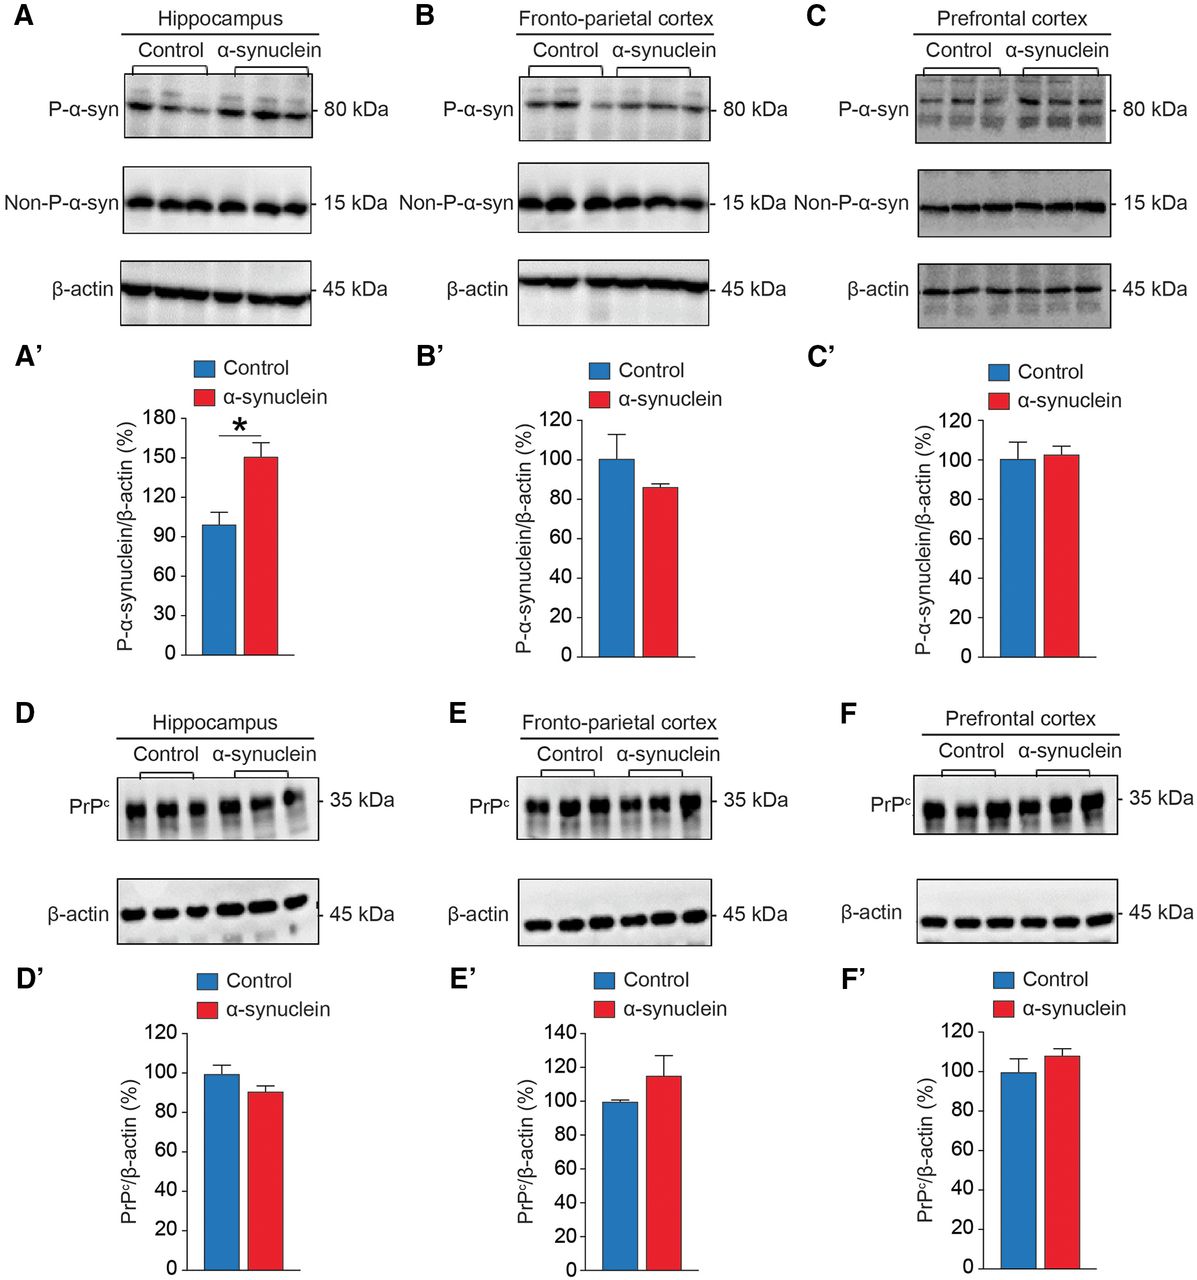
Long-term effects of intrahippocampal α-syn fibril injection on regional tissue levels of Ser129-phosphorylated α-syn (P-α-syn), non-phosphorylated α-syn (non-P-α-syn), and PrPc. Representative Western blotting bands and densitometric analyses illustrate the expression levels of the various proteins in the hippocampus ( A , A’ , D , D’ ), fronto-parietal cortex ( B , B’ , E , E’ ), and prefrontal cortex ( C , C’ , F , F’ ) of rats injected with α-syn fibrils and controls at 12 months postinjection. The values are shown as a percentage of P-α-syn, non-P-α-syn forms, or PrPc relative to β-actin, this latter being the loading control. Data are represented as mean ± SEM. Asterisk in A’ indicates significant difference from control at p < 0.05.
- Figure 12.
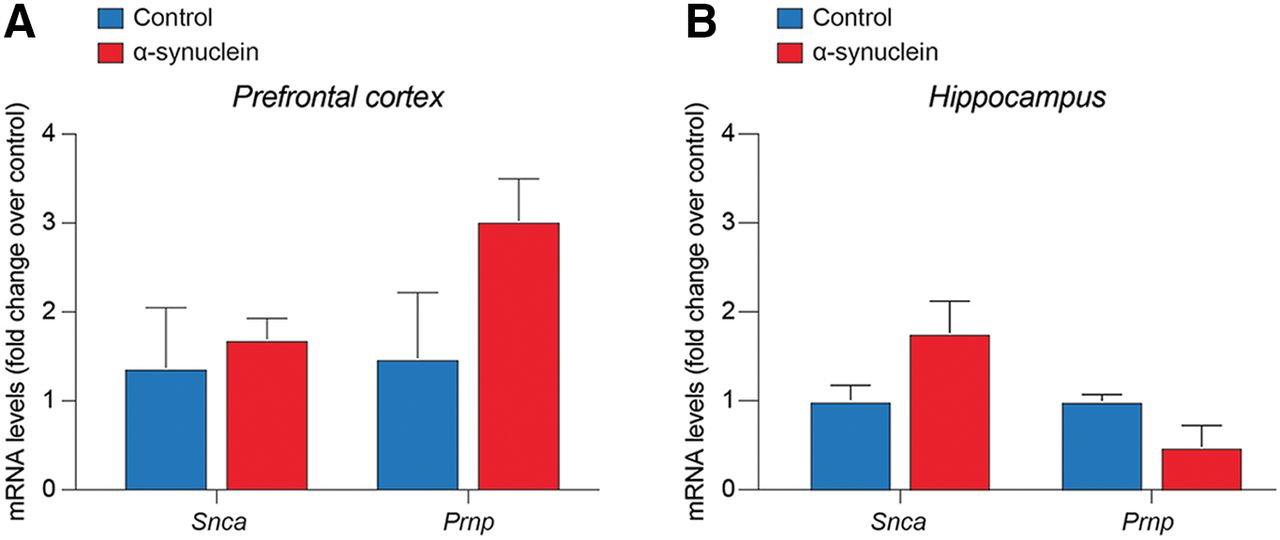
Quantification of the mRNA expression levels of Snca and Prnp in prefrontal cortex ( A ) and in the hippocampus ( B ) of rats injected with α-syn fibrils and controls at 12 months postinjection. Data are represented as mean fold change over control ± SEM.


Extended Data
Extended Data Figure 1-1
AFM micrograph showing the assemblies of the pre-aggregated α-syn fibrils prior to their intrahippocampal inoculation. Scale bar: 1 μm. Download Figure 1-1, TIF file
In this issue


