

Article Figures & Data
Figures
- Figure 1.
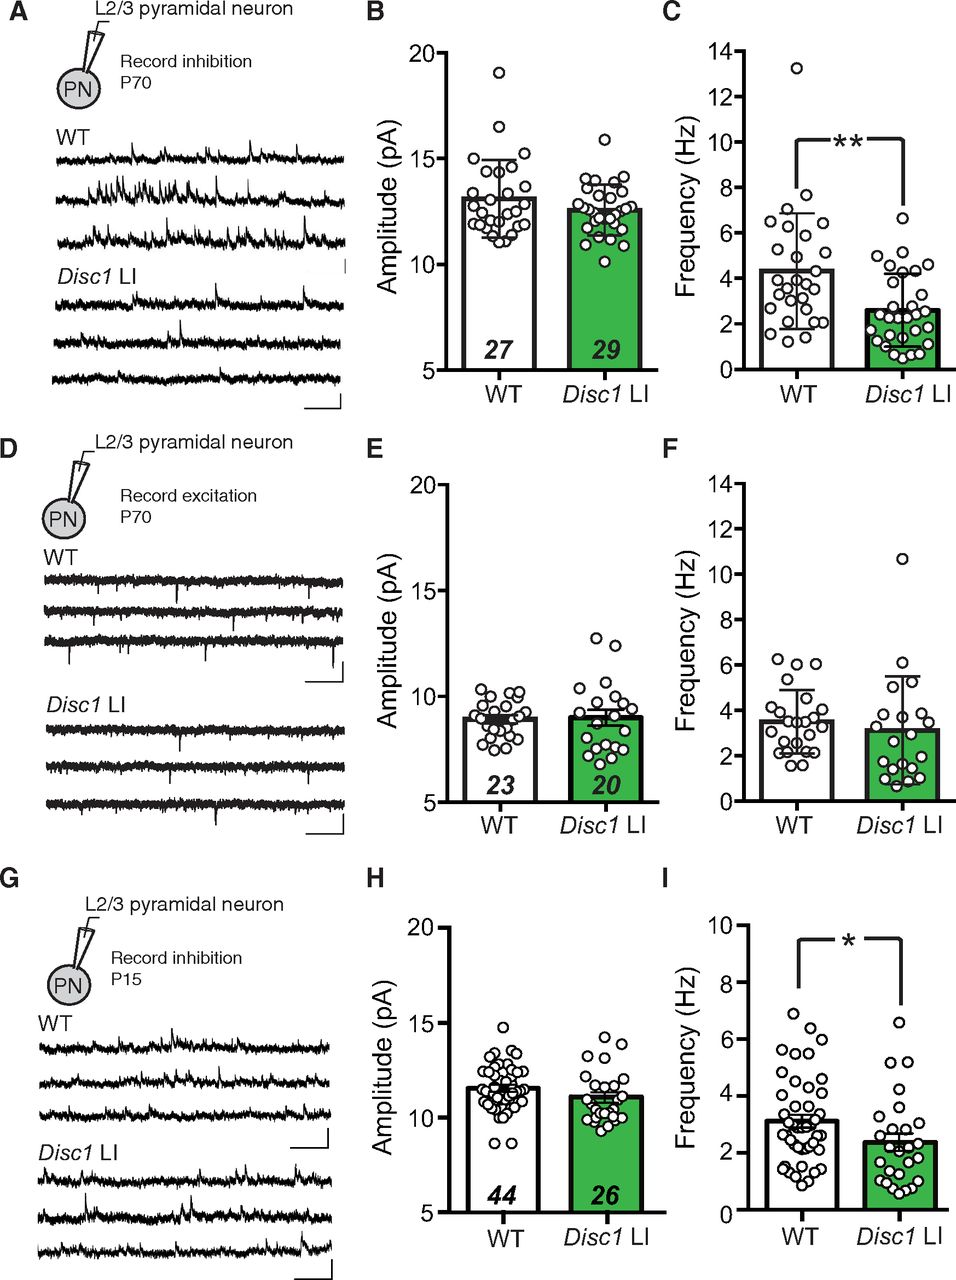
Reduced inhibitory synaptic transmission onto L2/3 pyramidal neurons in the mPFC of adult and juvenile Disc1 LI mice. A, Recording configuration and sample mIPSC traces recorded from L2/3 PNs in the mPFC of WT (upper) and Disc1 LI (lower) mice at ∼P70. B, mIPSC amplitude (WT, n = 27 cells; Disc1 LI, n = 29 cells). C, mIPSC frequency (WT, n = 27 cells; Disc1 LI, n = 29 cells; **p < 0.01, Mann–Whitney U test). D, Recording configuration and sample mEPSC traces recorded from L2/3 PNs in the mPFC of WT (upper) and Disc1 LI (lower) mice at ∼P70. E, mEPSC amplitude (WT, n = 23 cells; Disc1 LI, n = 20 cells). F, mEPSC frequency (WT, n = 23 cells; Disc1 LI, n = 20 cells). G, Recording configuration and sample mIPSC traces recorded from L2/3 PNs in the mPFC of WT (upper) and Disc1 LI (lower) mice at ∼P15. mIPSC (H) amplitude (WT, n = 44 cells; Disc1 LI, n = 26 cells; p = 0.12, t test) and (I) frequency (WT, n = 44 cells; Disc1 LI, n = 26 cells; *p < 0.05, Mann–Whitney U test). All scale bars represent 20 pA, 500 ms. Bar graphs indicate median ± interquartile range (B, C, F, I) or mean ± SEM (E, H), as appropriate.
- Figure 2.
Altered presynaptic function of PV but not SOM INs in the mPFC of Disc1 LI mice. A, Schematic of the experimental configuration. B, Sample traces of PV IN-mediated IPSCs recorded from WT (left panel) or Disc1 LI (right panel) mice. Paired light pulses (1-ms duration; blue bars) were delivered at an interval of 50 ms (top), 100 ms (middle), or 150 ms (bottom). C, Quantification of PPR for each genotype (WT, n = 13 cells; Disc1 LI, n = 10 cells); *p < 0.05, ***p < 0.001, two-way RM ANOVA followed by Sidak’s test. D, Schematic of the experimental configuration. E, Sample traces of SOM IN-mediated IPSCs recorded from WT (left panel) or Disc1 LI (right panel) mice. Paired light pulses (1-ms duration; blue bars) were delivered at an interval of 50 ms (top), 100 ms (middle), or 150 ms (bottom). F, Quantification of PPR for each genotype (WT, n = 15 cells, Disc1 LI, n = 12 cells). G, Sample IPSC traces evoked by optogenetic stimulation of PV or SOM INs. Colored lines indicate exponential fits to the decays of the IPSCs. H, Quantification of IPSC decay tau; ****p < 0.0001, t test. Data in C, F, H are presented as mean ± SEM.
- Figure 3.
Reduced FFI in the MD–mPFC circuit in Disc1 LI mice. A, B, Schematics of the experimental configuration. The right panel of A is an image of a brain section from a mouse used in electrophysiological recording, showing MD infected with AAV-CAG-ChR2-YFP. C, Representative traces of evoked EPSC (recorded at –60 mV) and IPSC (recorded at 0 mV) from L3 PNs. D, To estimate the relative recruitment of disynaptic FFI versus monosynaptic excitation, we divided peak IPSC (Ipeak) by the sum of peak IPSC and peak EPSC (Ipeak + Epeak). WT, N = 14 mice, Disc1 LI, N = 11 mice; ***p < 0.001, t test. E, Same as in D, except that the cumulative probability distributions of the values for individual neurons are shown. WT, n = 40 cells, Disc1 LI, n = 30 cells; **p < 0.01, Kolmogorov–Smirnov test. F, Scatter plot showing the peak amplitudes of IPSC and EPSC for individual neurons. Each circle represents one neuron (WT, n = 30 cells; Disc1 LI, n = 40 cells). Dashed lines are linear regression lines for neurons in WT mice and Disc1 LI mice. The slopes of the regression lines significantly differed at the 0.95 confidence level (*p < 0.05). G, Sample traces of IPSC (recorded at 0 mV) and EPSC (recorded at –60 mV) recorded from L2/3 PNs in response to light-stimulation (blue bars) of MD axons. The latency to onset was measured from the time the light stimulus was triggered to the 10% EPSC (blue arrow) or IPSC (red arrow) rise time. Note that IPSC rise time was calculated from the peak of the inward current recorded at 0 mV. H, Cumulative probability distributions for EPSC latency to onset (left) and IPSC latency to onset (right; EPSC, WT, n = 40 cells, Disc1 LI, n = 30 cells, p = 0.40; IPSC, WT, n = 40 cells, Disc1 LI, n = 30 cells, p = 0.56; Kolmogorov–Smirnov test). I, Quantification of IPSC–EPSC lag, calculated as the difference in the latency to onset between the IPSC and the EPSC of each neuron (see also G; WT, n = 40 cells, Disc1 LI, n = 30 cells; p > 0.05, t test). J, Quantification of the 10–90% EPSC rise time and decay tau (K; WT, n = 40 cells, Disc1 LI, n = 30 cells; p > 0.05, Mann–Whitney U test). L, Quantification of the 10–90% IPSC rise time and decay tau (M; WT, n = 40 cells, Disc1 LI, n = 28 cells; p > 0.05, t test). Data are presented as median ± interquartile range (J, K) or mean ± SEM (D, L, M).
- Figure 4.
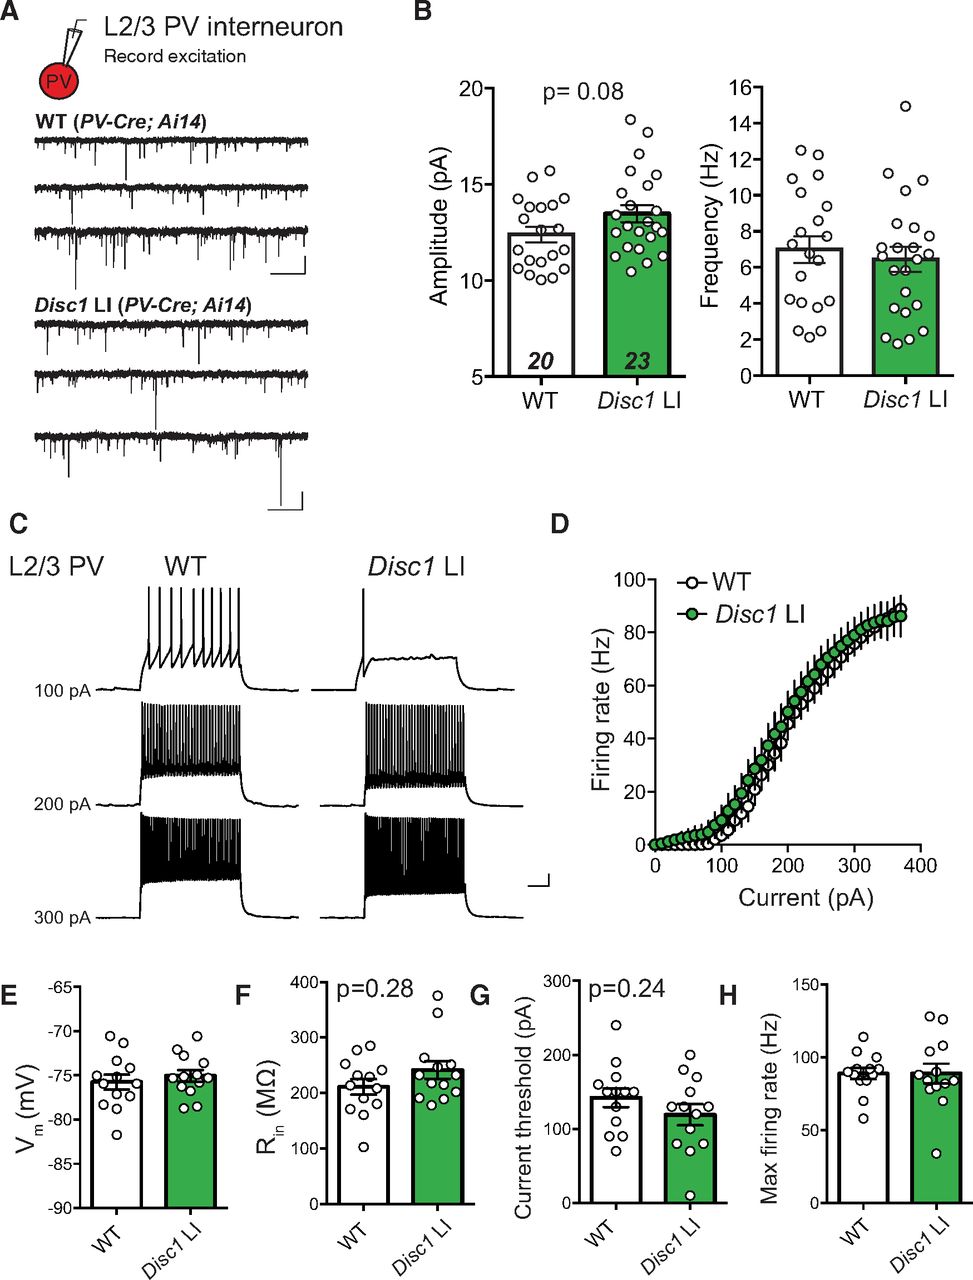
mEPSCs and intrinsic properties of PV INs are not altered in Disc1 LI mice. A, Recording configuration and sample mEPSC traces recorded from PV INs in WT (upper) and Disc1 LI mice (lower). B, Mean mEPSC amplitude (left) and median frequency (right; n = 20, 23 cells/genotype; N = 4 mice/genotype). C, Sample traces from whole-cell current clamp recording of L2/3 PV IN in WT (left) and Disc1 LI mouse in response to current injections. D, Input-output curve showing average firing rate of PV INs in response to current injection in WT versus Disc1 LI. E, Resting membrane potential. F, Input resistance. G, Current threshold required to elicit spiking. H, Maximum firing rate. Data in D, E, H shown as mean ± SEM. Data in F, G shown as median ± interquartile range.
- Figure 5.
Altered presynaptic function of PV INs underlies the deficit of FFI in Disc1 LI mice. A, left, schematic of the experimental configuration. Right: schematic of the recording configuration in the mPFC acute slices. A Tdtomato+ PV IN (red) and an adjacent PN (gray) in L3 of the mPFC were recorded simultaneously or sequentially. EPSCs onto these neurons were evoked by optogenetic stimulation (0.5-ms light pulses; blue bars) of MD axons. B, Sample EPSC traces recorded from PV IN and PN pairs are superimposed and color-coded. C, Quantification of the EPSC peak amplitude. n.s., not significant (p = 1.0); **p < 0.01; Wilcoxon matched-pairs signed ranks test. D, Sample traces of FFI currents recorded from L3 PNs in response to optogenetic stimulation of MD axons. E, Quantification of PPR of the MD-driven FFI onto L3 PNs; ***p < 0.001, Mann–Whitney U test. F, The mean amplitude of the first IPSC was consistent between genotypes. G, FFI PPR plotted against (Ipeak)/(Ipeak + Epeak; as seen in Fig. 3D) within cells shows that for Disc1 LI mice but not WT mice, FFI PPR inversely correlated with (Ipeak)/(Ipeak + Epeak), suggesting that synapses with high FFI PPR also exhibit higher E/I ratio; **p < 0.01. Data in E presented as median ± interquartile range data in F presented as mean ± SEM.


Tables
Data structure Statistical test, post hoc Significance threshold aNon-normal distribution Two-tailed Mann–Whitney U test p < 0.05 bNon-normal distribution Two-tailed Mann–Whitney U test p < 0.05 cNon-normal distribution Two-tailed Mann–Whitney U test p < 0.05 dNormal distribution Two-tailed unpaired t test p < 0.05 eNormal distribution Two-tailed unpaired t test p < 0.05 fNon-normal distribution Two-tailed Mann–Whitney U test p < 0.05 gNormal distribution Two-way RM ANOVA with post hoc Sidak’s test p < 0.05 hNormal distribution Two-way RM ANOVA with post hoc Sidak’s test p < 0.05 iNormal distribution Two-way ANOVA p < 0.05 jNormal distribution Two-tailed unpaired t test p < 0.05 kNormal distribution Two-tailed unpaired t test p < 0.05 lNormal distribution Two-tailed unpaired t test p < 0.05 mNormal distribution Two-tailed unpaired t test p < 0.05 nNormal distribution Two-tailed unpaired t test p < 0.05 oNormal distribution Two-tailed unpaired t test p < 0.05 pNon-normal distribution Wilcoxon matched-pairs signed ranks test p < 0.05 qNon-normal distribution Wilcoxon matched-pairs signed ranks test p < 0.05 rNon-normal distribution Two-tailed Mann–Whitney U test p < 0.05 sNon-normal distribution Two-tailed Mann–Whitney U test p < 0.05
In this issue


