

Article Figures & Data
Figures
- Figure 1.
Spontaneous spike frequency is elevated after chronic activation of Gp1 mGluRs. A, Raster plots of spontaneous spikes from representative 1-min recordings of WT cortical neuron cultures treated with vehicle (DMSO) or DHPG (100 μM) for 24 h at DIV14. Quantification of relative spontaneous spike frequency and synchrony index by comparing “after treatment” to “before treatment” of the same cultures during the 15-min recordings is on the right. B, Representative average traces of spike amplitude from 1-min recordings of WT cortical neuron cultures treated with DMSO or DHPG (100 μM) for 24 h at DIV14. In the traces, the black lines represent the average of all the spikes within representative 1-min recordings. Traces are from the same designated electrodes before and after treatments. Quantification of spike amplitude is done by comparing “after treatment” to “before treatment” during the 15-min recordings from the same cultures; n = 7 and n = 6 independent cultures for DMSO and DHPG treatment groups, respectively. Student’s t test was used. Data are represented as mean ± SEM with **p < 0.01, ns: non-significant.
- Figure 2.
Burst activity is at the baseline after chronic activation of Gp1 mGluRs. Representative traces of burst activity from WT cortical neuron cultures treated with DMSO or DHPG (100 μM) for 24 h at DIV14. Traces are from the same designated electrode “before” and “after” drug treatments. Quantification of burst duration and relative number of spikes per burst by comparing “after treatment” to “before treatment” during the 15-min recordings from the same cultures is on the right; n = 7 and n = 6 independent cultures for DMSO and DHPG treatment groups, respectively. Student’s t test was used. Data are represented as mean ± SEM with ns: non-significant.
- Figure 3.
Chronic activation of Gp1 mGluRs leads to proteasomal degradation of Akt. A, Representative Western blottings of Akt, p-Akt, ERK, p-ERK, and Gapdh, and their quantification from WT cortical neuron cultures treated with DMSO or DHPG (100 μM) for 24 h at DIV14 (n = 8 and n = 9 sets of cultures for detecting Akt and ERK, respectively). B, RT-qPCR of Akt mRNA, using two different pairs of primers, normalized to Actin mRNA from WT cortical neuron cultures treated with DMSO or DHPG (100 μM) for 24 h at DIV14 (n = 4). C, Representative Western blottings of Ubiquitin and Akt after IP with anti-Akt antibody using lysates from WT cortical neuron cultures treated with DMSO or DHPG (100 μM) for 24 h at DIV14 (n = 4). D, Representative Western blottings of Akt, ERK, and Gapdh and the quantification from WT cortical neuron cultures treated with DMSO, DHPG (100 μM), MG132 (10 μM), and DHPG+MG132 at DIV14 (n = 4). MG132 was applied during the second 12 h of DMSO or DHPG treatments. For the quantification above, Student’s t test (A–C) or a two-way ANOVA with Tukey’s test (D) were used. Data are represented as mean ± SEM with *p < 0.05, **p < 0.01, ns: non-significant.
- Figure 4.
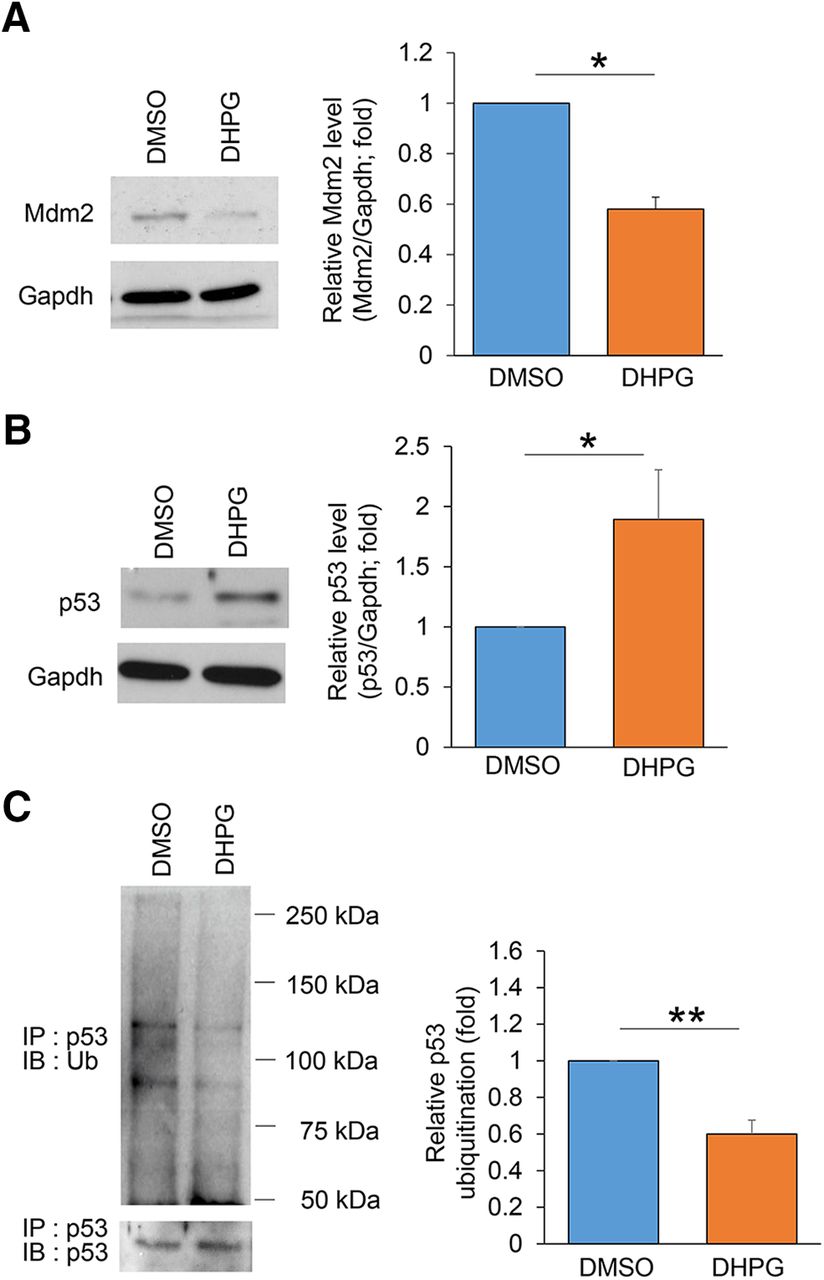
Chronic activation of Gp1 mGluRs reduces Mdm2-p53 signaling. A, Representative Western blottings of Mdm2, and Gapdh from WT cortical neuron cultures treated with DMSO or DHPG (100 μM) for 24 h at DIV14 (n = 4). B, Representative Western blottins of p53, and Gapdh from WT cortical neuron cultures treated with DMSO or DHPG (100 μM) for 24 h at DIV14 (n = 8). C, Representative Western blottings of Ubiquitin and p53 after IP with anti-p53 antibody using lysates from WT cortical neuron cultures treated with DMSO or DHPG (100 μM) for 24 h at DIV14 (n = 3). Student’s t test was used. Data are represented as mean ± SEM with *p < 0.05, **p < 0.01.
- Figure 5.
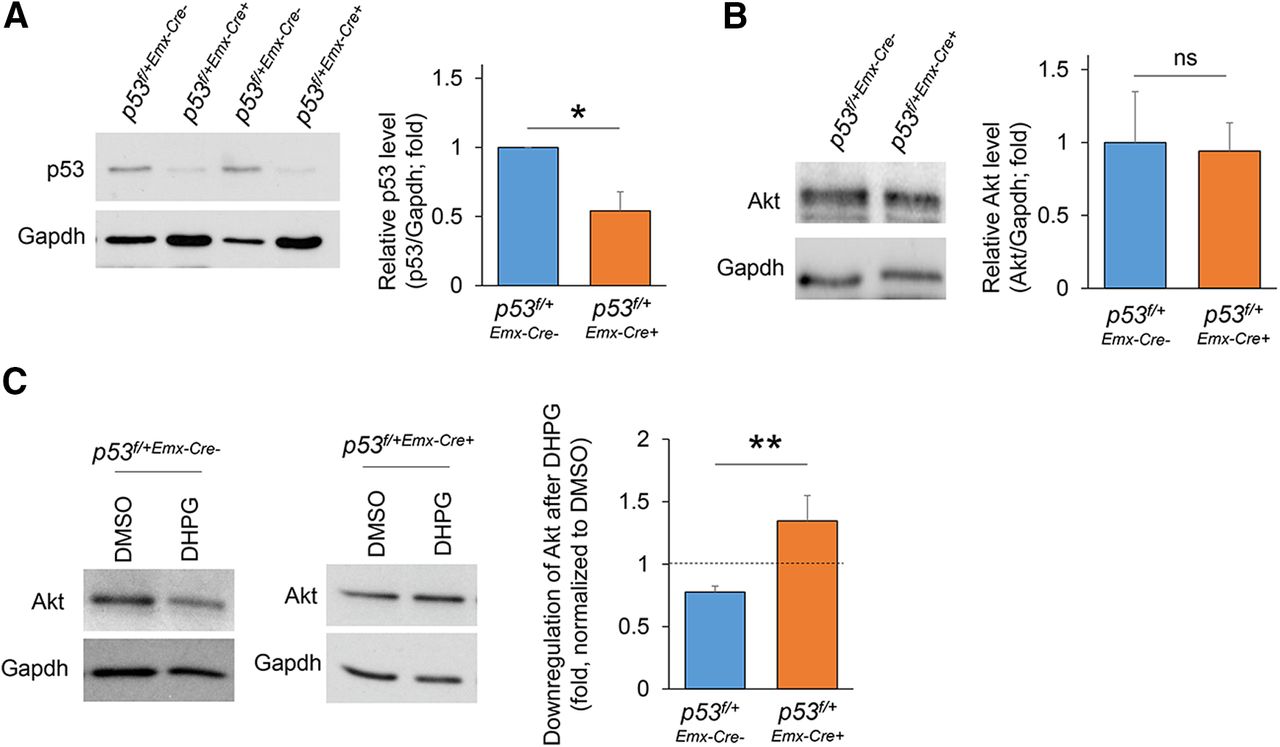
p53 is required for chronic activation of Gp1 mGluRs-induced downregulation of Akt. A, Quantification of p53 expression and representative Western blottings of p53 and Gapdh from p53f/+-Emx1-Cre+ or p53f/+-Emx1-Cre+; cortical neuron cultures at DIV14 (n = 3). B, Quantification of Akt expression and representative Western blottings of p53 and Gapdh from p53f/+-Emx1-Cre+ or p53f/+-Emx1-Cre+ cortical neuron cultures at DIV14 (n = 3). C, Quantification of Akt expression and representative Western blottings of Akt and Gapdh from p53f/+-Emx1-Cre+ or p53f/+-Emx1-Cre+ cortical neuron cultures treated with DMSO or DHPG (100 μM) for 24 h at DIV14 (n = 7 and n = 9 for p53 p53f/+-Emx1-Cre+ or p53f/+-Emx1-Cre+ cultures, respectively). Student’s t test was used. Data are represented as mean ± SEM with *p < 0.05, **p < 0.01, ns: non-significant.
- Figure 6.
Chronic activation of Gp1 mGluRs elicits effects on neural network activity in p53f/+-Emx1-Cre- cortical neuron cultures similar to those in WT (C57BL/6J) cortical neuron cultures. A, B, Quantification of relative spontaneous spike frequency (A, left), synchrony (A, right), burst duration (B, left) and relative number of spikes per burst (B, right) from p53f/+-Emx1-Cre- cortical neuron cultures treated with vehicle (DMSO) or DHPG (100 μM) for 24 h at DIV14. The analysis was done by comparing “after treatment” to “before treatment” of the same cultures during the 15-min recordings. Student’s t test was used. Data are represented as mean ± SEM with *p < 0.05, ns: non-significant.
- Figure 7.
Pharmacological inhibition of Akt partially restores spontaneous network activity in p53f/+-Emx1-Cre+ cortical neuron cultures. A, Raster plots of spontaneous spikes from representative 1-min recordings of p53f/+-Emx1-Cre+ cortical neuron cultures treated with DMSO, DHPG (100 μM), DMSO+MK-2206 (1 μM), or DHPG+MK-2206 at DIV14. Quantification of relative spontaneous spike frequency and synchrony index by comparing “after treatment” to “before treatment” of the same cultures during the 15-min recordings (n = 5–7 independent cultures). B, Representative average traces of spike amplitude from 1-min recordings of WT cortical neuron cultures treated with DMSO, DHPG (100 μM), DMSO+MK-2206 (1 μM), or DHPG+MK-2206 at DIV14. In the traces, the black lines represent the average of all the spikes within representative 1-min recordings. Traces are from the same designated electrodes before and after treatments (n = 5–7 independent cultures). Quantification of spike amplitude is done by comparing “after treatment” to “before treatment” during the 15-min recordings from the same cultures. For both A, B, MK-2206 was applied during the last 1 h of 24-h DHPG or DMSO treatments. A two-way ANOVA with Tukey’s test was used. Data are represented as mean ± SEM with *p < 0.05, ns: non-significant.
- Figure 8.
Aberrant burst activity in p53f/+-Emx1-Cre+ cortical neuron cultures is normalized by pharmacological inhibition of Akt. Representative traces of burst activity from p53f/+-Emx1-Cre+ cortical neuron cultures treated with DMSO, DHPG (100 μM), DMSO+MK-2206 (1 μM), or DHPG+MK-2206 at DIV14. MK-2206 was applied during the last 1 h of 24-h DHPG or DMSO treatments. Traces are from the same designated electrode “before” and “after” drug treatments. Quantification of burst duration and relative number of spikes per burst by comparing “after treatment” to “before treatment” during the 15-min recordings from the same cultures was on the right (n = 6 independent cultures). A two-way ANOVA with Tukey’s test was used. Data are represented as mean ± SEM with *p < 0.05, ns: non-significant.
- Figure 9.
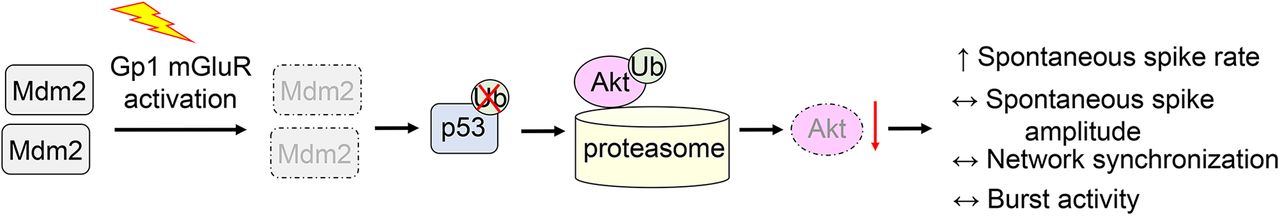
A working model for Mdm2, p53, and Akt in chronic activation of Gp1 mGluRs-induced refinement of neural network activity. Chronic activation of Gp1 mGluR leads to reduction of Mdm2, elevation of p53 and proteasomal degradation of Akt. Subsequently, neural network activity is adjusted, including elevation of spontaneous spike frequency and maintenance of spontaneous spike amplitude, network synchronization, and burst activity at the baseline.


Extended Data
Extended Data Figure 1-1
Time course of DHPG activity in cultures. Representative Western blottings of ERK, p-ERK, and Gapdh, and their quantification from WT cortical neuron cultures treated with conditional medium collected from cultures that were administered with DHPG for 0, 6, 12, or 24 h (n = 4). Download Figure 1-1, TIF file
Extended Data Figure 3-1
DHPG treatment for 24 h triggers p53-dependent reduction of Akt kinase activity. Quantification of Akt kinase activity from DMSO- or DHPG-treated p53f/+−Emx1-Cre− or p53f/+−Emx1-Cre+ cortical neuron cultures (n = 6). A two-way ANOVA with Tukey’s test was used. Data are represented as mean ± SEM with *p < 0.05, ns: non-significant. Download Figure 3-1, TIF file.
Extended Data Figure 5-1
DHPG treatment for 24 h elevates p53 in p53f/+−Emx1-Cre+ cultures. Representative Western blottings of p53 and Gapdh from p53f/+−Emx1-Cre+ cortical neuron cultures treated with DMSO or DHPG (100 μM) for 24 h at DIV14 (n = 4). Student’s t test was used. Data are represented as mean ± SEM with *p < 0.05. Download Figure 5-1, TIF file.
Extended Data Figure 7-1
DHPG treatment for 24 h does not affect cell viability. Quantification of cell viability from DMSO- or DHPG-treated p53f/+−Emx1-Cre− or p53f/+−Emx1-Cre+ cortical neuron cultures (n = 5). A two-way ANOVA with Tukey’s test was used. Data are represented as mean ± SEM with ns: non-significant. Download Figure 7-1, TIF file.
Extended Data Figure 7-2
Inhibition of Akt does not affect basal neural network activity in control, p53f/+−Emx1-Cre−, cultures. A, B, Quantification of relative spontaneous spike frequency (A, left), synchrony (A, right), burst duration (B, left) and relative number of spikes per burst (B, right) from p53f/+−Emx1-Cre− cortical neuron cultures treated with DMSO, DHPG (100 μM), DMSO+MK-2206 (1 μM), or DHPG+MK-2206 at DIV14. The analysis was done by comparing “after treatment” to “before treatment” of the same cultures during the 15-min recordings (n = 5–7 independent cultures). A two-way ANOVA with Tukey’s test was used. Data are represented as mean ± SEM with *p < 0.05 and ns: non-significant. Download Figure 7-2, TIF file.
In this issue


