

Abstract
Neuroplasticity forms the basis for neuronal circuit complexity and differences between otherwise similar circuits. We show that the microphthalmia-associated transcription factor (Mitf) plays a central role in intrinsic plasticity of olfactory bulb (OB) projection neurons. Mitral and tufted (M/T) neurons from Mitf mutant mice are hyperexcitable, have a reduced A-type potassium current (IA) and exhibit reduced expression of Kcnd3, which encodes a potassium voltage-gated channel subunit (Kv4.3) important for generating the IA. Furthermore, expression of the Mitf and Kcnd3 genes is activity dependent in OB projection neurons and the MITF protein activates expression from Kcnd3 regulatory elements. Moreover, Mitf mutant mice have changes in olfactory habituation and have increased habituation for an odorant following long-term exposure, indicating that regulation of Kcnd3 is pivotal for long-term olfactory adaptation. Our findings show that Mitf acts as a direct regulator of intrinsic homeostatic feedback and links neuronal activity, transcriptional changes and neuronal function.
Significance Statement
These findings broaden the general understanding of transcriptional regulation of intrinsic plasticity in learning and memory. Regulation of intrinsic plasticity has wide-ranging implications and fundamental importance for neurologic diseases.
Introduction
Neuronal plasticity is comprised of activity-dependent changes that alter synaptic or intrinsic excitability of neurons (Sweatt, 2016), thus affecting the neuronal response, the gain control relationship between input and output. Ultimately it connects neuronal activity with changes in neuronal behavior (Sweatt, 2016; Yap and Greenberg, 2018). It can also be homeostatic, i.e., neurons with increased activity becoming less sensitive and neurons with lowered activity more sensitive (Lemasson et al., 1993; Davis, 2006; Turrigiano, 2008, 2011). Synaptic plasticity and intrinsic plasticity are thought to work at different time-scales and to interact and complement each other (Kourrich et al., 2015; Lisman et al., 2018). Although synaptic plasticity is fairly well characterized, much less is known about the molecular mechanisms underlying intrinsic plasticity and its transcriptional regulation (Guzman-Karlsson et al., 2014; Hrvatin et al., 2018).
The olfactory system is an attractive system to study plasticity due to its clear flow of information, well-defined neuronal subtypes, ease of activation with odorants and well-defined neuronal circuits. The olfactory bulb (OB) is the first relay of peripheral olfactory information within the CNS. Each OB in the mouse contains around 2000 glomeruli, spherical neuropil structures connecting peripheral olfactory sensory input and cortical structures. In the OB, two types of projection neurons are designated to each glomerulus. They are activated by olfactory sensory neurons (OSNs) and target other CNS regions. These are the mitral cells (MCs; Kikuta et al., 2013; Tan et al., 2010) located in the MC layer (MCL) and the tufted cells located in the external plexiform layer (EPL). These neurons show remarkable capacity in normalizing sensory input, by amplifying low signals and reducing high signals (Roland et al., 2016). Odor exposure also reduces the sensitivity of mitral and tufted cells (M/T; Chaudhury et al., 2010; Kato et al., 2012). In addition, it has been shown that there is high inter-glomerular functional diversity (Angelo et al., 2012), showing that each glomerulus is, to a large degree, regulated independently by its activity. The OB therefore shows clear changes in gain-control and homeostasic plasticity and it has been suggested that intrinsic changes are fundamental to OB sensory adaptation (Tyler et al., 2007).
The transcription factor microphthalmia-associated transcription factor (MITF), best known as a master regulator of melanocytes (Tachibana et al., 1996), is specifically expressed in the M/T neurons of the OB (Ohba et al., 2015). As the M/T neurons are the key output neurons in the OB circuitry, Mitf might play a role in olfaction (Ohba et al., 2015). Mitf is also expressed in a subset of tufted cells, the external tufted cells (ETCs), which are excitatory and synapse with MC, but do not project out of the OB (Hayar et al., 2004b; De Saint Jan et al., 2009; Whitesell et al., 2013). Here, we show that Mitf links neuronal activity and intrinsic activity-dependent changes in the OB by regulating the expression of the potassium channel subunit Kcnd3, leading to a homeostatic response in OB’s projection neurons. Therefore, we suggest that Mitf plays a key role in olfactory adaptation and intrinsic homeostatic plasticity.
Materials and Methods
Animals
All animal procedures were approved by the Committee on Experimental Animals, according to regulation 460/2017 and European Union Directive 2010/63 (license number 2013-03-01). The mice used in the study (C57BL/6J and C57BL/6J-Mitfmi-vga9/mi-vga9) were maintained at the mouse facility at the University of Iceland. Unless otherwise specified, mice were housed two to five per per cage in a temperature-controlled environment (21–22°C). Unless otherwise specified, mice consumed water and food ad libitum. Mice of postnatal day P75–P95 of both genders were used for all experiments.
Electrophysiology
Primary OB neuronal cultures from P0 to P2 mice were obtained as described by (Hilgenberg and Smith, 2007) with slight modifications. Briefly, mice were decapitated and the head submerged in ethanol and then transferred to the head was placed in Ca2+ and Mg2+-free HBSS (Invitrogen) containing 1% penicillin/streptomycin (Invitrogen) and 1% amphotericin B (Invitrogen) under a dissecting microscope. OBs were dissected from the heads, the meninges removed and the OBs then trypsinized for 7–10 min at 37°C. The cells were washed with 0.05% trypsin-EDTA before incubation in the trypsin solution. The neurons were then gently resuspended in Neurobasal-A Medium (Invitrogen) supplemented with 1% GlutaMAX (Invitrogen), 1% penicillin/streptomycin, 1% amphotericin B, 2% 50× serum-free B27 Supplement (Invitrogen) and 10% fetal bovine serum (FBS). The cells were diluted to a density of 1 × 10⁶ cells ml−1 and plated at 1.25 × 10⁵ cells cm2 on 0.1 mg/ml poly-D-lysine hydrobromide (Sigma-Aldrich) and 0.075 mg ml−1 PureCol Purfied bovine Collagen Solution, type 1 (Advanced BioMatrix) precoated coverslips in Nunclon δ Surface 24-well plates (Thermo Scientific). Neurons were cultured in Neurobasal-A Medium supplemented with 1% GlutaMAX 1% penicillin/streptomycin, 1% Invitrogen amphotericin B, and 2% 50× serum-free B27 Supplement for 2 d, on which they were placed in GlutaMAX-free Medium, which was replenished every 3 d.
The cultured cells were maintained in a solution with NBM-B27, 1% GlutaMAX until the second day in vitro (DIV2) and subsequently in NBM-B27 without GlutaMAX. The medium was replaced every 2–3 d. The mean age of cultures at the time of analysis was 12 ± 3 d. The osmolarity of the solutions was measured with an osmometer and the pipette solution was 319 mOsm, while the extracellular Krebs solution was adjusted to 312 mOsm. Isolated cells on coverslips were placed in a recording chamber, and kept at room temperature. The cells were continuously superfused during recordings with an oxygenated extracellular solution. The extracellular mammalian Krebs solution contained the following: 150 mM NaCl, 5 mM KCl, 2.6 mM CaCl2, 2 mM MgCl2, 10 mM HEPES, and 5 mM glucose, at pH 7.3. The solution was filtered with a 0.2-μm filter before use. Pipettes were pulled out of 1.5-mm O.D. borosilicate glass capillary tubings (Science Products GmbH) with a two-stage Narishige PP83 horizontal puller (Narishige Co), and then fire-polished to ∼1 μm tip diameter in a Narishige MF-83 microforge. Pipette resistances were 2–6 MΩ when placed in the Krebs solution while filled with the internal solution. The internal solution contained the following: 145 mM KCl, 2 mM MgCl2, 10 mM EGTA, 10 mM HEPES, and 0.2 mM NaATP, pH 7.3. The reference Ag/AgCl electrode was placed in a compartment separated from the recording chamber, and electrically linked to the superfused compartment containing the cells with a glass tube bridge filled with 2 M KCl/Agar solution. Recordings were made using the whole-cell configuration of the patch-clamp technique (Hamill et al., 1981) on M/T cells with large nuclei, with an Axopatch 1D patch clamp amplifier (Molecular Devices Inc) in voltage or current clamp mode. The mean membrane resistance of wild-type M/T neurons was 104 ± 20.3 MΩ, and 98 ± 17 MΩ (t(25) = 0.234, p = 0.82, two-tailed test) in Mitf mutant neurons. The mean series resistance of wild-type M/T neurons was 13 ± 2.3 MΩ, and 17 ± 1.6 MΩ (t(25) = −1.415, p = 0.17, two-tailed test) in Mitf mutant neurons. The mean cell capacitance of wild-type neurons was 46 ± 7.3 pF and that of Mitf mutant neurons was 56 ± 11 pF (t(25) = −0.7308, p = 0.47, two-tailed t test). The mean resting membrane potentials of wild-type M/T neurons were −58 ± 2 mV and of Mitf mutant neurons –57 ± 2 mV, which is not signficantly different (t(11) = −0.102, p = 0.92, two-tailed t test). The measured values of all these biophysical parameters of the cultured cells are comparable to previously published values measured from cultured mouse OB M/T cells (Desmaisons et al., 1999; Fadool et al., 2004). The output of the amplifier was low-pass filtered at 2 kHz and digitized at 10 kHz with a Digidata 1440A (Molecular Devices) 16-bit A/D-D/A converter. Acquisition of recordings and generation of voltage or current pulses were performed with the pClamp 10.0 software (Molecular Devices) in conjunction with the Axopatch 1D amplifier. No corrections were made for liquid junction potentials or leak currents. After a break-in under voltage clamp, the cell was clamped at a holding potential of −70 mV, and then a 5-mV hyperpolarizing voltage step of 50 ms in duration was applied to evoke capacitance transients in the whole-cell current, to estimate the series resistance (Rs), input resistance (Ri), membrane resistance (Rm), and capacitance (Cm) of the cell. Subsequently, the cultured cells were then first voltage clamped at a holding potential of –70 mV, and then stepped to –90 mV for 80 ms. Whole-cell outward currents were then evoked by a protocol using successive depolarizing voltage pulses from –90 mV, 300 ms in duration at +5-mV steps. To separate the A-type current from other outward currents another protocol with a series of voltage pulses 300 ms in duration was then applied to the cell, except that before the depolarizing pulses were delivered, the cell was held at –40 mV for 80 ms, after having been kept hyperpolarized for 55 ms at –90 mV. In order to isolate the A-type current from the total outward current, the current traces evoked by the second protocol, which primarily involves delayed rectifier K+ currents, were subtracted from the corresponding traces evoked by the first protocol. The resting membrane potential was recorded immediately after break in and turning to whole-cell current clamp mode with current at zero. Spontaneous membrane potential fluctuations and spiking activity of projection neurons were measured in whole-cell current clamp mode, while holding the cell near the resting potential (−65 ± 5 mV). A depolarizing shift in membrane potential larger than 25 mV was defined in the analysis software as a spike, while a shift of 5 mV but <25 mV was defined as a spontaneous EPSP. The time period for analysis of spontaneous spike frequency in each cell was set as 50 s.
Immunofluorescence
Mice were transcardially perfused (experimental license number 2014-07-02) with 1× PBS (Dulbecco) followed by 4% paraformaldehyde (PFA; Sigma-Aldrich) in 1× PBS. Following dissection, the brain was postfixed for 2 h in 4% PFA at room temperature. The OBs were sectioned at −20°C, in 20-μm thin sections and kept at 4°C until used for immunofluorescence. Sections were placed in a blocking buffer of 0.1% Triton X-114 (Sigma-Aldrich) and 5% normal goat serum (NGS; Invitrogen) in PBS for 1 h at room temperature. Blocking was followed by incubation with primary antibody (diluted 1:500) in blocking buffer overnight at 4°C. The antibodies used were TBR2/Eomes (Abcam, Ab23345, RRID: AB_778267) and tyrosine hydroxylase (TH; Millipore, MAB318, RRID: AB_2313764). Sections were subsequently incubated for 1 h at room temperature in blocking buffer containing the Alexa Fluor goat anti-mouse 488 or Alexa Fluor goat anti-rabbit 546 (Life Technologies) secondary antibodies (each at 1:1000 dilution) and DAPI (1:1000; Sigma-Aldrich). The sections were then washed and subsequently kept at 4°C until imaging at 20× magnification using an Olympus FV10-MCPSU confocal microscope; two to five images were obtained from the medial OB of each sample. Cells were counted manually. Quantification of the samples was performed under blind condition. The average of cells per sample was calculated and plotted using GraphPad Prism 7.
TUNEL staining
Fixed frozen sections were obtained as described above. For TUNEL staining of the fixed frozen sections, In Situ Cell Death Detection kit, Fluorescein version 17 (Roche) was used. Images were obtained at 20× magnification using Z-stack 3D images. From each sample, two to three images were obtained from the medial OB. Using the Fiji software, images were stacked and positively stained cells were counted manually. The average number of positive cells per image was calculated using GraphPad Prism 7.
Histologic analysis
Mice were sacrificed by cervical dislocation and the brain was postfixed for 24 h in 4% formaldehyde (Sigma-Aldrich). Following fixation, the OB was embedded in paraffin and sectioned in 4-μm thin sections. The sections were stained for hematoxylin and eosin (H&E).
Plasmids
The MITF-M cDNA was cloned into the p3xFlag-CMV14 vector using EcoRI and BamHI restriction sites. The four arginines in the basic domain were mutated to alanines by in situ mutagenesis to generate the construct MITF-B4RA (Fock et al., 2019). The human TYR promoter in pGL3 Basic Luciferase Reporter vector was used for co-transfection assays.
MITF binding sites in the intronic region of KCND3 were identified using the ChIPseq data from Laurette et al. (2015; GSM1517751) and Strub et al. (2011; GSE64137). The data were imported into IGV Tools and binding peaks near KCND3 identified. Similarly, ChIPseq data for H3K4me1 (GSM2476344) and H3K27ac modifications in melanoma cells (GSM2476350) was analyzed (Fontanals-Cirera et al., 2017). Two MITF peaks termed A and B were identified. In order to clone the KCND3_B region, a 655-bp fragment was amplified from genomic DNA of the human 501mel melanoma cells using forward primer 5′-TTGTGAGAGTAGCAGAGTGCTTTGC-3′ and reverse primer 5′-GAGCAGATTCAGAGATCAGAAATCAATGG-3′; the primers also contained restriction sites for KpnI and XhoI. In order to clone the KCND3-A region, a 469-bp fragment was amplified from genomic DNA of 501mel melanoma cells using forward primer 5′-GCTTCTGGAAGGTGAGAGAAGGA-3′ and reverse primer 5′-AGTGTCCTGATAGCCACATTAGGTC-3′; the primers also contained restriction sites for NheI and XhoI. Both fragments were subsequently cloned into the pGL3 Promoter reporter vector.
Cell culture
HEK293T and N2A neuronal cells were obtained from the Leibniz Institute DSMZ-Deutsche Sammlung von Mikroorganism und Zellkulturen GmbH. HEK293T cells were cultured in DMEM-Glutamax media (Invitrogen) supplemented with 10% FBS (Invitrogen), N2A cells were cultured in DMEM-Glutamax media supplemented with 10% FBS and 1% Non-Essential Amino Acids (Invitrogen). Cells were cultured in 75-cm2 Nunc EasYflask with Nunclon δ surface (Thermo Scientific) in a HERAcell 240i incubator (Thermo Scientific) at 37°C and 5% CO2. HEK293Ts were passaged when 90% confluency was reached by gently trypsinizing the cells, resuspending them in media and diluting the cells 1:10 and replating them. N2A cells were passaged when 70% confluency was reached by gently trypsinizing the cells, resuspending them in media and diluting the cells 1:5 and replating them.
Co-transfection assay
N2A and HEK293T cells were plated in Falcon 96-well cell culture plates at 13,800 and 20,000 cells per well, respectively. After 24 h, the N2A and HEK293T cells were transfected with 0.1 μg of DNA mixed with FuGENE at 7:1 and 2.8:1 FuGENE HD to DNA ratios, respectively. This mixture contained equal amounts of the luciferase reporter plasmid, Renilla reporter plasmid and MITF-FlagpCMV, MITF-B4RAFlagpCMV, or FlagpCMV. Each combination was plated and transfected in triplicate. Cells were harvested after 24 h of incubation using Dual-Glo Luciferase Assay System (Promega Corporation) as described and the luciferase and Renilla luminescence measured separately using a MODULUS II TURNER instrument (Biosystems). To quantify the normalized luminescence, the luciferase values were divided by the Renilla luminescence values recorded for each well. Subsequently an average was obtained for the triplicate. These values were then plotted using GraphPad Prism 7.
Odor exposure
Mice were placed in empty cages, devoid of bedding, food, and water for 1 h in an odor free room. After 1 h, mice were moved to a different room where an open Eppendorf tube containing 60 μl of amyl acetate (Sigma-Aldrich) was taped inside their cage at nose-level. After 30 min, the mice were placed in a new cage without amyl acetate and moved back to the odor free room. The mice were sacrificed by cervical dislocation at different intervals: before amyl acetate exposure, immediately after exposure and 30, 90, and 210 min after exposure to amyl acetate. The OBs were either flash frozen in liquid nitrogen for quantitative real time PCR or placed in OCT medium (Sakura) in a 15 × 15 × 15-mm Tissue-Tek Cryomold (Sakura) and subsequently flash frozen for sectioning and RNA in situ hybridization.
RNA multiplex fluorescent RNA in situ hybridization (mFISH)
Mice were sacrificed by cervical dislocation. The OB was dissected out and placed in OCT compound in a 15 × 15 × 15 mm Tissue-Tek Cryomold and flash frozen with liquid nitrogen. The caudal OB was sequentially sectioned unto slides, with two sections per slide, at a thickness of 20 μm. The slides were stored in a −80°C freezer in an airtight bag until use. The samples were pretreated using the protocol RNAscope Sample Preparation and Pretreatment Guide for Fresh Frozen Tissue (Manual RNAScope assay; Advanced Cell Diagnostics). mFISH was subsequently performed according to the manufacturer’s instruction for the RNAscope Fluorescent Multiplex kit (Advanced Cell Diagnostics) with probes 422501 (Mitf), 429641-C2 (Tbr2/Eomes), 452598-C3 (Kcnd3), and 316921-C2 (c-Fos). Sections were kept at 4°C until imaging using Z-stack 3D images with the Olympus FluoView FV10 confocal microscope at 30× magnification. Two images were obtained from the medial OB per sample, one image of the glomerular region of the OB and a separate image of the mitral and granule cell (GC) layer (GCL). Using the Fiji software, fluorescent dots per cell were counted, by encircling the cloud of Tbr2 dots and using this area to count the fluorescent dots of interest. Tbr2+ cells located directly below the glomeruli were considered ETCs. Similarly, Tbr2+ cells located in the MCL, and not in the EPL, were considered as MCs. In the cases where Tbr2 coexpression was not determined, Mitf expression, localization, and nuclear morphology were used to determine cell type. Average dots per cell was calculated for each sample and plotted using GraphPad Prism 7.
Quantitative PCR
Mice were sacrificed by cervical dislocation and OBs flash frozen in liquid nitrogen. The samples were kept at −80°C until RNA was isolated using NucleoSpin RNA (Machery Nagel). In order to generate cDNA, the SuperScript II Reverse Transcriptase kit (Invitrogen) was used, using 1 μg of RNA and oligo(T) primers. Mouse specific exon-spanning primers were designed using Primer-blast. The primers-pairs used were the following: Gapdh forward 5′-ATGACATCAAGAAGGTGGTG-3′, reverse 5′-CATACCAGGAAATGAGCTTG-3′; Actin forward 5′-CACTGTCGAGTCGCGTCC-3′, reverse 5′-TCATCCATGGCGAACTGGTG-3′; Mitf forward 5′-AGCAAGAGCATTGGCTAAAGA-3′, reverse 5′-GCATGTCTGGATCATTTGACT-3′; and c-Fos forward 5′-TTTCAACGCCGACTACGAGG-3′, reverse 5′-TCTGCGCAAAAGTCCTGTGT-3′. Quantitative qPCR was performed using Power SYBR Green PCR Master Mix (ThermoFisher Scientific). The 2-ΔΔCt method was used to normalize expression to C57BL/6J, relative to Gapdh and Actin as described previously (Livak and Schmittgen, 2001).
Behavior
Before performing any behavior experiments, individual mice were placed in separate cages for at least 24 h. Mice were used for a maximum of two behavioral experiments but only once for the same behavioral test. Each mouse was only used once for each habituation/dishabituation experiment. All behavior experiments were performed at 9 P.M., 1 h after the lights were turned off. All behavior was filmed, and the behavior of interest measured as a function of time and plotted using GraphPad Prism 7.
Hidden food assay
The food pellets were replaced by sweetened cereal, Cocoa Puffs (Nesquik General Mills) for 12 h. After 12 h, all Cocoa Puffs pellets were removed from the food section of the cage and one Cocoa Puffs pellet was placed into the cage. Following overnight starvation (license number 2016-05-01), a cage was filled with 4 cm of bedding and a Cocoa Puffs pellet was hidden in one corner, under the bedding. The mouse was placed in the posterior section of the cage, opposite to the pellet, and the time it took the mouse to find the pellet was determined. Mice which showed obvious distress (tremors, unsteady gait, or unwillingness to explore) and could not find the pellet in under 180 s were removed from the experiment.
Avoidance assay
A 41.5 × 24 × 18.5 cm cage was sectioned into three equal sections numbered 1–3 and the bottom covered with 0.5 cm of bedding. Before the experiment, 30 μl of water were placed onto a 5 × 5 cm piece of Whatman paper which was then taped onto section 1, at nose height. The mouse was gently placed in section 3 and allowed to roam for 120 s in the cage. After 120 s, the mouse was removed from the cage and the 5 × 5 cm Whatman paper containing 30 μl of water was replaced with a 5 × 5 cm paper of Whatman paper containing 30 μl of propionic acid (Sigma-Aldrich). The mouse was gently placed in section 3 and allowed to roam for 120 s in the cage. After 120 s, the mouse was removed from the cage. The time the mouse spent in each of the three sections, using the nose as the reference point, was measured for both conditions.
Habituation-dishabituation
In order to perform the habituation-dishabituation experiment, we used the protocol of Lehmkuhl and associates (Lehmkuhl et al., 2014). Mice were kept in individual cages for 24 h. Food and water were subsequently removed, and the mice were kept in an odor free room for 1 h before the experiment. The mice were habituated for 30 s every 5 min by placing 5 μl of a particular odor in the cage, a total of six times, and subsequently exposed to 5 μl of another odor for 30 s. Time spent sniffing the object, or in the direction of the object was determined. Odorants used were almond, lime (brand name Dr. Oetker) and vanilla extracts (brand name Katla). For long-term exposure to odor, the mice were exposed to vanilla odorant for 2 h before habituation-dishabituation with almond-vanilla odor pairs.
Statistical analysis
No statistical methods were used to predetermine sample size. Grouped analyses were used for the in vivo experiments as at least three mice per genotype were used. Quantitative results were analyzed by one-way or two-way ANOVAs, and two-sided unpaired or paired Student’s t tests and χ2 tests using GraphPad Prism 7. To obtain p values, multiple comparisons for ANOVA tests were performed with Livak’s correction or Dunnett’s correction in cases where there was a comparison to a control time point. All numerical results are presented as mean and SEM unless stated otherwise. Degrees of freedom are indicated between brackets.
Results
Mitf mutant mice have increased numbers of excitatory neurons
In order to characterize Mitf expression in the OB, we used mFISH which generates a single fluorescent dot per transcript detected (Wang et al., 2012), allowing for single-cell analysis of gene expression. Consistent with previous observations (Ohba et al., 2015), this showed that in wild-type mice Mitf is expressed in M/T neurons, including in ETCs located in the EPL (Fig. 1A,B) and at low levels in the GCL (Fig. 1A, arrowheads). Interestingly, there is significantly more Mitf expressed in the ETCs compared with MCs (F(1,15) = 8.94, p = 0.0092, two-way ANOVA). Mice homozygous for the Mitfmi-vga9 mutation are white and microphthalmic due to a transgene insertion mutation that affects expression of Mitf (Hodgkinson et al., 1993). As expected, Mitf expression was decreased in the ETCs (t(14) = 7.923, p < 0.0001, Sidak multiple comparison test) and MCs (t(14) = 2.969, p = 0.0202, Sidak multiple comparison) in OBs of Mitf mutant mice (Fig. 1B,C).
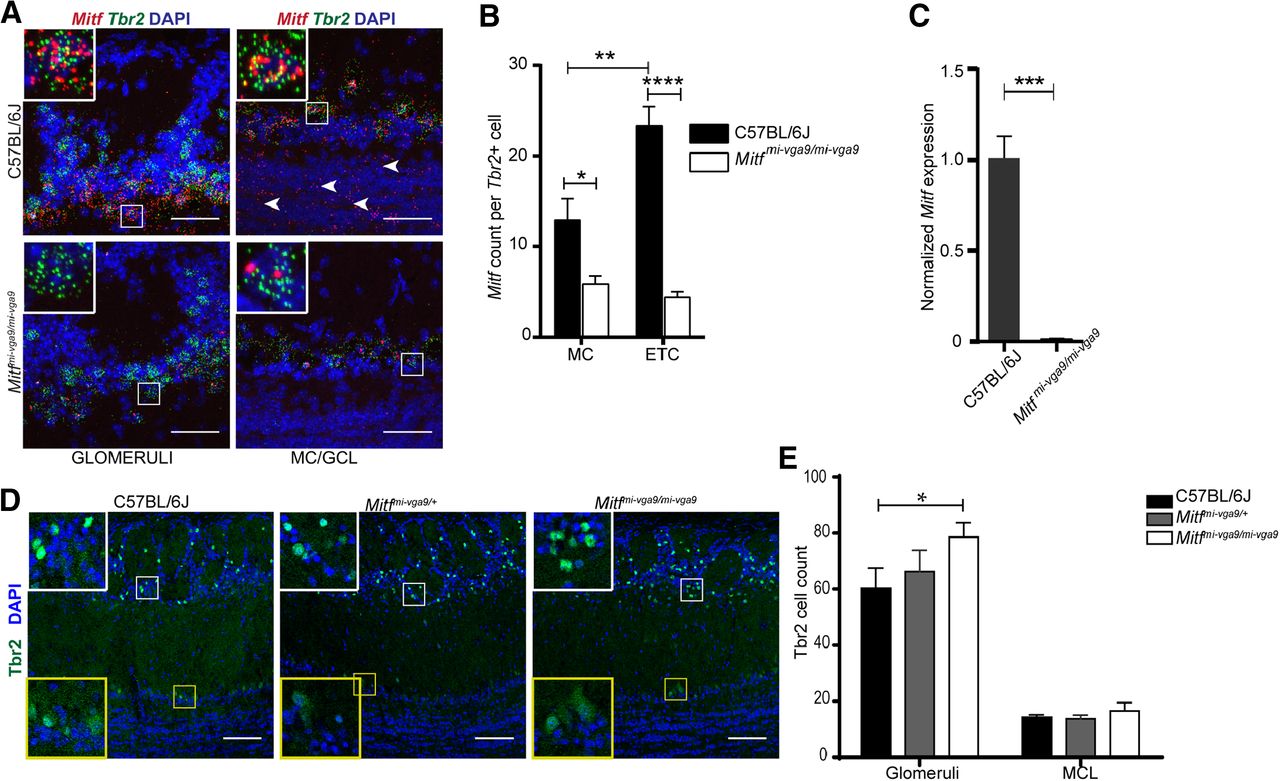
Mitf mutant mice have an increase in Tbr+ neurons in the glomerular layer. A, RNA in situ hybridization of Mitf (red) and Tbr2 (green) in glomeruli and MC/GCL of wild-type and Mitfmi-vga9/mi-vga9 mice. Scale bars: 50 μm. B, Mitf count per Tbr2-positive cells below glomeruli and MCL. N = 9 per genotype. C, Mitf mRNA expression, determined by RT-qPCR. N = 6 per genotype. D, Immunofluorescent staining of Tbr2/Eomes (Tbr2+) neurons (green) in the OBs of wild-type, Mitfmi-vga9/+, and Mitfmi-vga9/mi-vga9 mice. E, Cell count of Tbr2/Eomes (Tbr2+) cells in the glomeruli and MCL of wild-type, Mitfmi-vga9/+, and Mitfmi-vga9/mi-vga9 mice. N = 6 per genotype. The values on the graphs are mean ± SEM DAPI nuclear staining is shown in blue. Scale bars: 100 μm; p values were calculated using two-way ANOVA (B, E) or two-tailed unpaired Student’s t test (C); *p < 0.05, **p < 0.01, ***p < 0.001, ****p < 0.0001.
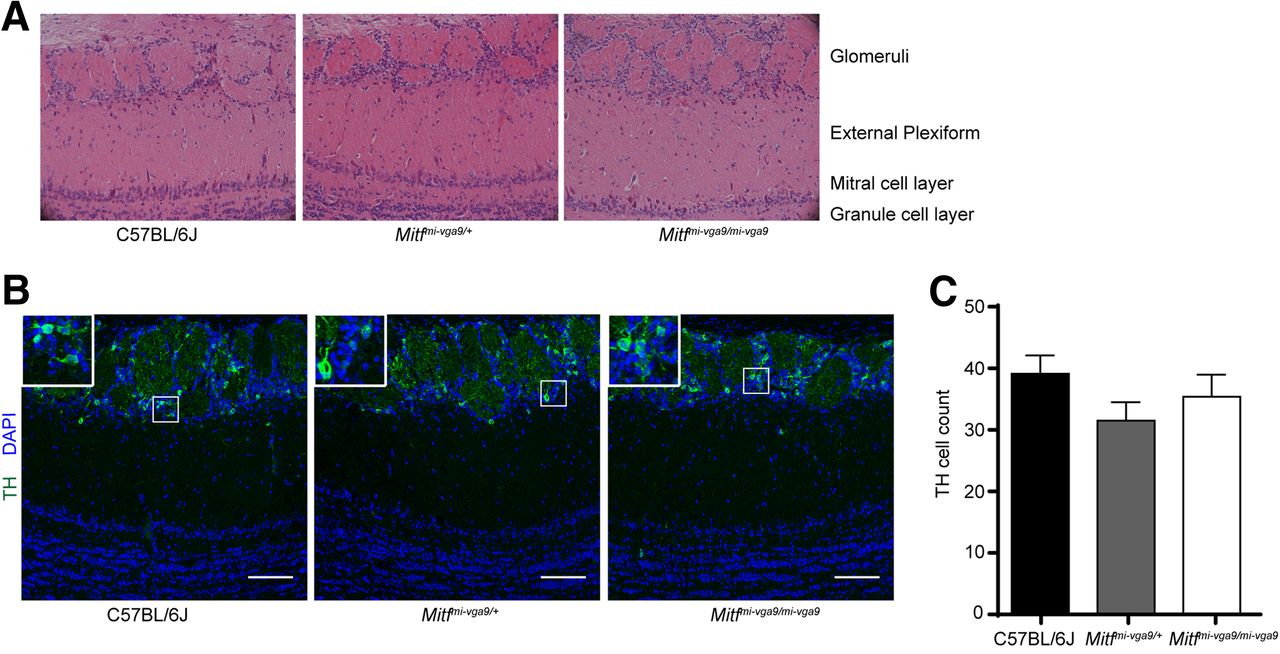
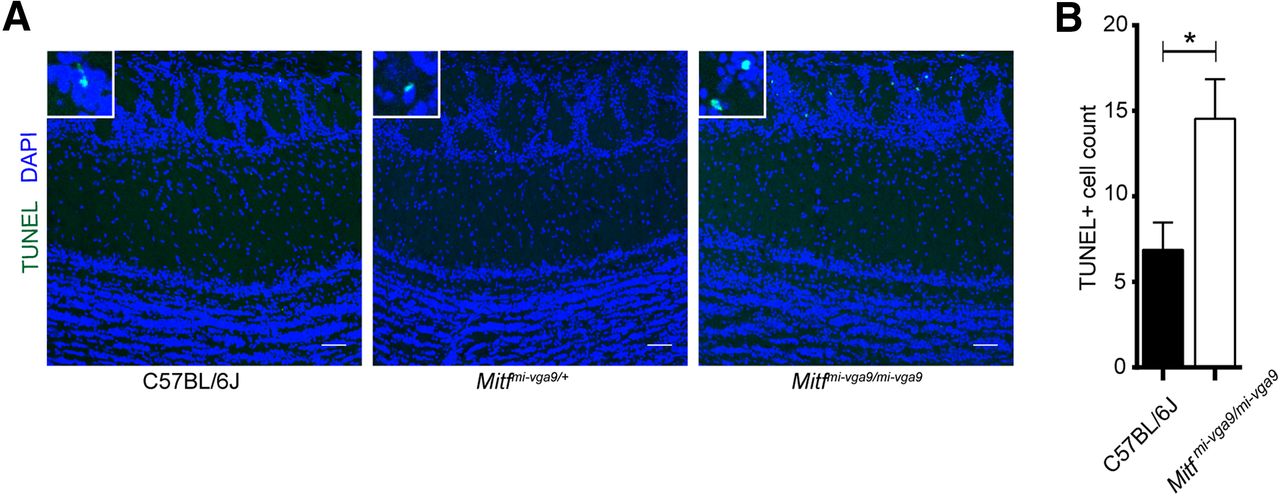
Histologic analysis showed no detectable defects in the cellular architecture of OBs from P75 to P95 Mitf mutant mice (Fig. 2). Expression of TH is reduced upon loss of activity in the OB (Liu et al., 1999) but was not affected in the OBs of Mitf mutant mice (Fig. 2B,C). This also suggests normal OB function. Importantly, Tbr2, a marker for M/T cells (Mizuguchi et al., 2012; Imamura and Greer, 2013), is expressed in Mitf mutant OBs (Fig. 1A) showing normal OB ontogeny. Interestingly, cell counts showed an increase of glomerular Tbr2+ neurons (t(20) = 2.914, p = 0.0171, Sidak multiple comparison) in the glomeruli of Mitf mutant mice (Fig. 1D,E). An increase in M/T neurons has been shown to occur with increased activity (Johnson et al., 2013; Liu et al., 2016). Additionally, analysis of apoptosis showed a twofold increase in cell death in periglomerular cells of Mitf mutant mice (Fig. 3; t(16) = 2.724, p = 0.015, two-tailed t test), suggesting increased glomerular neuronal turnover in the mutant mice.

Mitfmi-vga9/mi-vga9 mice have normal OBs. A, Representative images of the H&E histologic analysis of coronal sections of the medial OBs of the indicated genotypes. B, Immunofluorescent staining of TH showing the localization of TH in the glomeruli of the indicated genotypes. C, Cell count of TH+ cells of the OB of wild-type, Mitfmi-vga9/+, and Mitfmi-vga9/mi-vga9 mice. N = 6 per genotype. The values on the graphs are mean ± SEM DAPI nuclear staining is shown in blue. Scale bar: 100 μm; p values were calculated using one-way ANOVA (C).

Increase in apoptosis in OBs of Mitfmi-vga9/mi-vga9 mice. A, TUNEL staining of sections of OBs of the indicated genotypes, showing localization of apoptotic cells. B, The number of apoptotic cells of OB of wild-type and Mitfmi-vga9/mi-vga9 mice. N = 9 per genotype. The values on the graphs are mean ± SEM DAPI nuclear staining is shown in blue. Scale bars: 50 μm; p values were calculated using two-tailed unpaired Student’s t test; *p < 0.05.
Mitf mutant mice have reduced IA and a concomitant increase in MC activity
To examine whether the loss of Mitf resulted in altered M/T neuronal function, we performed whole-cell patch clamp analysis on cultured primary M/T neurons from wild-type and Mitf mutant mice, both under voltage clamp and current clamp conditions, bypassing possible secondary effects due to cortical feedback mechanisms or other compensatory mechanisms within the OB. To establish the identity of the cells in culture, several biophysical properties were determined (see methods). The likelihood of an action potential is decided by the balance between sodium influx and potassium efflux. The initial potassium efflux activated near the spiking threshold is termed the A-type potassium current (IA) and is a major determinant of the likelihood of an action potential. Patch clamp recordings under voltage clamp showed a reduction in the IA K+-current in M/T neurons from Mitf mutant mice. (Fig. 4A–D; t(50) = 2.313, p = 0.0491, Sidak multiple comparison). No significant reduction was observed in the IDR current (Fig. 4D). There was no significant correlation between the membrane resistance of the M/T neurons and the maximum recorded IA K+-current or the IDR current from either wild-type or Mitf mutant mice. The I/V relationship denotes the relationship between the IA K+-current density (pA/pF) across the membrane and the membrane potential, and thus takes size of the cells into account based on their measured membrane capacitance. The I/V curves show that the mutant neurons have an altered voltage dependence of activation of the IA currents evoked (Fig. 4E), with multiple comparisons between the means revealing that the current density is significantly reduced at depolarized membrane potentials, at −5 mV and higher (p > 0.05). However, the channel kinetics, i.e., activation and inactivation of the channels mediating the isolated IA, remained the same in cells from wild-type and mutant mice (Fig. 5). Reduction in the IA leads to increased likelihood of action potentials and hyperexcitability (Yuan et al., 2005; Kim et al., 2007; Fransén and Tigerholm, 2010). Accordingly, increased spiking was observed in the mutant neurons (Fig. 4F), under current clamp configuration of the whole-cell patch clamp. The mean firing frequency of spikes in wild-type M/T neurons was 0.79 ± 0.17 Hz, while it was 1.75 ± 0.15 Hz in mutant M/T neurons (t(11) = 1.61, p = 0.007, two-tailed t test). The mean amplitude of action potentials was similar, or 62 ± 4 mV in wild-type M/T neurons and 54 ± 2.6 mV in mutant M/T neurons (t(11) = 1.06, p = 0.31, two-tailed t test). In addition to spikes, spontaneous excitatory postsynaptic potentials (EPSP) could be observed in the current clamp recordings. Additionally, expression of c-Fos, an activity-dependent gene frequently used to monitor neuronal activity, was increased in the Mitf mutant MCs (Fig. 4G,H; t(9) = 3.093, p = 0.0386, Sidak multiple comparison), indicating increased neuronal activity in vivo. A second, unidentified cell population in the GCL also showed clear increase in expression of c-Fos in the mutant (Fig. 4G, arrowheads).
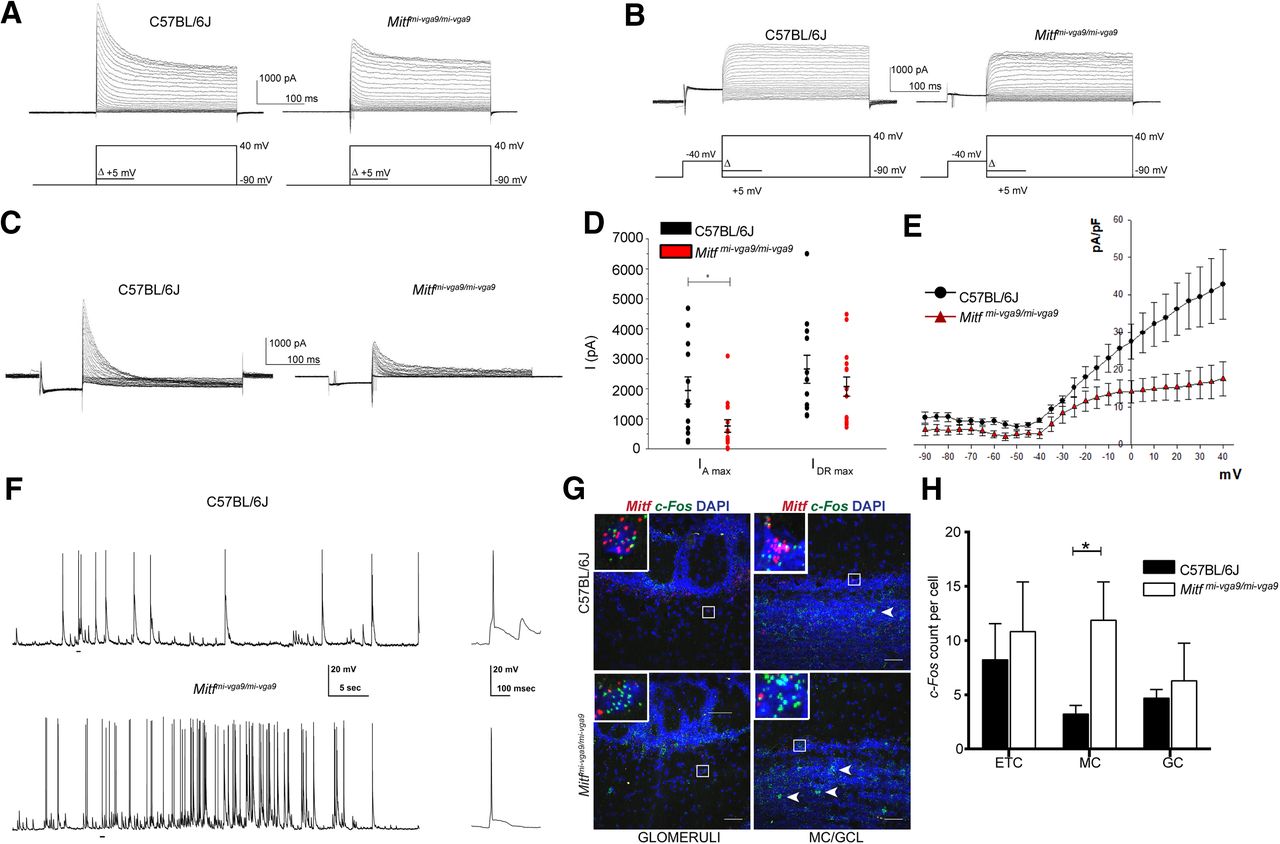
Mitf mutant mice have a decrease in IA and a concomitant increase in MC activity. A, Representative images of voltage clamp recordings. B, Representative images of voltage clamp recordings, where the IA was inactivated by a –40-mV prepulse. C, The isolated IA recorded from wild-type and Mitfmi-vga9/mi-vga9 M/T neurons. D, IA max and IDR max in wild type and Mitfmi-vga9/mi-vga9. N = 12 per genotype. E, The relation between current density (pA/pF) of isolated IA currents and membrane voltage (mV) of wild-type and Mitfmi-vga9/mi-vga9 M/T neurons. N = 12 per genotype. F, Representative recordings of spontaneous action potentials observed in wild-type (N = 5) and Mitfmi-vga9/mi-vga9 M/T neurons (N = 3) by current clamp with examples from both recorded traces enlarged on the right. G, RNA in situ hybridization of c-Fos (green) and Mitf (red) in wild-type and Mitfmi-vga9/mi-vga9 OBs. H, c-Fos dots per cell in the ETC, MC, and GC. N = 4 per genotype. The values on the graphs are mean ± SEM DAPI nuclear staining is shown in blue. Scale bars: 50 μm; p values were calculated using two-tailed unpaired Student’s t test (D), nonlinear regression and one-way ANOVA (F) and two-way ANOVA (H) and *p < 0.05.

Gating kinetics of the A-type current (IA). A, Representative recordings obtained to assess the gating kinetics of the IA current mediating channels. The projection neurons were first voltage clamped at –30 mV and subsequently depolarized to 20 mV using a prehyperpolarizing pulse in between to recover the IA current from inactivation. This was done by increasing the time, Δt, spent in the hyperpolarized state, as indicated by the voltage trace on the left. To gauge its activation kinetics, the neurons were held at –90 mV, as shown in the voltage trace on the right, and subsequently depolarized to 20 mV, with a predepolarization pulse to –30 mV applied in between. The A-type current gets inactivated by increasing the duration of the prepulse, Δt. B, Normalized mean currents (±SEM) plotted separately during recovery of the IA current from inactivation and during deactivation, in cells from wild-type and Mitfmi-vga9/mi-vga9 mice. The functions fitted to the data yield half-activation and half-recovery times of 15.2 ± 4.7 and 42.6 ± 7.2 ms for the wild-type (N = 5, p = 0.53) and 18.2 ± 1.5 and 51.3 ± 9.3 ms for the Mitfmi-vga9/mi-vga9 (N = 6, p = 0.49) M/T.
Expression of Kcnd3 and Mitf is activity dependent in the OB
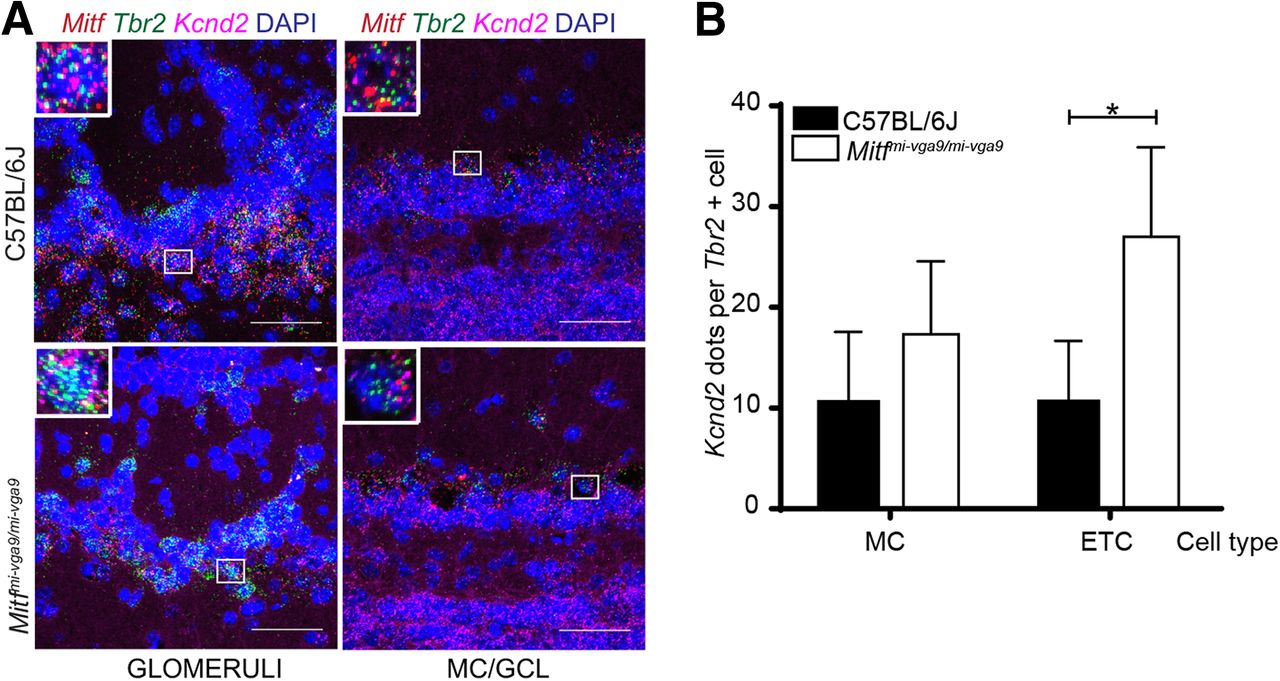
Increased neuronal activity due to the loss of IA led us to examine the expression of key potassium channel subunits in the OB. As displayed in Table 1, many potassium channel subunits (Gutman et al., 2005) are known to be expressed in the OB. We focused our analysis on the IA-current regulating Kv4.3/Kcnd3 potassium channel subunit (Kollo et al., 2008; Wang et al., 2015), as according to ChIPseq data, MITF binds to its regulatory region (Table 1; Strub et al., 2011; Calero-Nieto et al., 2014; Laurette et al., 2015). RNA in situ analysis showed reduced expression of Kcnd3 in ETCs (t(12) = 3.297, p = 0.0190, Sidak multiple comparison) and MCs (t(12) = 3.249, p = 0.0208, Sidak multiple comparison) of Mitf mutant OBs, whereas the levels remained similar in cells of the GCL (Fig. 6A,B). Thus, the effects of Mitf on Kcnd3 expression are cell autonomous, consistent with the possibility of Mitf regulating Kcnd3 in M/T neurons. Although the ChIPseq data does not show MITF to bind to the regulatory region of the gene encoding the IA-regulating potassium channel subunit Kcnd2 (Table 1), its expression was increased in ETC in OB from the Mitf mutant mouse (t(6) = 5.051, p = 0.0047, Sidak multiple comparison), possibly as a compensatory mechanism for the reduction in Kcnd3 (Fig. 7). This increase in the expression of Kcnd2 underlines the tight regulation of neuronal activity. Without this change, the effects on the A-current would likely be larger, especially in the ETC.

Kcnd3 and Mitf expression are activity dependent in the OB. A, RNA in situ hybridization of Tbr2 (green), Mitf (red), and Kcnd3 (magenta) performed on wild-type and Mitfmi-vga9/mi-vga9 OBs. B, Kcnd3 count per cell. N = 5 per genotype. C, Schematic representation of the amyl acetate (AA) experiment where mice were habituated to an odorless cage for 60 min. Upon exposure to AA for 30 min (red block), they were sacrificed at different time points (black vertical lines). D, Mitf and c-Fos mRNA expression in wild-type OB following AA, determined by RT-qPCR. N = 6 per time point. E, c-Fos dots per cell in wild-type OB mice following AA. N = 6 per time point. F, Mitf dots per cell in wild-type OB following AA. N = 6 per time point. G, Kcnd3 dots per cell in wild-type OB following AA. N = 6 per time point. The values on the graphs are mean ± SEM DAPI nuclear staining is shown in blue. Scale bars: 50 μm; p values were calculated using two-way ANOVA (B, D, F, F, I); *p < 0.05, **p < 0.01, ***p < 0.001, ****p < 0.0001. PG = periglomerular.

Kcnd2 expression is increased in the Mitf mutant OB. A, RNA in situ hybridization of Tbr2 (green), Mitf (red), and Kcnd2 (magenta) performed on wild-type and Mitfmi-vga9/mi-vga9 OBs. B, Kcnd3 count per cell. N = 4 per genotype. The values on the graphs are mean ± SEM DAPI nuclear staining is shown in blue. Scale bars: 50 μm; p values were calculated using two-way ANOVA (B); *p < 0.05.
Potassium channel subunits in the OB
Neuronal activity leads to generation of cAMP, activation of the MAPK pathway kinases and the cAMP-responsive element binding protein (CREB) protein. These are established regulators of Mitf transcription and MITF signaling (Shoag et al., 2013). We therefore explored the effects of OSN activity on the expression of Mitf and Kcnd3 in the OB. Amyl acetate is known to activate a multitude of glomeruli (Bepari et al., 2012). Amyl acetate treatment of the wild-type mice (Fig. 6C) resulted in an immediate increase in the global transcription of c-Fos (Figs. 7E, 8; q(40) = 4.875, p < 0.0001, Dunnett’s multiple comparison) as expected. Similarly, RNA in situ hybridization showed significant cell-specific increase of c-Fos in the ETCs (q(57) = 2.687, p = 0.0241, Dunnett’s multiple comparison) and GCs (q(57) = 3.359, p = 0.0036, Dunnett’s multiple comparison) with treatment. An increase was also observed in c-Fos expression in MCs, but this was not significant (q(57) = 2.365, p = 0.0561). Note, however that not all glomeruli are affected by amyl acetate (Bepari et al., 2012). The increase in c-Fos expression was followed by an increase in Mitf expression 30 min after exposure to amyl acetate both in the ETCs (Figs. 6F, 8; q(45) = 3.325, p = 0.005, Dunnett’s multiple comparison) and the MCs (q(45) = 5.031, p = 0.0001, Dunnett’s multiple comparison). Expression of Kcnd3 also increased 30 min after exposure, but only in the MCs (Figs. 6G, 9; q(30) = 3.271, p = 0.0075, Dunnet’s multiple comparison) and not in the ETCs. This showed that expression of both Mitf and Kcnd3 is activity dependent in the MC projection neurons of the OB. The large increase observed for Mitf expression after 90 min (Fig. 7D) suggests that Mitf is also activity dependent in the GCL, but the GCs greatly outnumber M/T neurons.
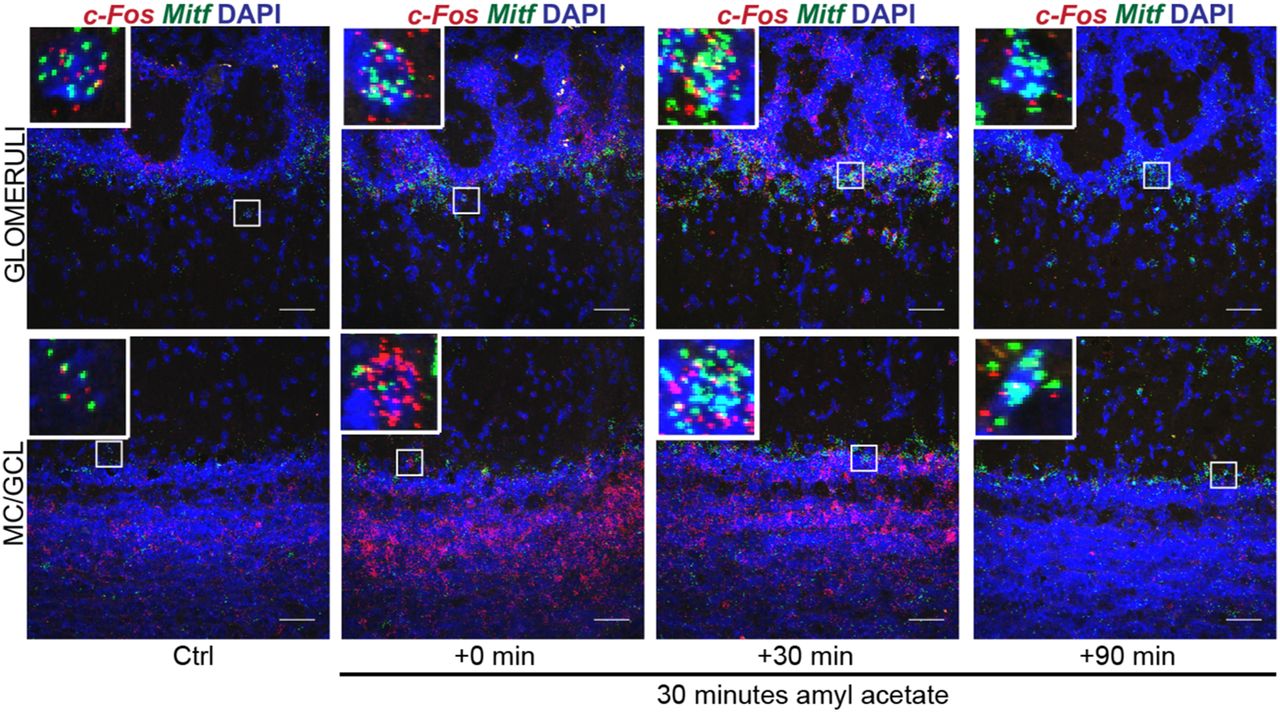
c-Fos and Mitf expression is increased upon activity induction in the OB. RNA in situ hybridization of c-Fos (red) and Mitf (green) performed on wild-type OBs following AA. DAPI nuclear staining is shown in blue. Scale bars: 50 μm.

Kcnd3 expression is increased on activity induction in the OB. RNA in situ hybridization of Mitf (red) and Kcnd3 (green) performed on wild-type OBs following AA. DAPI nuclear staining is shown in blue. Scale bars: 50 μm.
Activity-dependent increase in Kcnd3 expression requires MITF enhancer activity
Induction of large-scale OB activity with amyl acetate was also performed on Mitf mutant mice. The increase observed in Kcnd3 expression upon inducing neuronal activity in wild-type OBs was not observed in Mitf mutant OBs (Fig. 10AB). Hence, Mitf and Kcnd3 are both regulated in an activity-dependent manner in the MC and the expression of Kcnd3 depends on Mitf in both MC and ETC. Analysis of two MITF ChIPseq datasets (Strub et al., 2011; Laurette et al., 2015) showed that MITF binds to intronic regions of KCND3 in 501mel melanoma cells. The MITF ChIPseq datasets show the same overlapping binding peak B (Fig. 10C, orange). A second MITF binding peak, peak A, was observed only in the Laurette dataset and overlaps with H3K27ac and H3K4me1 ChIPseq peaks in 501mel melanoma cells (Fontanals-Cirera et al., 2017) indicative of an active enhancer (Fig. 10C, yellow). Transcription activation analysis showed that MITF activates expression from a fragment containing peak B in both HEK293T cells (Fig. 10E; MITF-pCMV vs pCMV: q(12) = 22.58, p = 0.0001; MITF-pCMV vs MITFB4RA-pCMV: q(12) = 20.78, p = 0.0001, Dunnett’s multiple comparison) and N2A cells (Fig. 10F; MITF-pCMV vs pCMV: q(12) = 15.39, p = 0.0001; MITF-pCMV vs MITFB4RA-pCMV: q(12) = 15.18, p = 0.0001, Dunnett’s multiple comparison), whereas transcriptionally inactive MITF does not (Fig. 10E,F). Tyr was used as a positive control and was significantly activated in both cell types. No activation was observed in either cell type from a fragment containing peak A. As the region around peak B has active enhancer marks, we conclude that MITF signaling is induced by activity and regulates an enhancer region in an intron of Kcnd3 leading to an activity-dependent increase in Kcnd3 expression in projection neurons of the OB. In accordance with this, stimulus dependent enhancer activity has previously been described in neurons (Walke et al., 1996; Kim et al., 2010; Guzman-Karlsson et al., 2014; Malik et al., 2014; Vierbuchen et al., 2017).
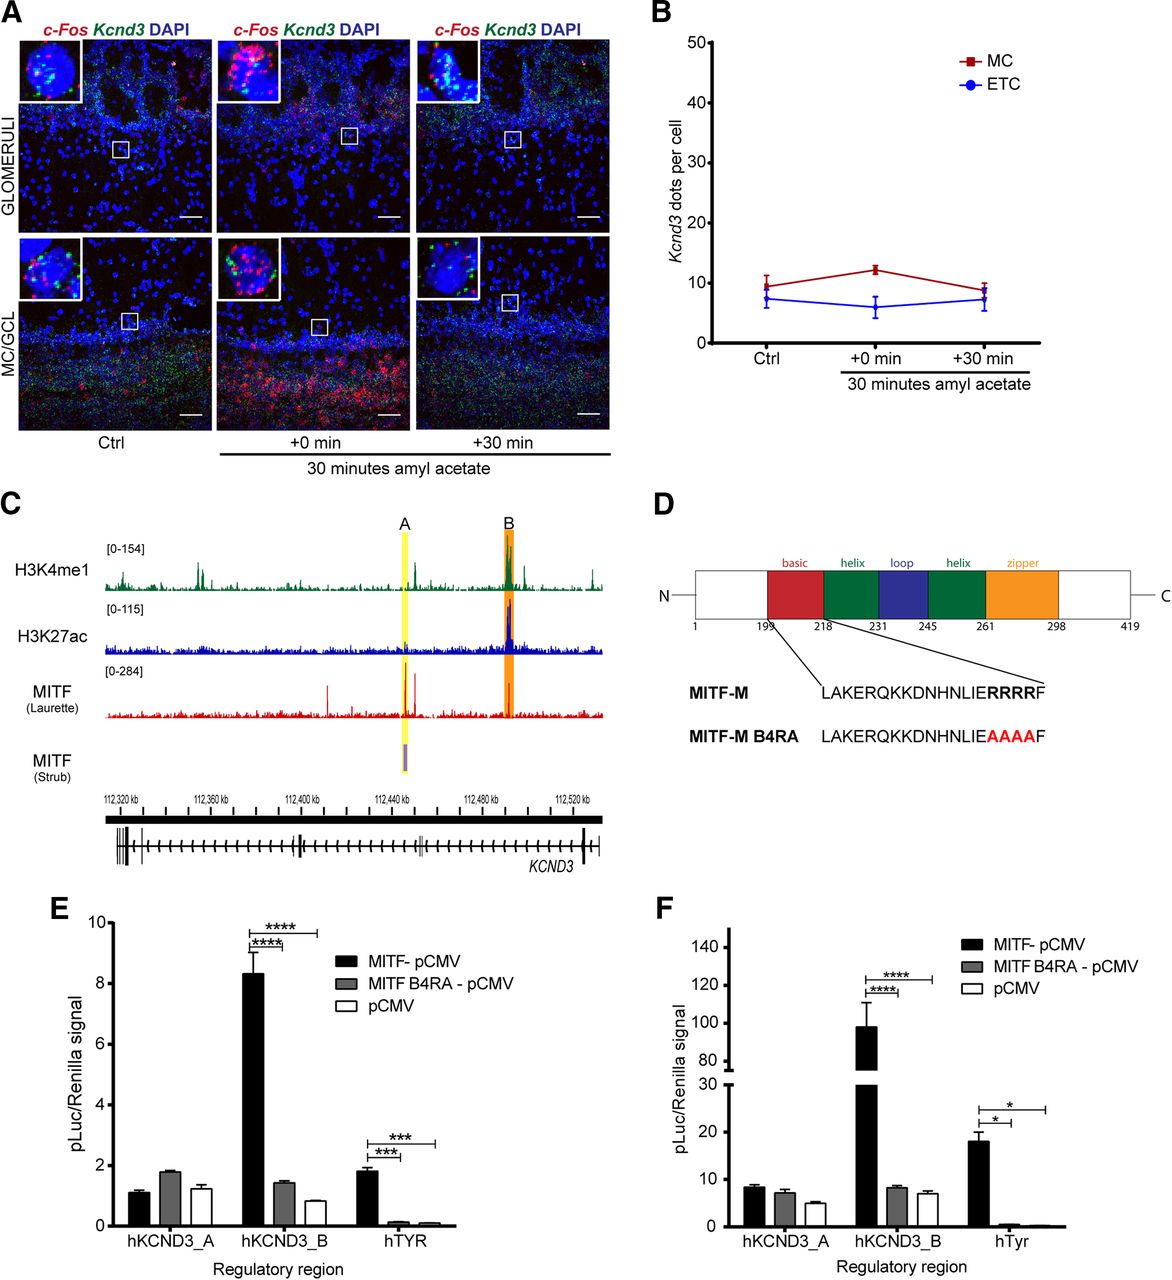
Activity-dependent increase in Kcnd3 expression requires MITF enhancer activity. A, RNA in situ hybridization of c-Fos (red) and Kcnd3 (green) performed in Mitfmi-vga9/mi-vga9 OB following AA. B, Kcnd3 dots per cell in Mitfmi-vga9/mi-vga9 OB following AA. N = 3–5 per time point. C, ChIPseq peaks of MITF, H3K27ac and H3K4me1 on KCND3 gene in 501mel cells. The MITF peaks are labeled A (orange) and B (yellow). Yellow shows overlapping peak of MITF binding in Strub and Laurette datasets (B), whereas orange indicates MITF peaks that overlap with H3K27ac and H3K4me1 peaks (A). D, Sequence of the basic region of wild-type (MITF-M) and transcriptionally inactive MITF with four argenines mutated to alanines (MITF-M B4RA). E, Transcription activation assays performed in HEK293T cells co-transfected with constructs containing the hTYR, hKCND3_pA, and hKCND3_pB regulatory regions fused to luciferase, together with empty vector or wild-type or transcriptionally inactive (B4RA) MITF constructs. N = 3. F, Transcription activation assays performed in N2A cells co-transfected with constructs containing the hTYR, hKCND3_pA, and hKCND3_pB regulatory regions fused to luciferase, together with empty vector or wild-type or transcriptionally inactive (B4RA) MITF constructs. N = 3. The values on the graphs are mean ± SEM DAPI nuclear staining is shown in blue. Scale bars: 50 μm; p values were calculated using two-way ANOVA (B, E, F); *p < 0.05, ***p < 0.001, ****p < 0.0001.
Loss of Mitf affects long-term adaptation
Hyperactive MCs are likely to affect olfaction. Changes in the olfactory neuronal circuits frequently lead to reduced ability to detect odorants or to differentiate between them. Both are critical functions of the olfactory system. Olfactory testing, however, showed no difference in the ability of Mitf mutant and wild-type mice to detect or avoid odors (Fig. 11A,B; Table 1). Next, we tested the ability of Mitf mutant mice to differentiate between odorants. Repeated introduction of the same odorant leads to reduced interest (habituation) and when followed by a novel odorant, renewed interest (dishabituation; Fig. 11C), an established measurement of reduced olfactory discriminatory ability (Yang and Crawley, 2009). In this assay, the Mitf mutant mice showed increased dishabituation when exposed to the chemically similar odorant pair vanilla-almond (Fig. 11D; t(84) = 5.223, p < 0.0001, Dunnett’s multiple comparison). This was also observed when the odorants were introduced in the reverse order (Fig. 11E; t(126) = 5.838, p = 0.0001, Dunnett’s multiple comparison) and when the less chemically similar odorant pair lemon-vanilla was used (Fig. 11F; t(147) = 2.708, p = 0.0144, Dunnett’s multiple comparison). This can be interpreted as increased olfactory discriminatory ability or increased olfactory sensitivity. It is also possible that the mutant mice are more interested in the novel, second odorant. Importantly, Mitfmi-vga9/+ heterozygotes, which are phenotypically similar to wild-type mice, show an intermediate phenotype (Fig. 11D–F). This demonstrates that the changes in olfaction in the Mitf homozygotes are not due to larger cortical area devoted to olfactory processing caused by their blindness and deafness. Odor exposure reduces sensitivity of M/T neurons (Kato et al., 2012) and the appropriate long-term adaptation to sensory input is fundamental to olfaction. Our results suggest that the mutant mice might not adapt well on a longer timescale, as Mitf-dependent transcription would be required. We therefore tested the effects of a long-term exposure of an odorant on olfactory ability, also termed odor fatigue. Under normal circumstances this leads to a reduction in ability to detect the odorant (habituation), followed by recovery once the odorant is removed. However, in the mutant mice, there was a stark reduction in the ability to detect the odorant as six out of eight mutant mice tested did not detect the initial odor when reintroduced (Fig. 11G; t(84) = 3, p = 0.0246, Sidak’s multiple comparison). As this odorant is novel when reintroduced, this makes it unlikely that the Mitf mutant mice are only more interested in new odors. Both assays thus indicate clear differences in olfactory mechanisms between wild-type and mutant mice.
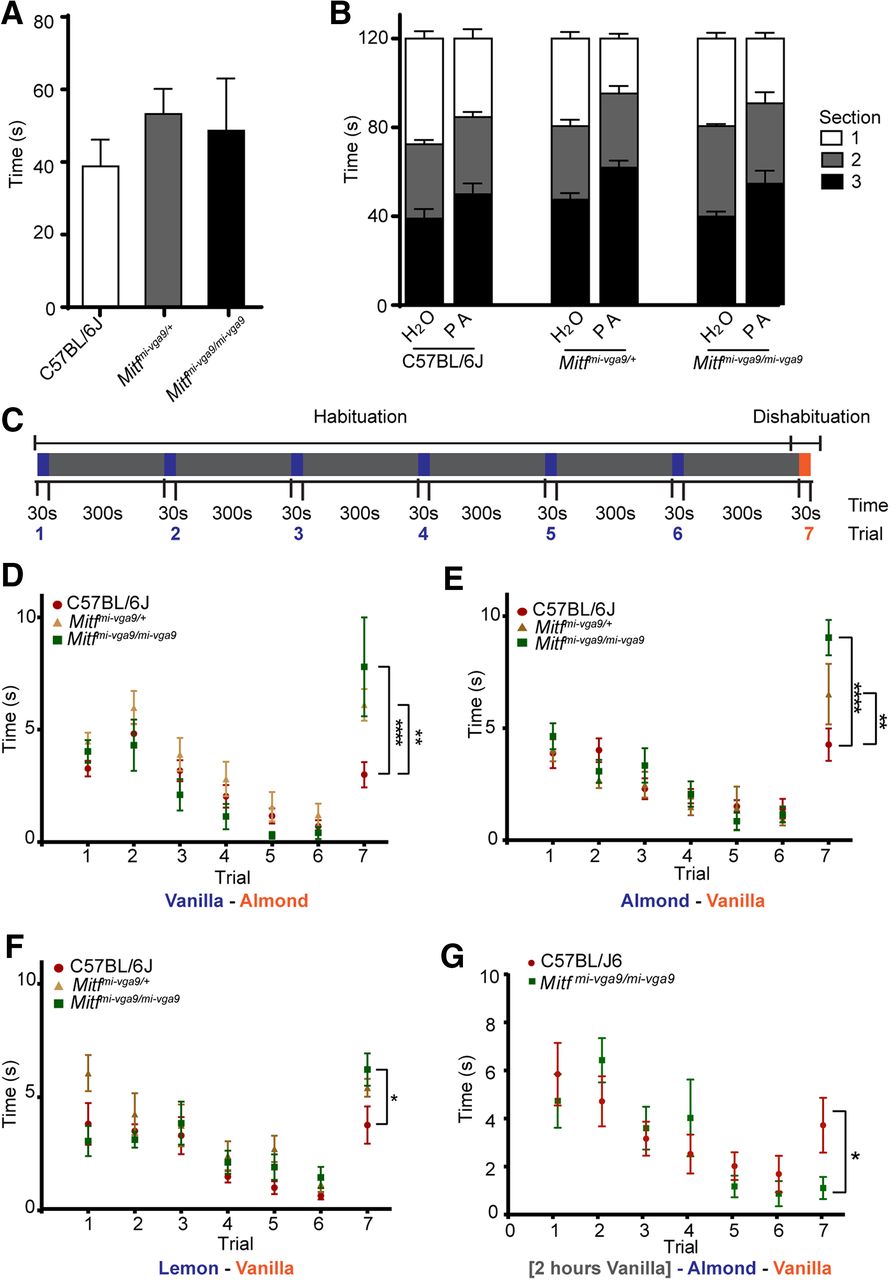
Mitf regulates olfactory discriminatory ability and odor fatigue recovery. A, Quantification of the results of the hidden cereal odor detection-assay. N = 8 per genotype. B, Avoidance assay where a cage was sectioned in three equal areas and mice were exposed to water or propionic acid (PA) in section 1. Quantification shows time spent in each section (Table 2). N = 6–8 per genotype. C, Schematic overview of the dishabituation-habituation assay, where mice are exposed to odor A (blue) for 30 s six times with 5-min intervals, after which they are exposed to odor B (red) for 30 s. D, Dishabituation-habituation, mice were exposed to vanilla as odor A and almond as odor B. N = 8 per genotype. E, Dishabituation-habituation, where mice were exposed to almond as odor A and vanilla as odor B. N = 6–8 per genotype. F, Dishabituation-habituation, mice were exposed to almond as odor A and lime as odor B. N = 8 per genotype. G, Dishabituation-habituation assay where the mice were exposed to vanilla for 2 h, followed by almond as odor A and vanilla as odor B. N = 15 per genotype. The values on the graphs are mean ± SEM; p values were calculated using one-way ANOVA (A) or two-way ANOVA (B, D–G); *p < 0.05, **p < 0.01, ****p < 0.0001.
Two-tailed paired Student’s t test performed on avoidance behavior
We propose a hypothesis for a functional role of Mitf in projection neurons of the OB, where it regulates the intrinsic excitability of the neurons following activity induction, by reducing the neuronal firing rate of neurons through its regulation of Kcnd3 expression. In this model, the activity of OSNs leads to an increase in Mitf expression, and an Mitf-dependent increase in the transcription of Kcnd3 in the output neurons of the OB. It is possible that the presence of MITF, rather than its level or postranslational state, guides the expression of Kcnd3 following activity. An increased IA-current decreases the likelihood of the generation of action potential and reduces activity leading to decreased sensitivity of the glomeruli in question (Fig. 12). Conversely, lack of activity in a glomerulus could lead to the opposite mechanism and increased sensitivity (Tyler et al., 2007).

Model of MITF as a regulator of homeostatic intrinsic plasticity. Upon neuronal activity in the OB, MITF is required for an increase in Kcnd3 expression. More Kv4.3 protein results in an increase in the IA potassium current and reduced likelihood of action potentials, subsequently leading to decreased activity of M/T cells.
Discussion
The transcription factor Mitf is expressed distinctly in the excitatory neurons (M/T) of the mouse OB (Ohba et al., 2015). M/T neurons are generated in the Mitf mutant mouse and express the appropriate neuronal markers suggesting that loss of Mitf does not affect their development. However, electrophysiological analysis of M/T cells in vitro showed that these cells are hyperactive and show loss of the potassium IA-current. This is further supported by reduced gene expression of Kcnd3, a potassium channel subunit required for the IA-current. Expression of the activity-dependent c-Fos gene showed that there is an increase in neuronal activity in Mitf mutant mice in vivo. However, this was not observed in all M/T cells. ETCs, a subclass of tufted cells, which drive olfactory output (Hayar et al., 2004a) and link OSN with M/T neurons (Gire et al., 2012), do not show increased expression of c-Fos under baseline conditions in the mutant. On the other hand, MCs, the key projection neurons of the OB, showed increased expression of c-Fos in Mitf mutant OBs. Interestingly, by inducing olfactory activity in wild-type mice using a strong odorant known to activate many glomeruli, we observed an increase in both Mitf and Kcnd3 expression in the MCs. The expression of both c-Fos and Mitf, but not Kcnd3, was increased upon activity in the ETC. This demonstrates that the MCs and ETCs, which have different functions in the olfactory neuronal circuit, also have a different intrinsic response to activity. One possible interpretation is that the transcription of Kcnd3 is not regulated by Mitf in the ETCs during activity as the adaptive response is more efficient or faster when it occurs only in the key output neurons, rather than also in neurons which drive their activity. It is also noteworthy that ETC show increased expression of Kcnd2 in the mutant (Fig. 7), which would dampen the effect of reduced Kcnd3 and thus explain reduced effect on ETC’s activity.
The increased activity of projection neurons has wide-ranging consequences for OB function. The Mitf mutant mice show increased olfactory dishabituation, which might mean increased ability to discriminate between odors or increased olfactory sensitivity. This is a rarely reported characteristic of mutant mice (Fadool et al., 2004), and the expectation is that olfaction works at maximum discriminatory power, since this is most beneficial for the organism. As we detect no changes in mobility, motivation nor interest in novelty in other assays (Fig. 11A,B,G), we conclude that this phenotype is inherent to the OB, also due to the fact that the heterozygote shows an intermediate phenotype. One explanation, for this difference in dishabituation is the increased number of glomerular excitatory neurons of the OB. The nature of the olfactory phenotype in the Mitf mutant mouse is also likely due to increased levels of lateral inhibition due to increased activity (Nunez-Parra et al., 2013; Nunes and Kuner, 2015) and/or more glomeruli being activated by each odorant due to lower threshold of firing, leading to reduced cross-habituation (Mombaerts et al., 1996). Further studies will determine this. Importantly, while the Mitf mutant mouse has increased dishabituation, long-term odor exposure leads to a reduction in the ability to detect that odorant, i.e., increased habituation. This shows that Mitf is required for normal long-term adaptation in the OB and that the increase in olfactory sensitivity observed in the mutant mice comes at a cost. Likely functional explanations are either that projection neurons are overwhelmed with activity or that high activity of projection neurons in the mutant leads to stronger adaptation in the olfactory cortex. Both cases show how important Mitf is for olfactory adaptation.
Neuronal activity sculpts the nervous system and is required for adaptive changes in neuronal function. To do so, neuronal activity must functionally change the neuron, by impacting its firing frequency or the strength of individual synapses. However, neurons also need to tightly regulate their own activity: too much neuronal activity is costly and can lead to excitotoxicity or uncontrolled firing, whereas the loss of neuronal activity leads to loss of information and neurodegeneration. To avoid this, mechanisms are in place to maintain neuronal activity within a set window, and the ability of a neuron to be plastic has to be within the confines of such neuronal homeostasis (Turrigiano, 2008; Pozo and Goda, 2010; Titley et al., 2017). Our results show how sensory activity can affect firing rate of the OB projection neurons in an Mitf dependent manner through effects on A-type currents via Kcnd3 expression. This mechanism can maintain neuronal homeostasis or determine the sensitivity or neuronal gain-control of the projection neurons on a longer time scale, i.e., it is based on transcriptional changes. Importantly, electrophysiological analysis in primary neurons shows that changes in potassium currents are cell autonomous and not due to changes in OB circuits. Detailed analysis of the electrophysiology of M/T neurons in OB slices and in vivo is needed to further dissect the consequences for olfaction.
Sensory systems focus on detecting novelty or change. In olfaction, this translates into the ability to quickly distinguish rare but important odors from background odors (Tyler et al., 2007; Kato et al., 2012). In the OB, Mitf is pivotal to the adaptation of individual glomeruli through regulating intrinsic homeostatic plasticity in an activity-dependent manner. Most glomeruli are activated rarely by odorants. However, they can play important roles in detecting rare threats or food sources, both of high survival value. Keeping these glomeruli sensitive is therefore of high adaptive value and our model provides a mechanism through which this can occur. Thus, regulation of intrinsic plasticity, as described here, provides a mechanism through which olfaction can be insensitive to background odors but sensitive to rare odors.
Acknowledgments
Acknowledgements: We thank our colleagues from the BioMedical Center at the University of Iceland, Erna Magnúsdóttir, PhD; Ragnhildur Káradóttir, PhD; Margrét Helga Ögmundsdóttir, PhD; Ramile Dilshat; Kimberley Anderson; Alba Sabate; and Unnur Diljá Teitsdóttir for their help.
Footnotes
The authors declare no competing financial interests.
This work was supported by the Icelandic Research Fund, Rannís Grants 152715-053 and 163068-051.
This is an open-access article distributed under the terms of the Creative Commons Attribution 4.0 International license, which permits unrestricted use, distribution and reproduction in any medium provided that the original work is properly attributed.
References
In this issue


