

Article Figures & Data
Figures
- Figure 1.
Overview of spindle detection in sheep. A, Eight recording channels and a reference electrode were surgically implanted onto the surface of the sheep brain. B, Sleep spindles were observed in both raw waveforms (top) and when filtered between 10 and 16 Hz (bottom). C, A spectrogram of the sleep spindle in B. D, E, Raw traces for each of the eight recording channels show an example of a global sleep spindle event (highlighted in red) occurring simultaneously in multiple channels (D), and a local sleep spindle occurring in a single channel (E). The color scale shows the proportion of the detection threshold. This is scaled to the power in each channel so that a value of “1” represents the power threshold that needs to be exceeded in order for a spindle to be detected. This figure is extended in Extended Data Figures 1-1 and 1-2. R, Reference.
- Figure 2.
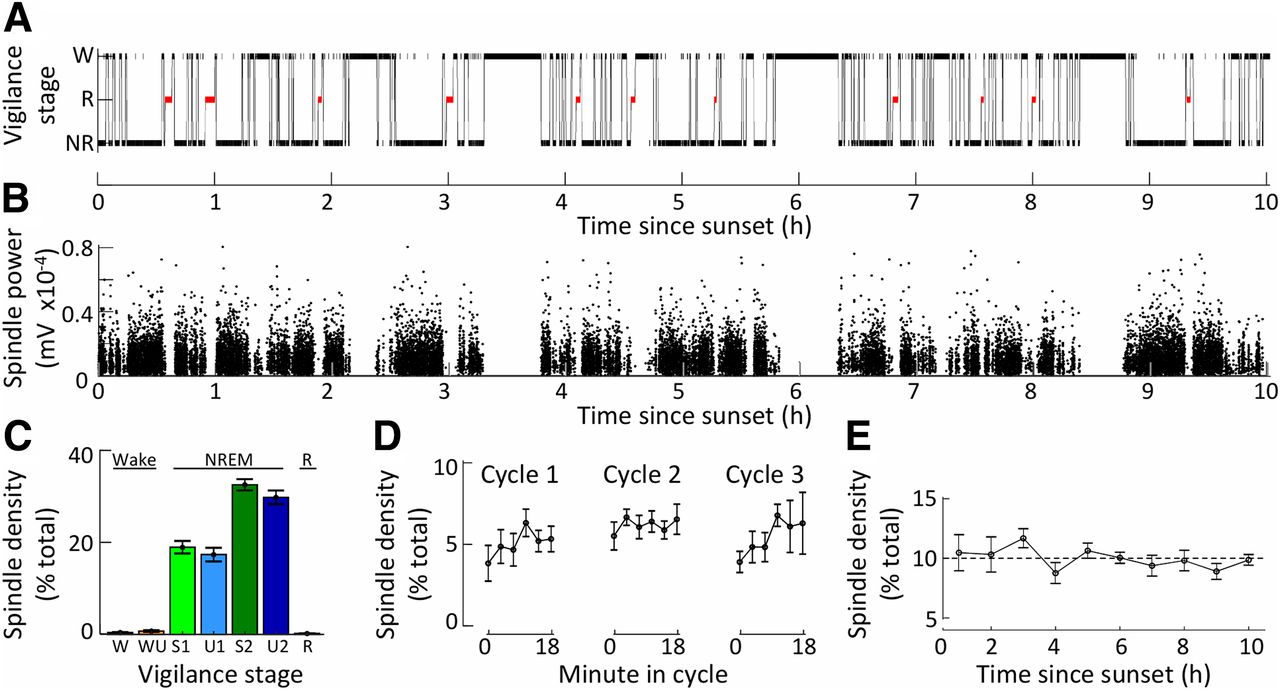
Spindle density correlates primarily with non-rapid eye movement sleep. A, A hypnogram for a single sheep is shown between sunset (t = 0) and sunrise (t = 10). Data are shown as the mean ± SEM. B, Power of spindle detections from the same EEG recording. A black dot marks each spindle detection. Detections from all channels are included. C, The proportional density of spindles detected (N = 6 sheep) in each vigilance stage. D, Proportional densities (N = 5 sheep) of spindles for the first three sleep cycles lasting 18 min. E, Proportional densities (N = 6 sheep) of spindles throughout a single night (normalized for the amount of NREM sleep in each hour period). W, wake; WU, wake with rumination; R, REM sleep (highlighted in red); NR, NREM sleep. NREM sleep is split into four subgroups (light green, S1; light blue, U1; dark green, S2; dark blue, U2).
- Figure 3.
Local and simultaneous spindle topography. A, Spindles that occurred locally (only in one channel) are shown as the proportion of the total number of local spindles that occurred, for each sheep. The size of each black dot represents the number of local spindles occurring in a particular channel. B, The data represent the occasions on which spindles occurred simultaneously in two channels. The size of the black dot is again representative of the number of spindles occurring at each electrode for each sheep. The pairing of spindles is shown by the color and size of the lines linking two dots. Thicker lines and darker colors mean the likelihood of spindles firing simultaneously in those two channels is higher. C, The mean of spindle pairings for all sheep (N = 6). D, Data show the distribution of spindles when four or more spindles occur simultaneously. Again, the proportion of spindles occurring in a particular channel is shown by the size of the back dot, and the likelihood of simultaneous occurrence of spindles is shown by pseudocolored lines linking the dots. E, Mean data for spindles occurring simultaneously in four or more channels are shown (all sheep; N = 6). F, Histograms show how many channels were involved in each spindle event, for each sheep. G, H, For pairs of spindles (G) and for spindles occurring in four or more channels (H), the relationship between the channels in which simultaneous spindles occurs is shown as heat maps. For G, where data from two simultaneous spindles are shown, the rows represent the total number of spindles occurring in a particular channel, and the columns show the channel in which the second spindle occurs. The data shown in H are similarly represented for spindles that occur in four or more channels.
- Figure 4.
Spindles during the night and day for a single sheep. A–C, Cumulative spindle plots show the rate of spindle occurrences during night 1 (A), day 1 (B), and night 2 (C). B′, The change in local and simultaneous spindle density as day sleep returns to day wake can be seen in the enlarged plot (indicated with an arrow). C′, A similar shift from sleep to wake, but in the night. Simultaneous spindles (occurring in more than one channel at a time) are shown in black. Local spindles are shown in red. D–F, Hypnograms show the changes in vigilance stage for the same sheep, during night 1 (D), day 1 (E), and night 2 (F). G–J, Spindle density in each channel for this sheep is shown for night 2 NREM sleep (G), day 1 NREM sleep (H), night 2 wake (I), and day 1 wake (J). The breaks in the data and axes at 5 h in the day recordings for B and E indicate the times at which battery changes occurred. This figure is extended in Extended Data Figures 4-1 and 4-2.
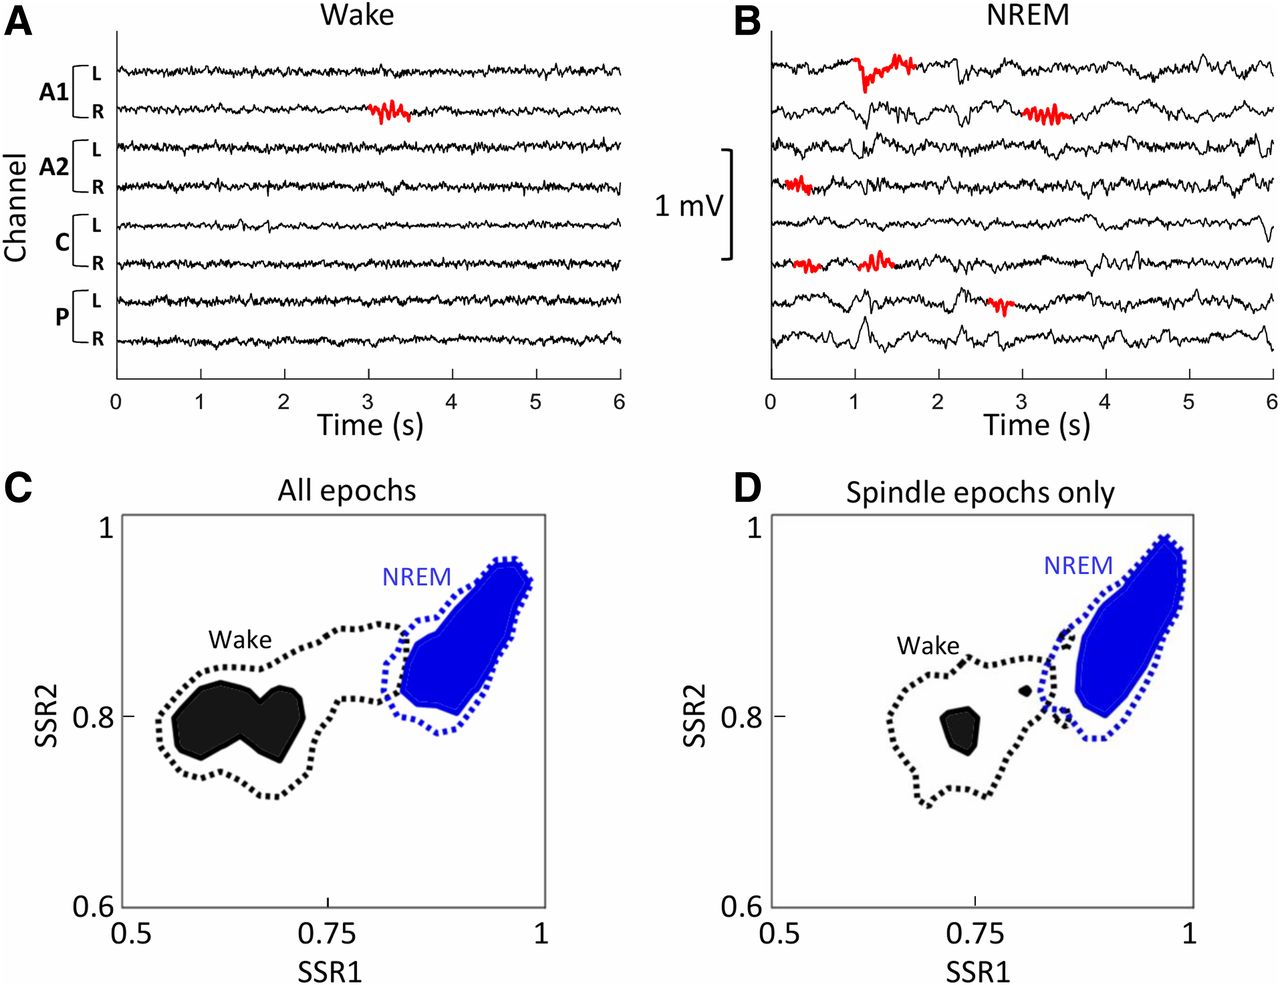
- Figure 5.
Clear separation of daytime EEG spectral states in epochs containing spindle detections. A, B, Local spindles were detected during the day in both wake (A) and NREM sleep (B). C, Averaged sleep space state maps of spectral power during the day (all sheep and all channels) show a clear separation of wake (black) and NREM sleep (blue) states in epochs in which spindles were detected. The solid areas and dashed lines show the ratios where the two sleep states are dominant [with a threshold of 5 times (solid) or 2.5 times (dashed) above baseline]. D, The separation of the solid filled areas remains clear when only epochs from individual channels in which a spindle was detected are included (all sheep, spindle channels only). SSR1 is the ratio of power of 6.5–9/0.5–9 Hz; SSR2 is the ratio of power of 0.5–20/0.5–100 Hz.


Extended Data
Figure 1-1
Examples of intersheep differences in spindle characteristics. Whisker plots show spindle characteristics during NREM for each sheep (N = 6). A–D, Spindle density (A) frequency (B), spindle length (C), and spindle power (D). All data are taken from night 2. Spindle characteristics vary widely between individuals, and this is not due to a single outlier. Download Figure 1-1, TIF file.
Figure 1-2
General spindle characteristics in sheep. Download Figure 1-2, DOCX file.
Extended Data 1 - Code Files
The spindle detection code is included here. The file “basicSpindleWorkflow” gives an example of how the code can be run. The code is also available online at the following URL: [https://uk.mathworks.com/matlabcentral/fileexchange/73390-spindle-characterisation-characterising-sleep-sp-in-sheep]. Download Extended Data 1, ZIP file.
Figure 4-1
Paired Wilcoxon rank sum tests between simultaneous spindles (sim.) or local spindles, and between vigilance group for differences in spindle density (per minute). Download Figure 4-1, DOCX file.
Figure 4-2
Correlations in spindle characteristics between night/day and sleep/wake periods. A, B, Spindle density (per minute) correlations are shown between night sleep and day sleep (A), and between night sleep and day wake (B). Spindle density is plotted separately for all eight channels in each sheep. Each sheep is identified by a unique symbol: ○, ●, □, ■, △, or ▲. Solid red lines show the linear regression. Dashed red lines show the 95% confidence bounds. C, D, Mean spindle frequency correlations are shown between night sleep and day sleep (C) and between night sleep and day wake (D). E, F, Mean spindle duration correlations are shown between night sleep and day sleep (E) and between night sleep and day wake (F). Download Figure 4-2, TIF file.
In this issue


