

Article Figures & Data
Figures
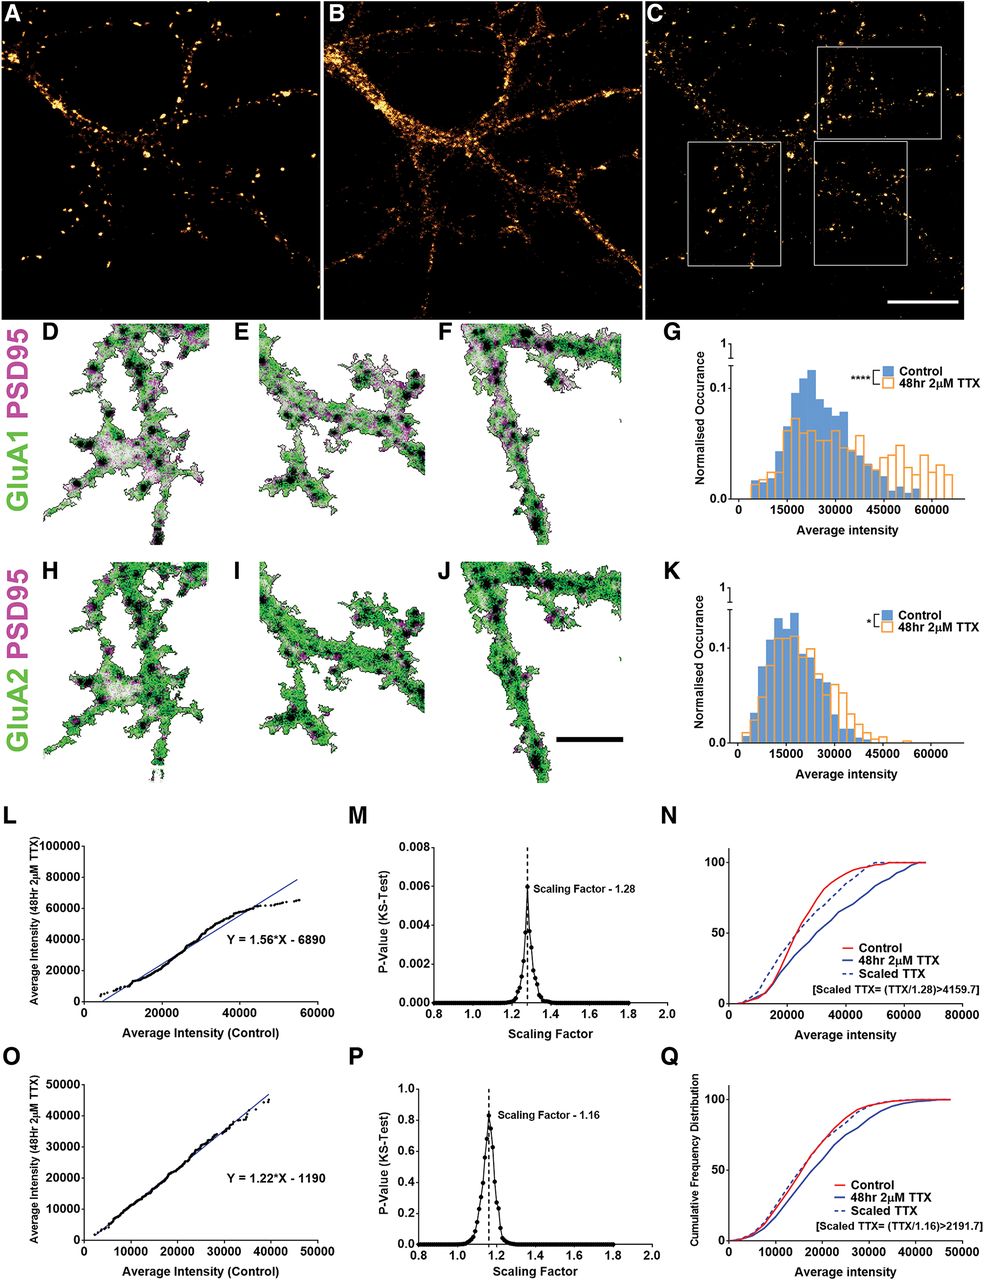
- Figure 1.
Multiplicative scaling of excitatory synapses using rank order analysis. A–C, Mice hippocampal neurons of DIV14 treated for 48 h with 2 μM TTX to study homeostatic synaptic scaling. The cultures were fixed and immunolabelled for the C terminus of AMPA receptor subunits GluA1 (A), GluA2 (B), and a PSD protein PSD95 (C). D–F, H–J, Representative dendritic compartments of the images in A–C with PSD95 in magenta and GluA1 (D–F) or GluA2 (H–J) in green. Scale bars: 10 μm (A–C) and 5 μm (D–F, H–J). G, K, A histogram was plotted for the average intensity of GluA1 (G) or GluA2 (K) per PSD95 puncta between the control and the TTX-treated conditions (n = 534 and 454 synapses for control and TTX dataset, respectively, p < 10−6 for GluA1 and p < 10−3 for GluA2, respectively, KS test). L, O, A random sample of 400 intensity values were chosen, rank ordered and plotted to provide a scaling equation for GluA1 (L; y = 1.56x – 6890) and GluA2 (O; y = 1.22x − 1190). M, P, Using the slope of the equation as a reference, the TTX dataset was scaled using multiple values and compared with the control. The scaling factor providing the maximum p value between the scaled-TTX and control dataset was chosen as the multiplicative scaling factor for GluA1 (1.28, p = 0.006, KS test; M) and GluA2 (1.16, p = 0.80, KS test; P). N, Q, Cumulative frequency distribution between control, TTX, and scaled-TTX for GluA1 (N) and GluA2 (Q) showed no significant difference between the control and scaled-TTX distributions.
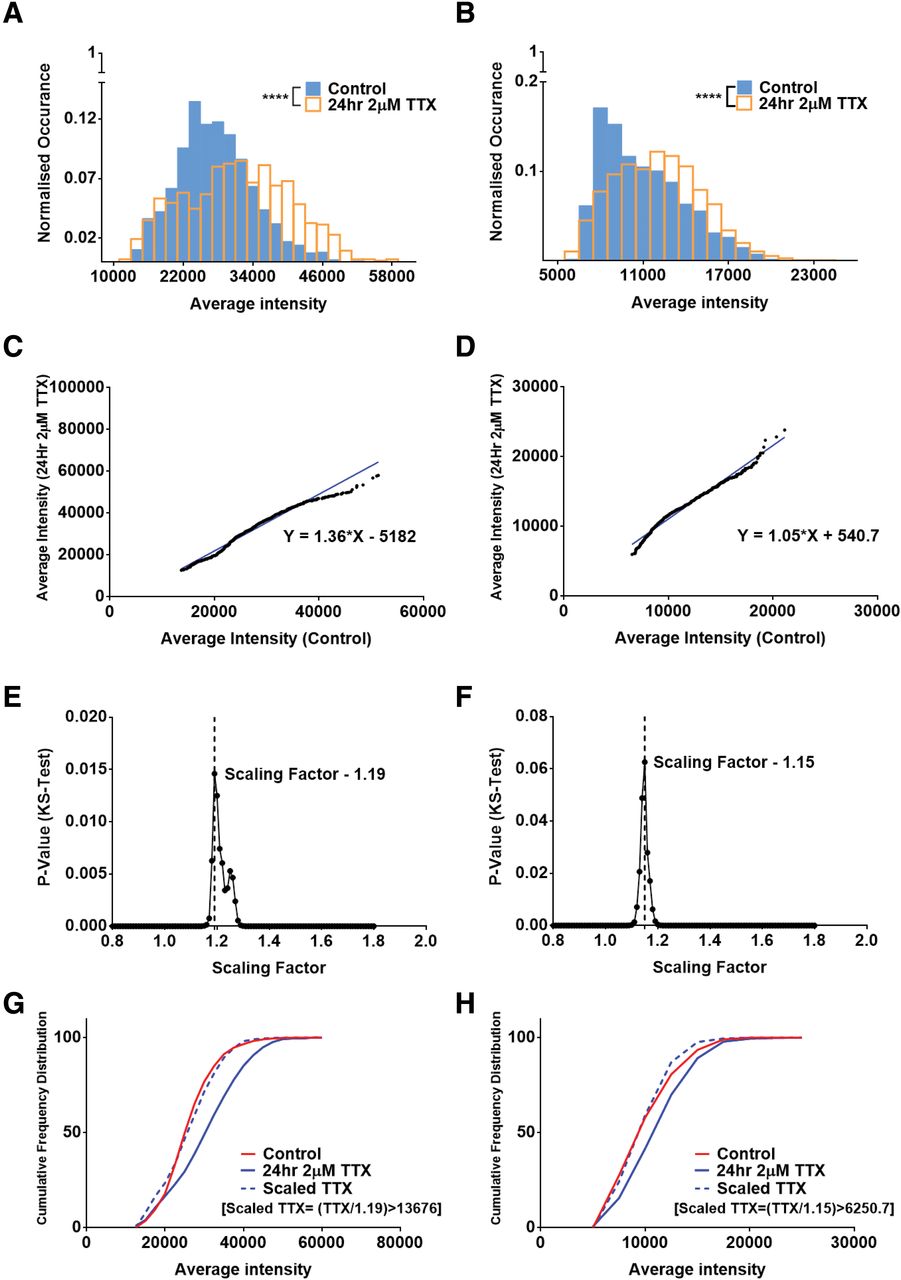
- Figure 2.
Multiplicative scaling of synaptic scaffolding molecules during homeostatic scaling in rodents. A, B, Histogram comparing the average intensity of Shank2 per puncta in the control and TTX conditions showed positive scaling after 24 h of treatment for both mouse (A) and rat (B) cultures (n = 1889 and 826 synapses for mouse and 1592 and 1821 synapses for rat, for control and TTX dataset, respectively, p < 10−6, KS test). C, D, A total of 800 random average intensity data points were chosen, rank ordered, and plotted to provide a scaling equation for mouse (C; y = 1.36x – 5182) and rat (D; y =1.05x + 540.7) cultures. E, F, The scaling factor providing the maximum p value between control and scaled-TTX datasets was chosen as the multiplicative scaling factor for both mouse (E; 1.19, p = 0.015, KS test) and rat (F; 1.15, p = 0.063, KS test) cultures. G, H, A cumulative frequency distribution was plotted for control, TTX, and the scaled-TTX (calculated with the help of the scaling factor) datasets for the mouse (G) and rat (H) showing no significant difference between the control and the scaled-TTX dataset. For comparison of multiplicative scaling of other synaptic scaffolding molecules, please refer to Extended Data Figure 2-1. A detailed analysis of sampling efficiency for calculating multiplicative scaling factor and significance of scaling factors are detailed in Extended Data Figures 2-2, 2-3, respectively. Analysis referring to accuracy of scaling in homeostatic plasticity is shown in Extended Data Figure 2-4.
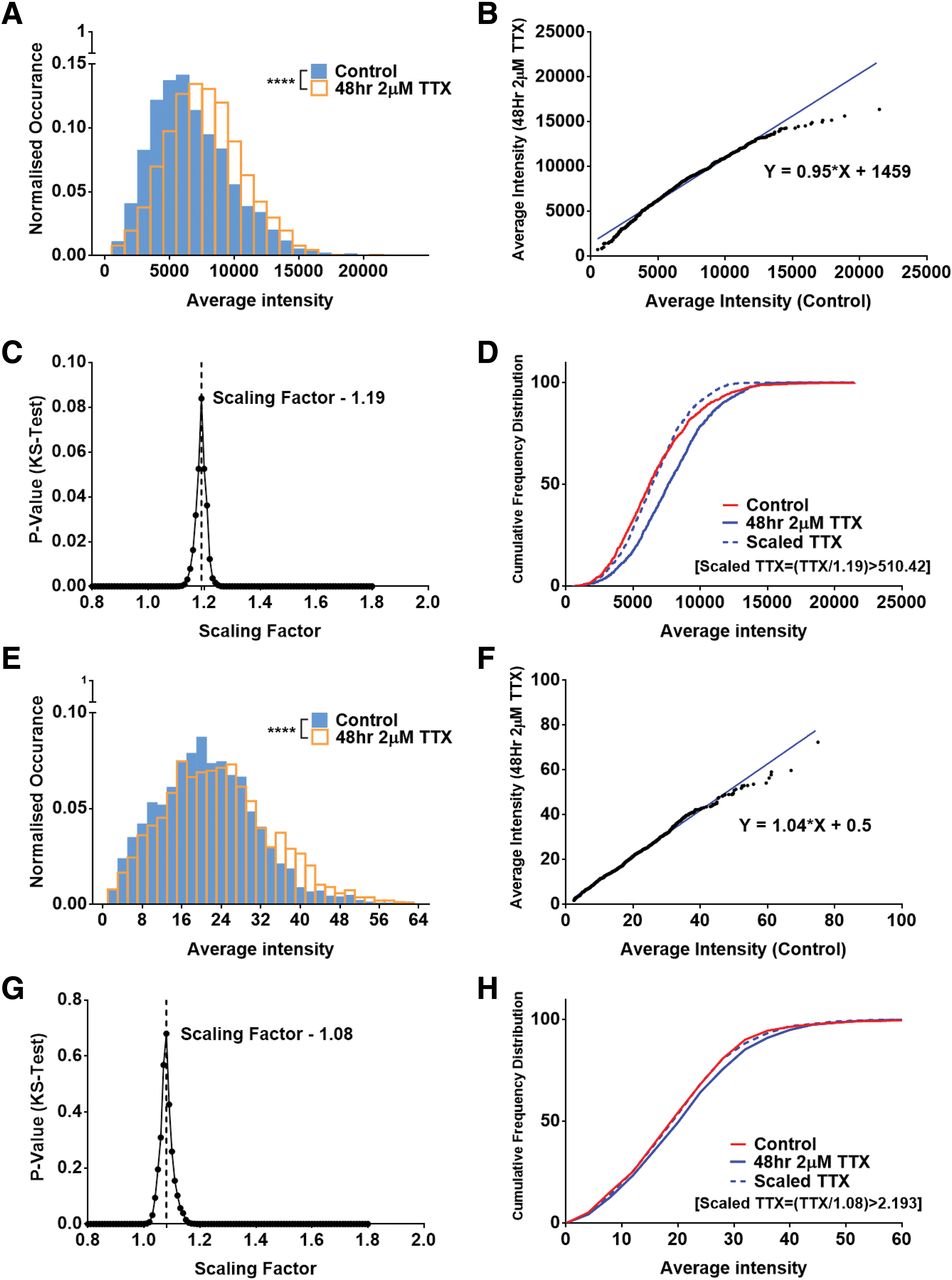
- Figure 3.
Differential scaling of synaptic AMPA receptor pools at excitatory synapses during homeostatic scaling. A, E, Histograms were constructed to compare the control and TTX dataset for the average intensity of GluA2 segmented within the Shank2 puncta for global synaptic GluA2 using the C-terminal antibody (A) and surface gluA2 using the N-terminal antibody (E); n = 1893 and 1781 synapses for global and 2259 and 2411 for surface GluA2, for control and TTX dataset, respectively, p < 10−6, KS test. B, F, A total of 1000 random puncta were chosen from both the control and TTX dataset, rank ordered, and plotted to provide the scaling equation for global gluA2 (B; y = 0.95x + 1459) and surface gluA2 (F; y = 1.04x + 0.5). C, G, The random sample of the TTX dataset was scaled down using multiple prospective scaling factors and the factor providing the maximum p value between the control and the scaled-TTX dataset was chosen as the multiplicative scaling factor for global gluA2 (C; 1.19, p = 0.084, KS test) and surface gluA2 (G; 1.08, p = 0.680, KS test). D, H, The cumulative distribution was plotted between the control, TTX, and the scaled-TTX (obtained with the help of the scaling factor) for the global (D) and surface (H) GluA2 levels, indicating no significant difference between the control and the scaled-TTX dataset. A gallery of immunocytochemical images for global and surface distribution of GluA2 is presented in Extended Data Figure 3-1.
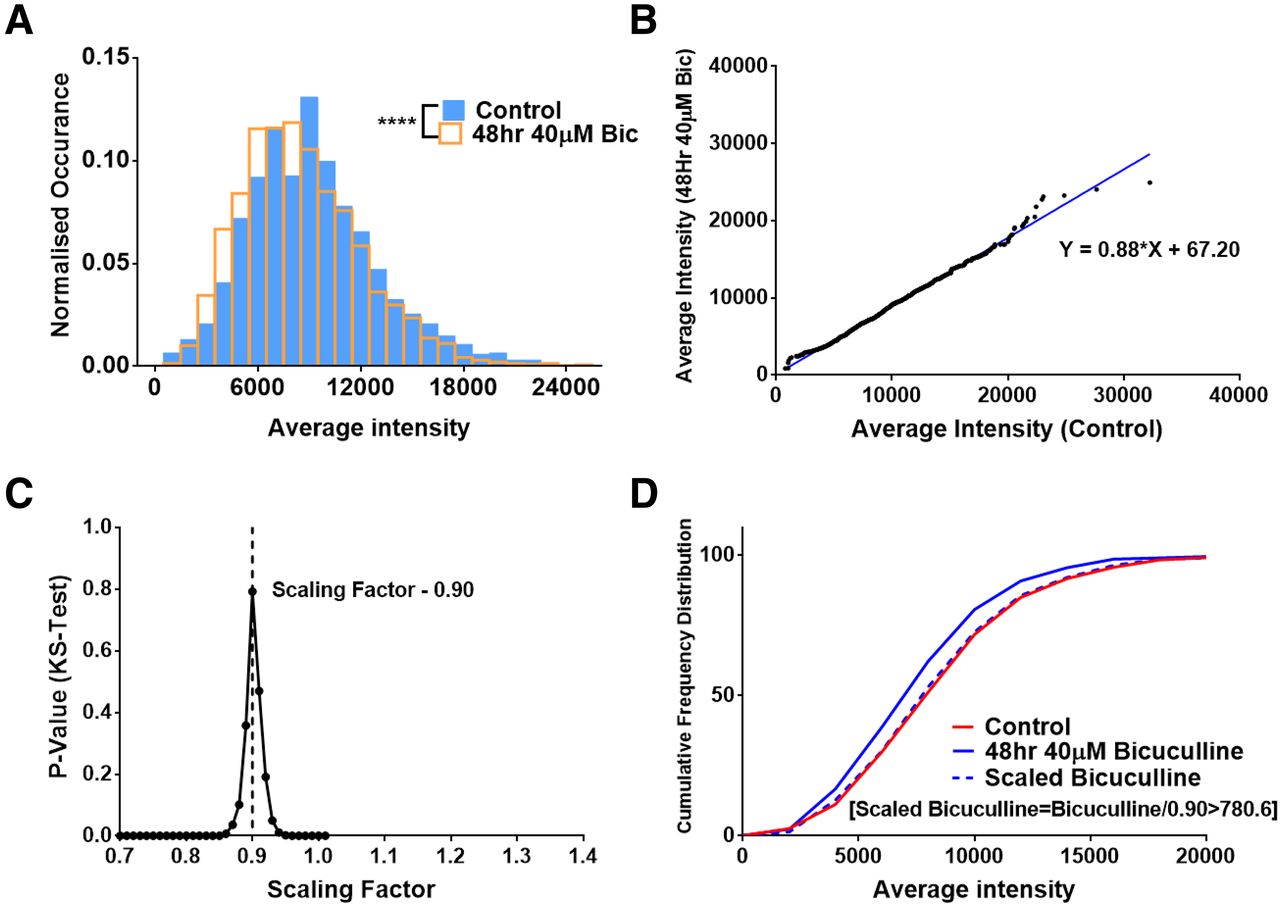
- Figure 4.
Scaling down of synaptic pool of surface AMPA receptors. A, The normalized frequency distribution of average intensity of surface expressed synaptic GluA2 segmented within Shank2 puncta is plotted for control neurons and neurons treated with 40 μM bicuculline for 48 h. There is a a significant difference between the control and bicuculline dataset (n = 10 cells, 1697 and 2988 synapses for control and bicuculline dataset, respectively, p < 10−6). B, A total of 1300 synapses were randomly sampled from the control and bicuculline dataset, rank ordered and plotted to obtain the scaling equation (y = 0.885x + 67.20). C, The sampled bicuculline dataset was scaled with a number of arbitrary multiplicative scaling factors and compared with the control data. The scaling factor providing the maximum p value was chosen as the multiplicative scaling factor (0.90, p = 0.791). D, The cumulative distribution of the control, bicuculline and scaled bicuculline population was plotted showing that the scaled bicuculline population was not significantly different from the control distribution.
- Figure 5.
Differential scaling of synaptic AMPA receptor pools within functional zones of an excitatory synapses during homeostatic scaling. A, B, Confocal and STED imaging were performed for Shank2 (A) and GluA2 (B). A, An adaptive threshold mask was created for Shank2 observed on the synapse (red + blue), perisynapse (red), and PSD (blue) image, and the puncta regions were used to determine different subsynaptic compartments. Analysis scheme for spatial differentiation of functional zones of the synapse using confocal and STED imaging is presented in Extended Data Figure 5-1. B, GluA2 STED image overlaid with red outline indicating the synapse, blue outline indicating the PSD and the region enclosed between the red and blue regions indicating the perisynaptic compartment. 1–6, The insets display different zoomed regions of the GluA2 STED image. Scale bars: 4.5 μm (A, B) and 1 μm (1–6). C–E, Histograms constructed for the average intensity of GluA2 segmented within the Shank2 confocal (C), Shank2 STED (D), and the area between the Shank2 confocal and STED puncta or the perisynaptic area (E) between the control and the TTX dataset showed significant scaling of GluA2 within various subsynaptic compartments (n = 2217 and 2401 for GluA2 in the synapse, p < 10−6, 2694 and 2438 for GluA2 in the PSD, p < 10−4 and 2276 and 2353 for GluA2 in the perisynapse, p < 10−6, for control and TTX dataset, respectively, KS test). F–H, A total of 1000 random puncta were chosen from each dataset and the control set was plotted against TTX dataset to provide a scaling equation for the GluA2 scaling within the synapse (F; y = 1.08x + 0.84), the PSD [G; y = 0.23x + 16.00 (green) and y = 0.83x + 4.62 (blue)], and the perisynapse (H; y = 1.02x + 0.82). I–K, Representative scaling factors providing the maximum p value between the control and the scaled-TTX dataset was chosen as the multiplicative scaling factor for GluA2 within the synapse, (I) in the PSD (J) and in the perisynapse (K). L–N, Cumulative frequency distribution between the control, TTX, and scaled-TTX dataset showed no significant difference between the control and the scaled-TTX dataset for GluA2 within the synapse (L), PSD (M), and the perisynapse (N). Multiplicative scaling of Shank2 at the PSD is presented in Extended Data Figure 5-2.


Extended Data
Extended Data Figure 2-1
Multiplicative scaling of scaffolding molecules in rodents. Immunocytochemistry was performed for PSD95 in mouse and rat cultures (DIV14) and Bassoon in mouse cultures (DIV21) following treatment with 2 μM TTX for 24 h. A–C, Histograms constructed for the average intensity of PSD95 and Bassoon in both control and TTX-treated condition showed significant scaling in both mouse (A, C) and rat (B) cultures [n = 1836 and 977 synapses for mouse PSD95, p < 10−5 (A), 1747 and 2072 synapses for rat PSD95, p < 10−6 (B) and 751 and 1798 synapses for mouse Bassoon, p < 10−6 (C), KS test]. D–F, A total of 800 random puncta (700 in the case of mouse Bassoon) were chosen from both the control and TTX dataset and plotted to obtain the scaling equation for mouse (PSD95: y = 1.32x – 5175; Bassoon: y = 1.32x – 2573; D, F) and rat (PSD95: y = 1.30x – 1604; E) data. G–I, The TTX dataset was scaled using a number of arbitrary scaling factors and compared to the control. The factor providing the largest p value was chosen as the multiplicative scaling factor for mouse (PSD95 – 1.11, p = 0.026; Bassoon – 1.25, p = 0.14, KS test; G, I) and rat (1.2, p = 0.106, KS test; H) cultures. J–L, A cumulative frequency distribution was plotted for the control, TTX, and scaled-TTX showing that the control and the scaled-TTX dataset were not significantly different for either mouse (J, L) or rat (K) cultures. Download Figure 2-1, EPS file.
Extended Data Figure 2-2
Sampling efficiency for calculating multiplicative scaling factor. A, Rat hippocampal neurons (DIV14) were treated with 2 μM TTX for 48 h and immunolabelled for Shank2. The Shank2 confocal dataset for this condition was sampled at 200, 400, 600, 800, 1000, 1200, 1400, 1600, and 1800 data points for both the control and TTX datasets. A scaling factor was calculated 100 times for each sampling level with the help of previously described methods. The range of scaling factors obtained for each sampling level is plotted in the form of a box and whiskers plot (A). B, A graph of the sampling factor variance was plotted against the sampling level for the dataset. Download Figure 2-2, EPS file.
Extended Data Figure 2-3
Significance of a low scaling factor. A–I, The Shank2 confocal data for DIV14 rat cultures treated with 2 μM TTX for 48 h and sampled at 200, 400, 600, 800, 1000, 1200, 1400, 1600, and 1800 data points for both the control and TTX data. The sampled data from the control and TTX dataset were compared within themselves as well as between each other (i.e., control to control, TTX to TTX, and control to TTX); 100 scaling factors were obtained in each case. A cumulative frequency distribution was plotted for the scaling factors obtained in the case of control versus control, TTX versus TTX, and control versus TTX comparison for the sampling levels 200 (A), 400 (B), 600 (C), 800 (D), 1000 (E), 1200 (F), 1400 (G), 1600 (H), 1800 (I). J, The scaling factors obtained for each sampling level was compared between the control versus control, TTX versus TTX, and control versus TTX dataset with the help of a KS test, and the p value was plotted against the sampling level. Download Figure 2-3, EPS file.
Extended Data Figure 2-4
Accuracy of scaling in homeostatic plasticity of Shank2 at 48 h. A, The maximum p values obtained while comparing 1000 randomly sampled synapses from the control and TTX distribution during the calculation of scaling factor repeated 500 times. B, Gaussian fits of the normalized frequency distribution of scaling factors obtained while comparing the control and TTX datasets for each sampling size repeated 500 times. C, Gaussian fit of the normalized frequency distribution of the error from mean of the scaling factors obtained in Figure 1B. D, Tabular column detailing the average scaling factor and SD of error obtained for 1000 randomly sampled synapses from the control and TTX dataset repeated 100, 500, and 1000 times Download Figure 2-4, EPS file.
Extended Data Figure 3-1
Immunocytochemistry for global and surface GluA2. A–D, Images of GluA2 labelling with the help of C-terminal and (E–H) N-terminal antibodies against the GluA2 subunit were obtained on a confocal microscope to indicate the global and surface population of GluA2 containing AMPA receptors. All the images are scaled similarly. Scale bar: 100 μm. Download Figure 3-1, EPS file.
Extended Data Figure 5-1
Spatial differentiation of functional zones of the synapse using confocal and STED imaging. A, Shank2 confocal and (D) STED images were utilized to identify different subsynaptic compartments in the dendrite. B, Adaptive thresholding method was used to create a mask of the Shank2 confocal and (E) the Shank2 STED image. C, Regions indicating the confocal puncta (red) were overlaid on the Shank2 confocal image to determine synaptic regions in the dendrite. F, Regions of the Shank2 STED puncta (blue) were overlaid on the Shank2 STED image to determine the PSD in the dendrite. G, The Shank2 STED mask was subtracted from the Shank2 confocal mask to provide a mask of the perisynaptic region. H, Overlay of the synapse (red) and the PSD (blue) regions. 1–6, Different zoomed in regions of the mask and red and blue region to clearly define the distinction in the subsynaptic compartments. Scale bar: 4.5 μm (A–H) and 1 μm (1–6). Download Figure 5-1, EPS file.
Extended Data Figure 5-2
Multiplicative scaling of Shank2 at the PSD. A, B, Comparison of the distribution of the area (A) of Shank 2 puncta (PSD area) and average intensity (B) of Shank2 per puncta using STED images from the control and TTX conditions showed scaling after a 48-h treatment (n = 2732 and 2442 synapses, for control and TTX dataset, respectively, p < 10−5 for area and p < 10 −6 for average intensity, KS test). C, A total of 1000 random average intensity data points were chosen, rank ordered, and plotted to provide a scaling equation (Y = 0.94*x + 22.31) for the density of Shank2 in the PSD. D, The scaling factor providing the maximum p value between control and scaled-TTX datasets was chosen as the multiplicative scaling factor (1.14, p = 0.067, KS test) for this repeat. Download Figure 5-2, EPS file.
In this issue


