

Article Figures & Data
Figures
- Figure 1.
Ex vivo and in vivo identification of GABA and DA neurons in the lateral VTA. A, The lateral VTA was identified as medial to the medial terminal nucleus of the accessory optic tract (mt) and lateral and rostral to the crest of medial lemniscus (ml). SNc = substantia nigra pars compacta; SNr = substantia nigra pars reticulata; ml = medial lemniscus; mt = medial terminal nucleus of accessory optic tract. B, VTA GABA neurons displayed fast spontaneous firing rates (>7 Hz) and lack of Ih. The firing rates of VTA GABA neurons were recorded in cell-attached configuration in passive voltage-follower mode. Ih was recorded in whole-cell configuration using voltage step protocol (−40 to −110 mV in 10-mV steps, 1.5-s duration, traces on B displayed for steps from −80 to −110). C, Neurobiotin-labeled VTA neurons with these electrophysiological properties were immunonegative for TH, consistent with a non-DA phenotype. D, Ex vivo patch clamp recordings of DA neurons were performed in the lateral VTA. Spontaneous firing rate of DA neurons was measured using the cell-attached configuration, and the whole-cell configuration was used to identify DA neurons electrophysiologically and histochemically on termination of the recording. E, VTA DA neurons displayed low spontaneous firing frequency (<5 HZ) and large Ih (>150 pA). F, Neurobiotin-labeled DA neurons with these electrophysiological properties were immuno-positive for TH (red stain). G, In vivo single-unit recordings of VTA DA neurons in anesthetized rats. Example traces for putative DA neurons showing low-frequency spontaneous firing (<10 Hz) and broad triphasic action potential (>3 ms). H, Putative DA neurons were inhibited by the D2-type receptor agonist quinpirole (0.25 g/kg). This effect was then reversed following the D2-type receptor antagonist eticlopride (0.25 g/kg).
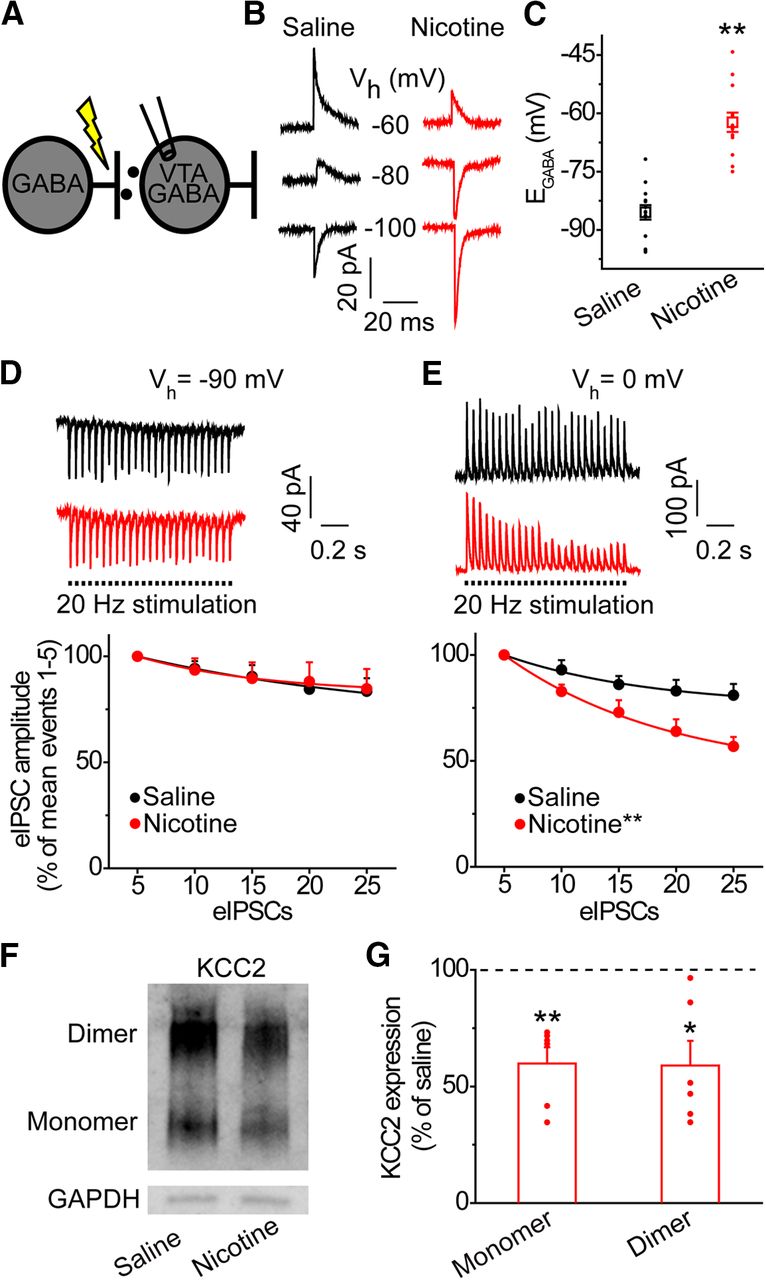
- Figure 2.
Acute nicotine exposure alters Cl− homeostasis in the VTA. A, GABAergic input onto VTA GABA neurons was measured using gramicidin perforated-patch whole-cell recordings at different holding potentials to measure nicotine-induced alterations in anion homeostasis. GABAA IPSCs were evoked by electrical stimulation in the presence of ionotropic glutamate and GABAB receptor antagonists. B, Representative eIPSC recordings from saline (black) and nicotine (red)-treated animals at the given holding potentials (Vh). The eIPSCs reverse direction at EGABA. For display, the traces were filtered, and stimulus artifacts were removed. C, VTA GABA neurons from nicotine-treated animals (red) showed a significantly more positive EGABA compared with saline-treated animals (black); **p < 0.01, significantly different by t test, n = 13, n = 14 cells/group, n = 7 rats/group. D, Activity-dependent synaptic depression in VTA GABA neurons was measured during whole-cell patch clamp recordings under repetitive GABAAR stimulation. Traces on top: representative GABA neurons from saline (black) and nicotine-treated rats (red) demonstrated a similar depression in eIPSC amplitude when stimulated at 20 Hz and clamped at −90 mV. Bottom graph, At −90 mV, VTA GABA neurons from control and stressed animals showed no significant difference in rate of eIPSC amplitude depression (p > 0.05, n = 8 cells, n = 4 rats for the nicotine group and n = 16 cells, n = 6 rats for the saline group). Amplitude values were averaged for five eIPSCs and shown as a percent of the first five eIPSCs mean amplitude. E, Cl− accumulation was measured as in D, but VTA GABA neurons were clamped at 0 mV. Top traces, Upon stimulation, VTA GABA neuron from control animal (black) demonstrated a minor depression of eIPSC amplitude compared with the significantly greater depression seen in a GABA neuron from a stressed animal (red). Bottom graph, At 0 mV, GABA neurons from nicotine treated animals (red) demonstrated a significantly greater rate of eIPSC amplitude depression than GABA neurons from saline-treated animals (black); **p < 0.01, significantly different by ANOVA with repeated measures, n = 8 cells, n = 4 rats for the nicotine group and n = 16 cells, n = 6 rats for the saline group. F, Western blot analysis was conducted for KCC2 protein expression with GAPDH as a loading control. A representative Western blotting shows reduced expression of KCC2 in nicotine-treated animals. G, Densiometric analysis showed a significant reduction in KCC2 protein in nicotine-treated animals (red bars) compared with saline-treated controls (horizontal dashed line); *p < 0.05, **p < 0.01, significantly different by paired t test, n = 6 animals/group.
- Figure 3.
Nicotine consumption impairs chloride homeostasis in the VTA. A, Rats consumed a nicotine-containing saccharin solution for 1 h/d over the course of 7 d. B, Mean nicotine consumption during 1 h daily free-access sessions. Rats consumed 0.15 ± 0.01 mg/kg nicotine on average over the 7 d of limited access, n = 11 rats. C, VTA GABA neurons from nicotine-drinking (red) rats displayed a significantly depolarized EGABA relative to saccharin-drinking (black) rats; **p < 0.01, significantly different by t test, n = 6, n = 8 cells/group, n = 3 rats/group. D, Western blot analysis revealed that nicotine-drinking produced a significant reduction in KCC2 expression in the VTA relative to saccharin drinking rats (horizontal dashed line); *p < 0.05 significantly different by paired t test, n = 6 animals/group.
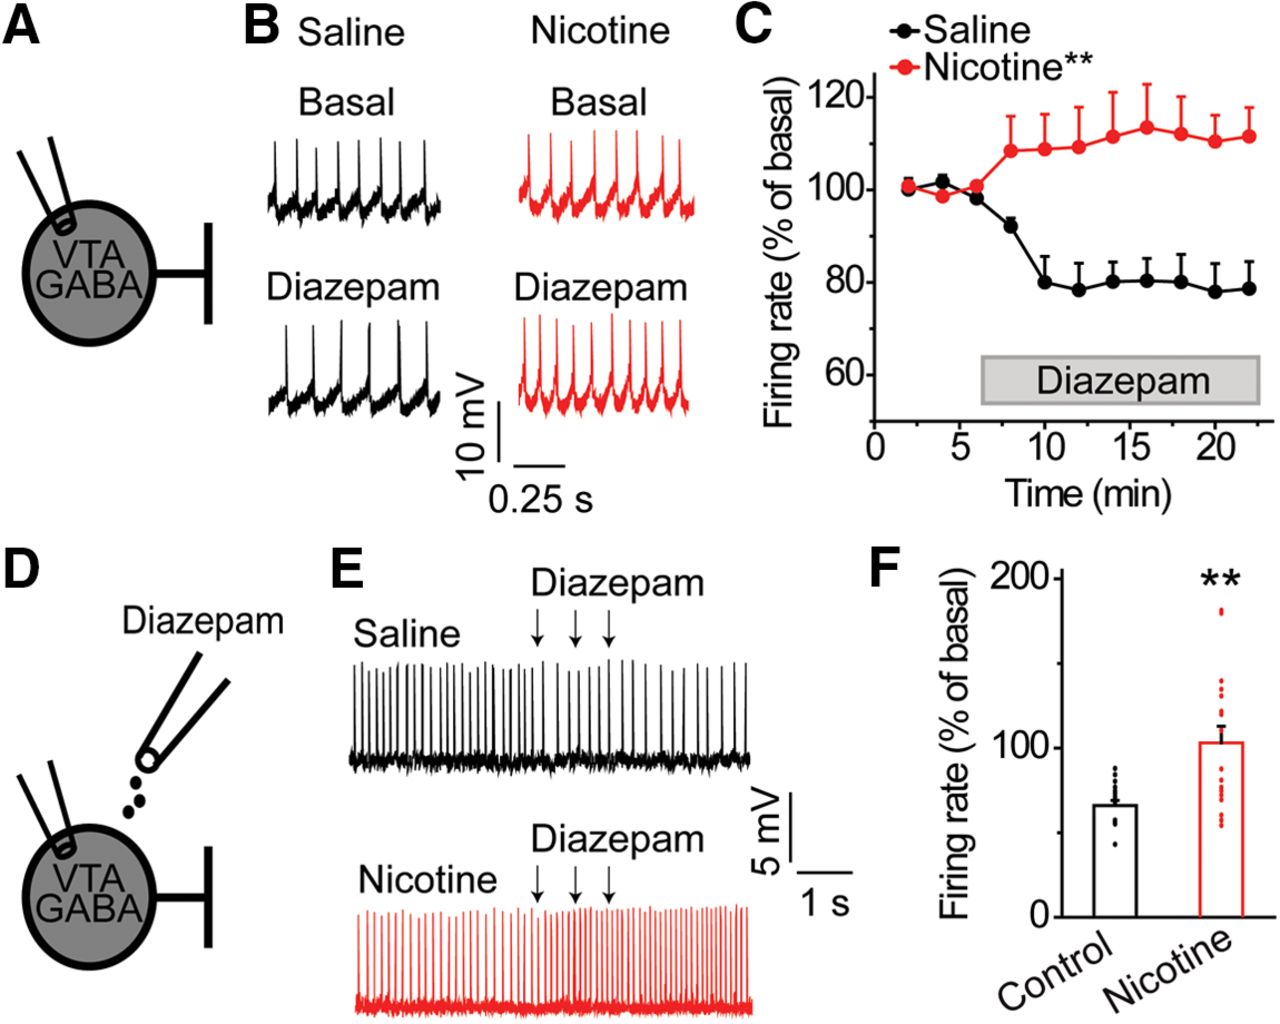
- Figure 4.
Diazepam increases the firing rate of VTA GABA neurons following acute nicotine exposure. A, Spontaneous firing rates of VTA GABA neurons were measured using the cell-attached configuration before and after bath application of diazepam. B, Representative recordings from VTA GABA neurons before and after bath administration of diazepam in the nicotine (red) and saline (black) groups. After nicotine pretreatment, bath applied diazepam increased GABA neuron firing rates in contrast to decreased firing in the saline group. C, In saline-treated controls, diazepam decreased the firing rate of VTA GABA neurons. In the nicotine-treated group, diazepam increased the firing rate of VTA GABA neurons; **p < 0.01, significantly different by ANOVA with repeated measures, n = 7, n = 8 cells/group, n = 4, n = 5 rats/group. D, Cell-attached recordings were performed on VTA GABA neurons to assess changes in firing in response to locally applied diazepam ex vivo. E, VTA GABA neurons from saline-treated animals (black) demonstrated a reduction in action potential firing when diazepam was focally puffed onto the recorded neuron. In contrast, VTA GABA neurons from nicotine-treated rats (red) often displayed enhanced firing to diazepam puff application. F, Focal puff application of diazepam decreased the firing rate of VTA GABA neurons in saline-treated controls. In nicotine-treated animals, puff-administered diazepam increased the firing rate of nearly half of all VTA GABA neurons recorded; **p < 0.01, significantly different by t test, n = 17 cells/group, n = 9, n = 11 rats/group.
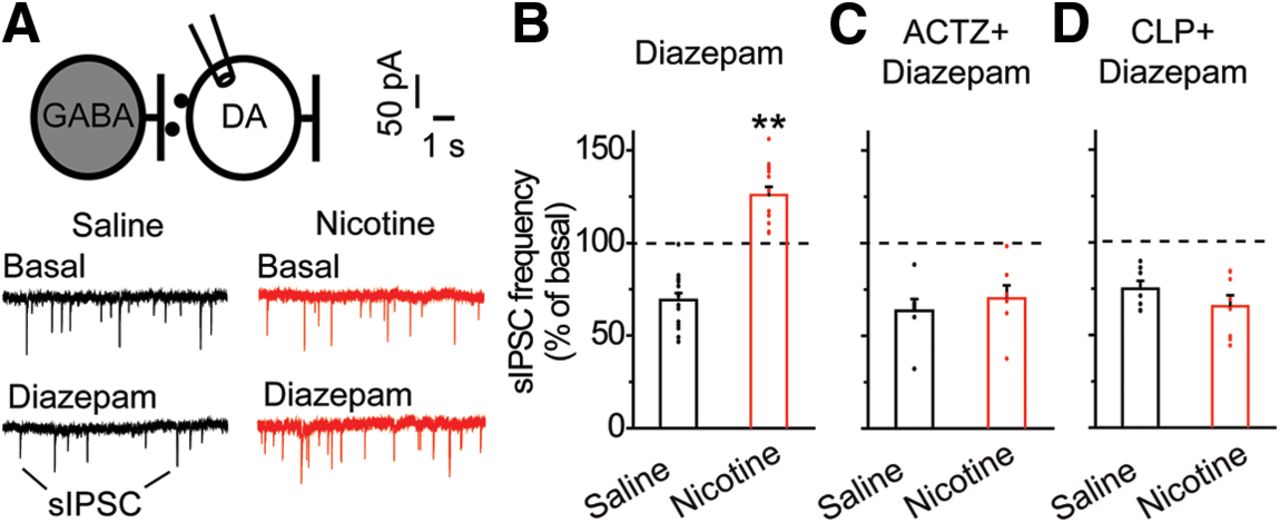
- Figure 5.
Acute nicotine exposure increases diazepam-induced GABA transmission onto VTA DA neurons. A, sIPSCs onto VTA DA neurons were recorded using the whole-cell patch clamp configuration. Shown are representative recordings of sIPSCs before and after diazepam administration in the nicotine-treated (red) and saline (black) groups. B, Mean changes in sIPSC frequency after bath application of diazepam in VTA DA neurons. DA neurons from saline-treated (black) rats displayed a reduction in sIPSC frequency on diazepam application. In contrast, DA neurons from nicotine-treated (red) animals showed a significantly increased diazepam-induced sIPSC frequency; **p < 0.01, significantly different by t test, n = 14, n = 15 cells/group, n = 6 rats/group. C, Following bath application of ACTZ, diazepam-induced sIPSC frequency in VTA DA neurons did not differ between saline-treated (black) and nicotine-treated (red) groups (p > 0.05, n = 7 cells/group, n = 3 rats/group). D, Following CLP290 incubation, no significant difference in diazepam-induced sIPSC frequency was noted among DA neurons from the saline (black) or nicotine (red) groups (p > 0.05, n = 7, n = 8 cells/group, n = 3, n = 4 rats/group).
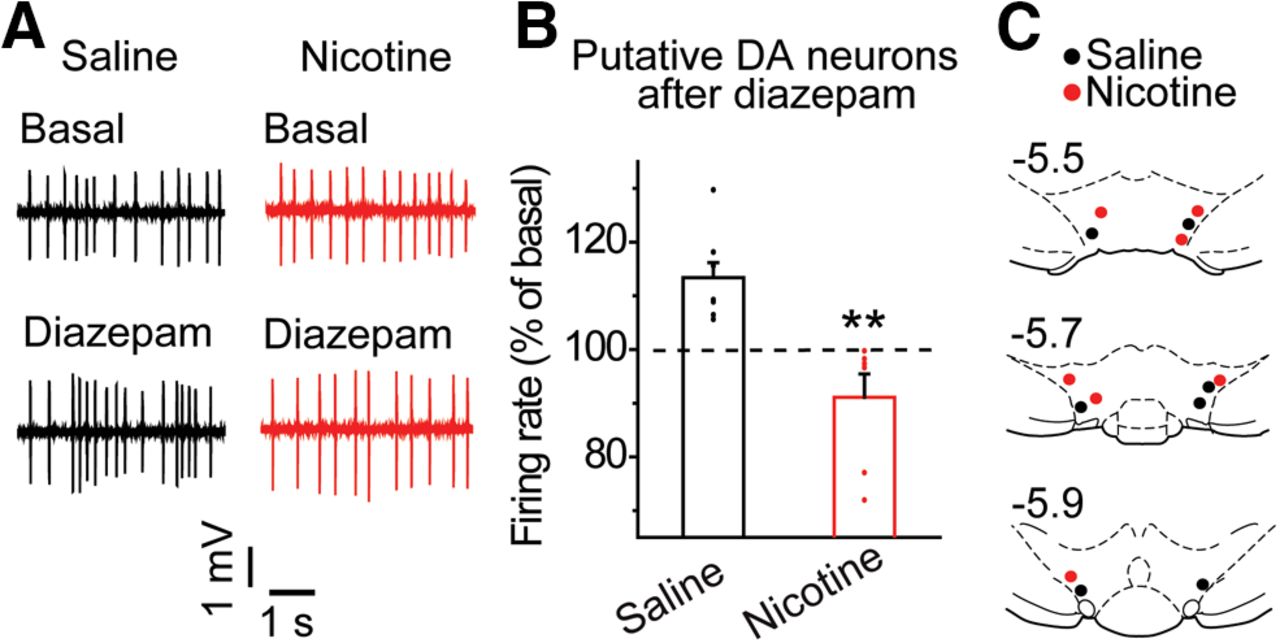
- Figure 6.
Acute nicotine exposure attenuates diazepam-induced VTA DA neuron firing rates in vivo. A, Representative in vivo recordings from putative DA neurons before and after diazepam administration (dose, i.v.) in the nicotine (red) and saline (black) groups. B, Diazepam increased the firing rate of putative DA neurons in the saline group (black) but failed to increase the firing rate of DA neurons in the nicotine group (red); **p < 0.01, significantly different by t test, n = 7 rats/group. C, Recording sites of putative DA neurons in the VTA for nicotine-treated (red) and saline-treated (black) animals.
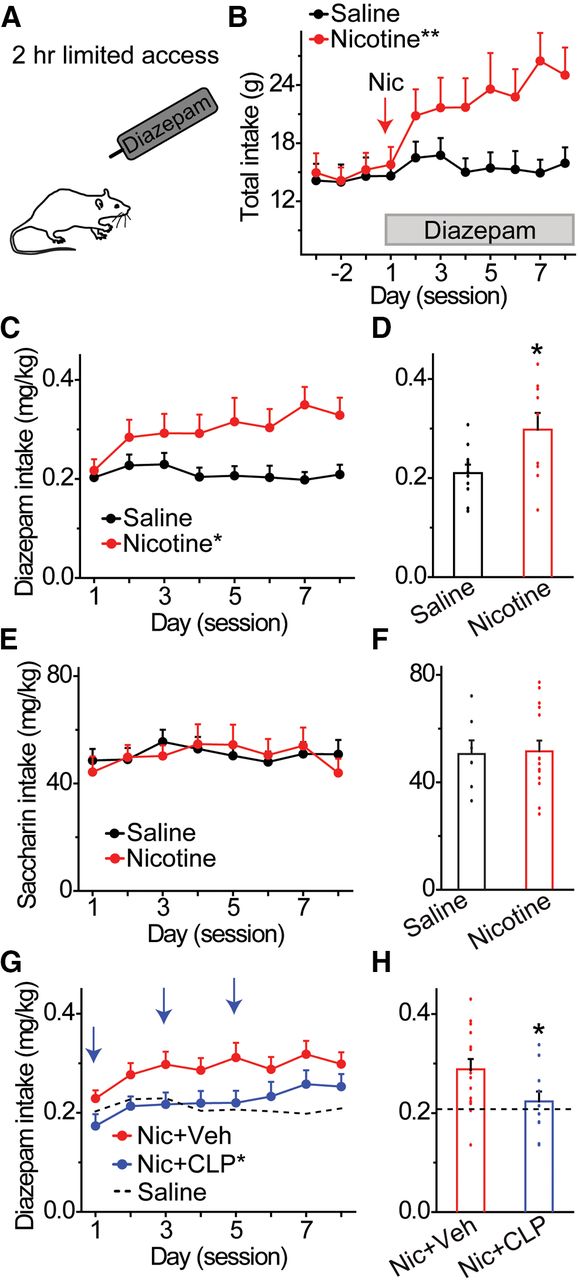
- Figure 7.
Increased diazepam consumption in nicotine-treated animals is reduced by KCC2 activation. A, Animals consumed saccharin during daily 2-h sessions prior to adding diazepam in the drinking solution. Rats received an acute injection of nicotine or saline 7 h before the first diazepam drinking session. B, Daily fluid intake was measured in saline and nicotine-treated rats. Nicotine-treated rats showed greater daily intake compared with saline-treated controls; **p < 0.01, significantly different by ANOVA with repeated measures. C, Time course of mean daily diazepam intake for 8 d, following acute injection of nicotine (red) or saline (black); *p < 0.05, significantly different by ANOVA with repeated measures. D, Rats receiving a single injection of nicotine (red) consumed significantly more diazepam (mg/kg) across 8 d than rats receiving a saline injection (black); *p < 0.05, significantly different from the control group by t test, n = 10 rats/group. E, Effects of nicotine or saline pretreatment on daily saccharin intake (mg/kg), in the absence of diazepam. Nicotine-treated animals (red) showed similar saccharin intake compared with saline-treated controls (black) for 8 d after injection. F, Effects of nicotine and saline pretreatment on mean saccharin intake. Rats receiving a single injection of nicotine (red) or saline (black) consumed similar amounts of saccharin (mg/kg) across 8 d. G, Effects of CLP290 on daily diazepam intake. Vehicle (red data) or CLP290 (blue data) was injected intraperitoneally 45 min prior to diazepam drinking on non-consecutive days (blue arrows). Nicotine-pretreated animals injected with CLP290 showed significantly reduced diazepam consumption compared with nicotine-injected rats treated with vehicle. Diazepam consumption in saline-treated control rats is shown for comparison (dotted line); *p < 0.05, significantly different from the nicotine vehicle group by ANOVA with repeated measures. H, Effects of CLP290 on mean diazepam intake over the 8-d drinking period. Animals pretreated with nicotine and CLP290 showed significantly reduced ethanol consumption compared with nicotine and vehicle-treated rats. Diazepam consumption in saline vehicle-treated control rats is shown for comparison (dotted horizontal line); *p < 0.05, significantly different from the nicotine vehicle group by t test, n = 11, n = 15 rats/group.


Tables
Data structure Type of test p value Effect size Power a Normal t test 0.000 3.438 1.000 b Normal t test 7.039 × 10⁻⁸ 3.362 1.000 c Normal t test 0.245 0.582 0.307 d Normal ANOVA repeated measures 0.736 0.022 0.164 e Normal ANOVA repeated measures 0.000 0.357 1.000 f Normal Paired t test 0.006 1.848 0.946 g Normal Paired t test 0.033 1.196 0.652 h Normal t test 0.000 3.430 1.000 i Normal Paired t test 0.047 1.069 0.559 j Normal Paired t test 0.049 1.056 0.549 k Normal t test 0.137 0.816 0.440 l Normal ANOVA repeated measures 0.000 0.449 1.000 m Normal t test 0.001 1.232 0.936 n Normal t test 0.817 0.085 0.056 o Normal t test 0.965 0.016 0.050 p Normal t test 0.000 3.869 1.000 q Normal t test 0.674 0.123 0.062 r Normal t test 0.491 0.379 0.100 s Normal t test 0.232 0.826 0.315 t Normal t test 0.926 0.133 0.056 u Normal t test 0.001 2.202 0.965 v Normal ANOVA repeated measures 0.000 0.265 1.000 w Normal ANOVA repeated measures 0.029 0.252 0.616 x Normal t test 0.029 1.617 0.912 y Normal ANOVA repeated measures 0.940 0.000 0.051 z Normal t test 0.940 0.034 0.051 aa Normal ANOVA repeated measures 0.040 0.165 0.551 bb Normal t test 0.040 0.802 0.491 Effect sizes and power were calculated with G*Power 3.1.
In this issue


