

Article Figures & Data
Figures
- Figure 1.
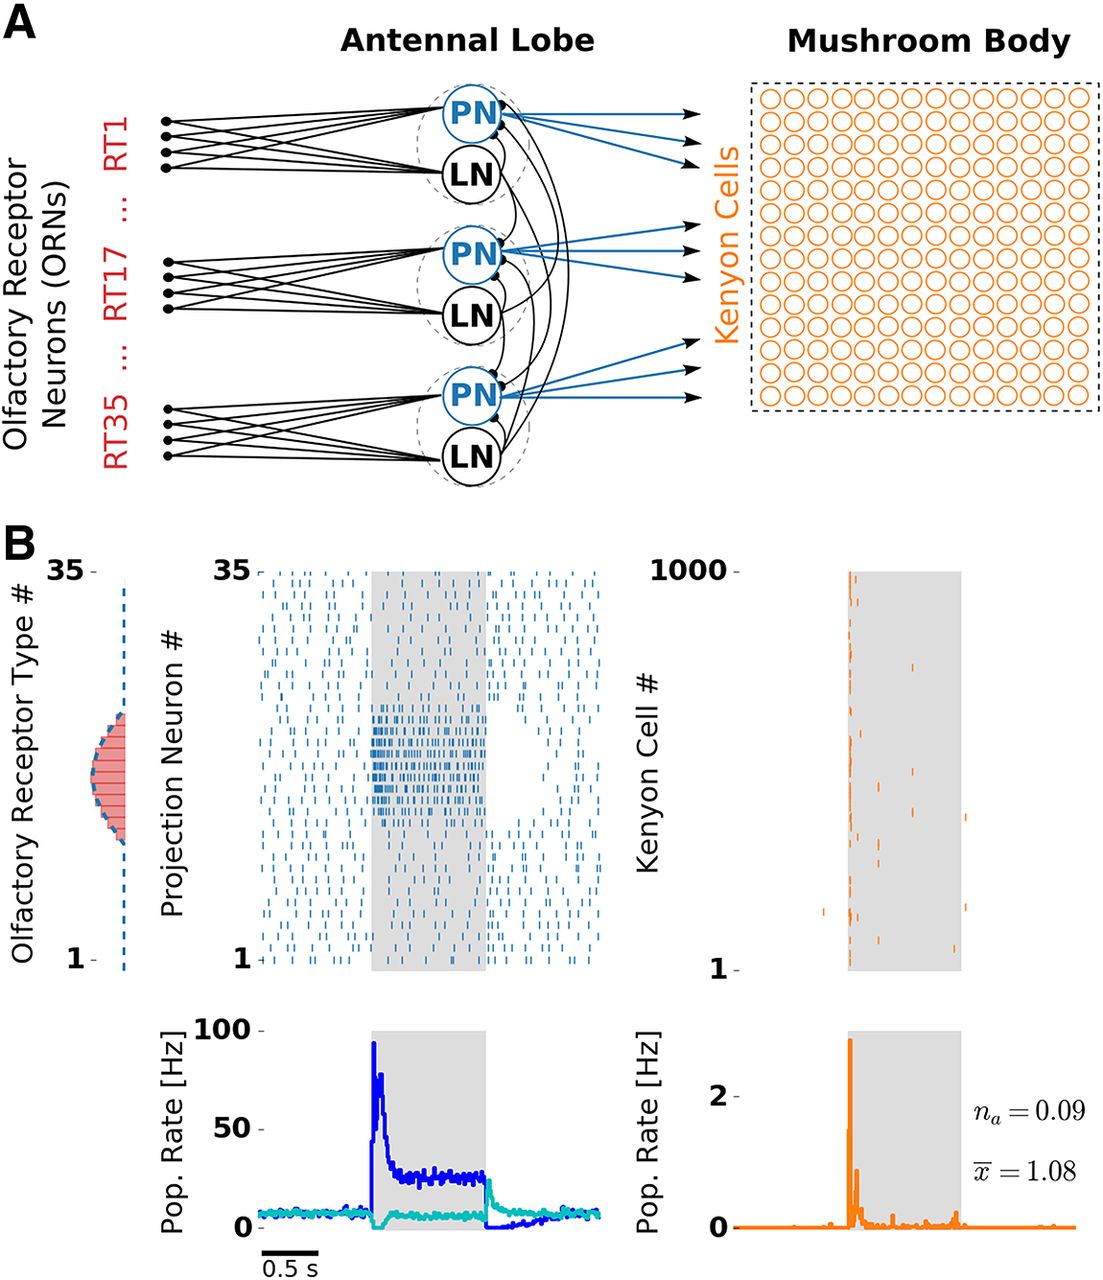
Olfactory network model structure and odor response. A, Network structure resembles the insect olfactory pathway with three main processing stages. In each glomerulus (dashed circles), a PN (blue) and a LN receive convergent ORN input (red) by one receptor type (RT). Each LN provides unspecific lateral inhibition to all PNs. KCs (orange) receive on average 12 inputs from randomly chosen PNs. B, Receptor response profile (red bars, AL input) depicts the evoked firing rate for each ORN type. Evoked PN spike counts (dashed blue line, AL output) follow the ORN activation pattern. Raster plots depict single-trial responses of PNs (blue) and KCs (orange). Presentation of an odor during 1000 ms is indicated by the shaded area. Population (Pop.) firing rates were obtained by averaging over 50 trials. PN spikes display a temporal structure that includes evoked transient responses at stimulus onset and offset, and a pronounced inhibitory postodor response. The PN population rate was averaged over PNs showing on responses (blue) and off responses (cyan). KC spikes were temporally sparse with the majority of the spikes occurring at the stimulus onset. Extended Data Figure 1-1 and Extended Data Figure 1-2 show odor responses with adaptation disabled in the KC and PN population, respectively.
- Figure 2.
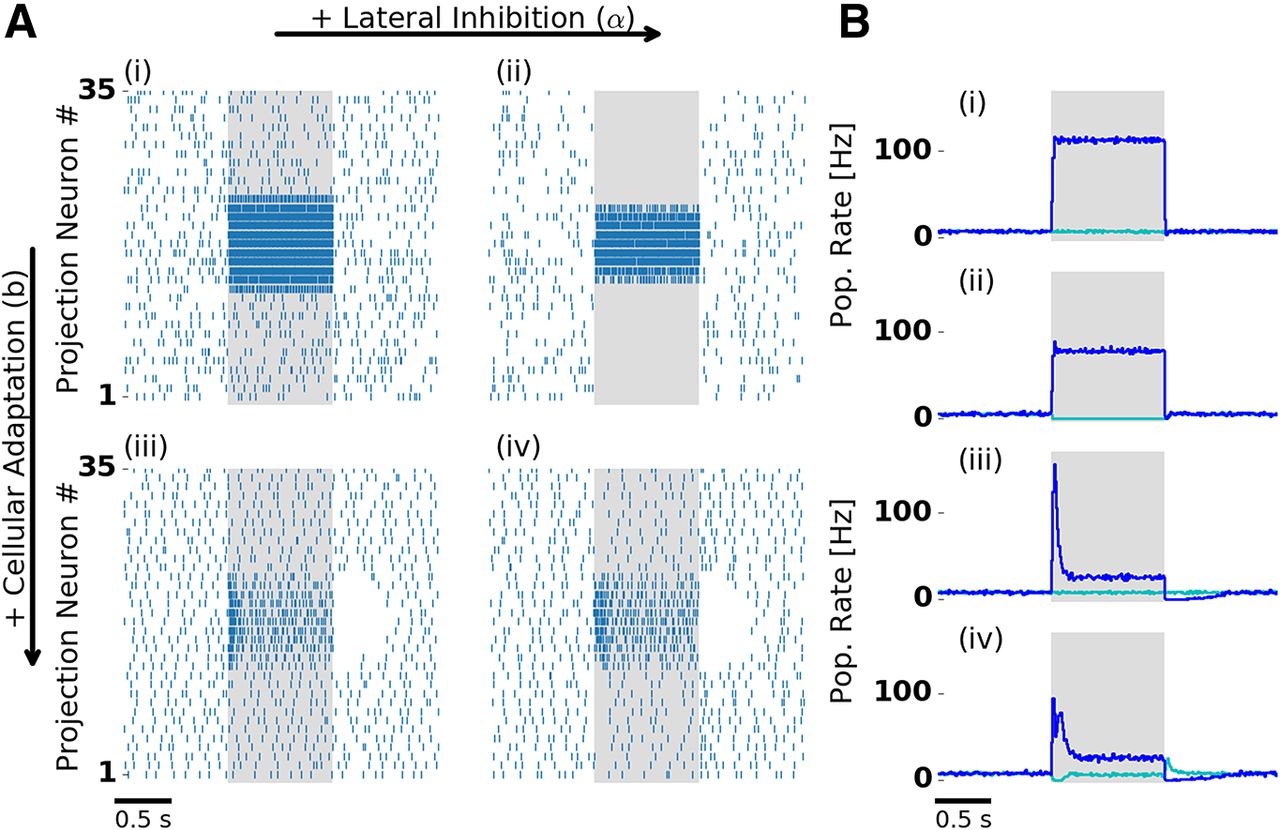
Lateral inhibition and cellular adaptation shape PN odor response dynamics. A, Single-trial PN spiking responses simulated with (right column) and without (left column) lateral inhibition, and with (bottom row) and without (top row) adaptation. Presentation of a single odor during 1000 ms is indicated by the shaded area. With adaptation, PNs display a temporal structure that includes a transient and a tonic response, and a pronounced inhibitory postodor response. B, Trial-averaged population firing rate: PNs driven by stimulation (blue) and remaining PNs (cyan). Bi–iv indicate the presence and absence of lateral inhibition and adaptation, as in A. In the presence of lateral inhibition, firing rates during stimulation are reduced. In the presence of lateral inhibition and adaptation (Aiv, Biv) PNs show either transient on responses (blue) or off responses (cyan). Aiv and Biv are reproduced in Figure 1B. Extended Data Figure 2-1 shows PN tuning profiles and input–output relation.
- Figure 3.
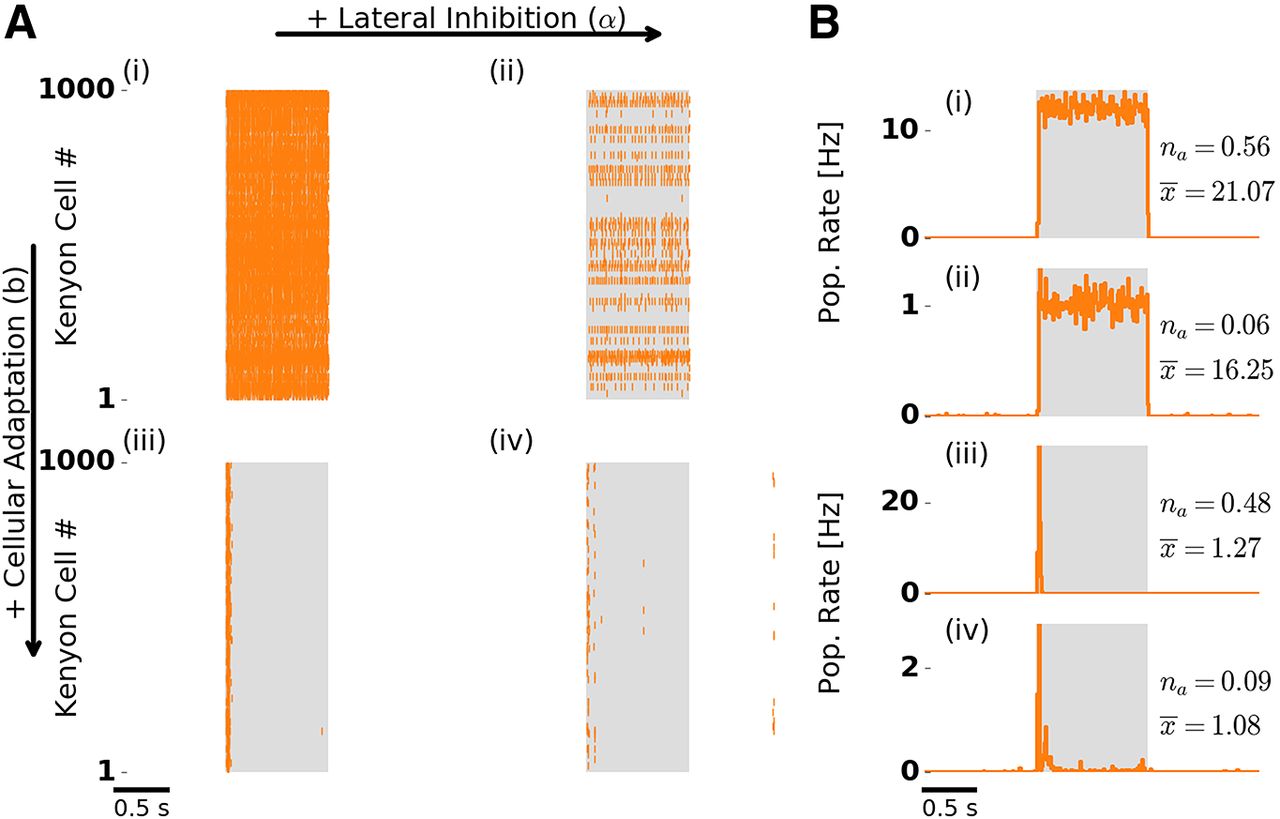
Odor response dynamics of the KC population. Figure layout is as in Figure 2. A, Single-trial population spike raster responses. B, Trial-averaged KC population firing rate. Numbers to the right indicate the fraction of activated KCs (na ) and the mean number of spikes per activated KC during stimulation (
- Figure 4.
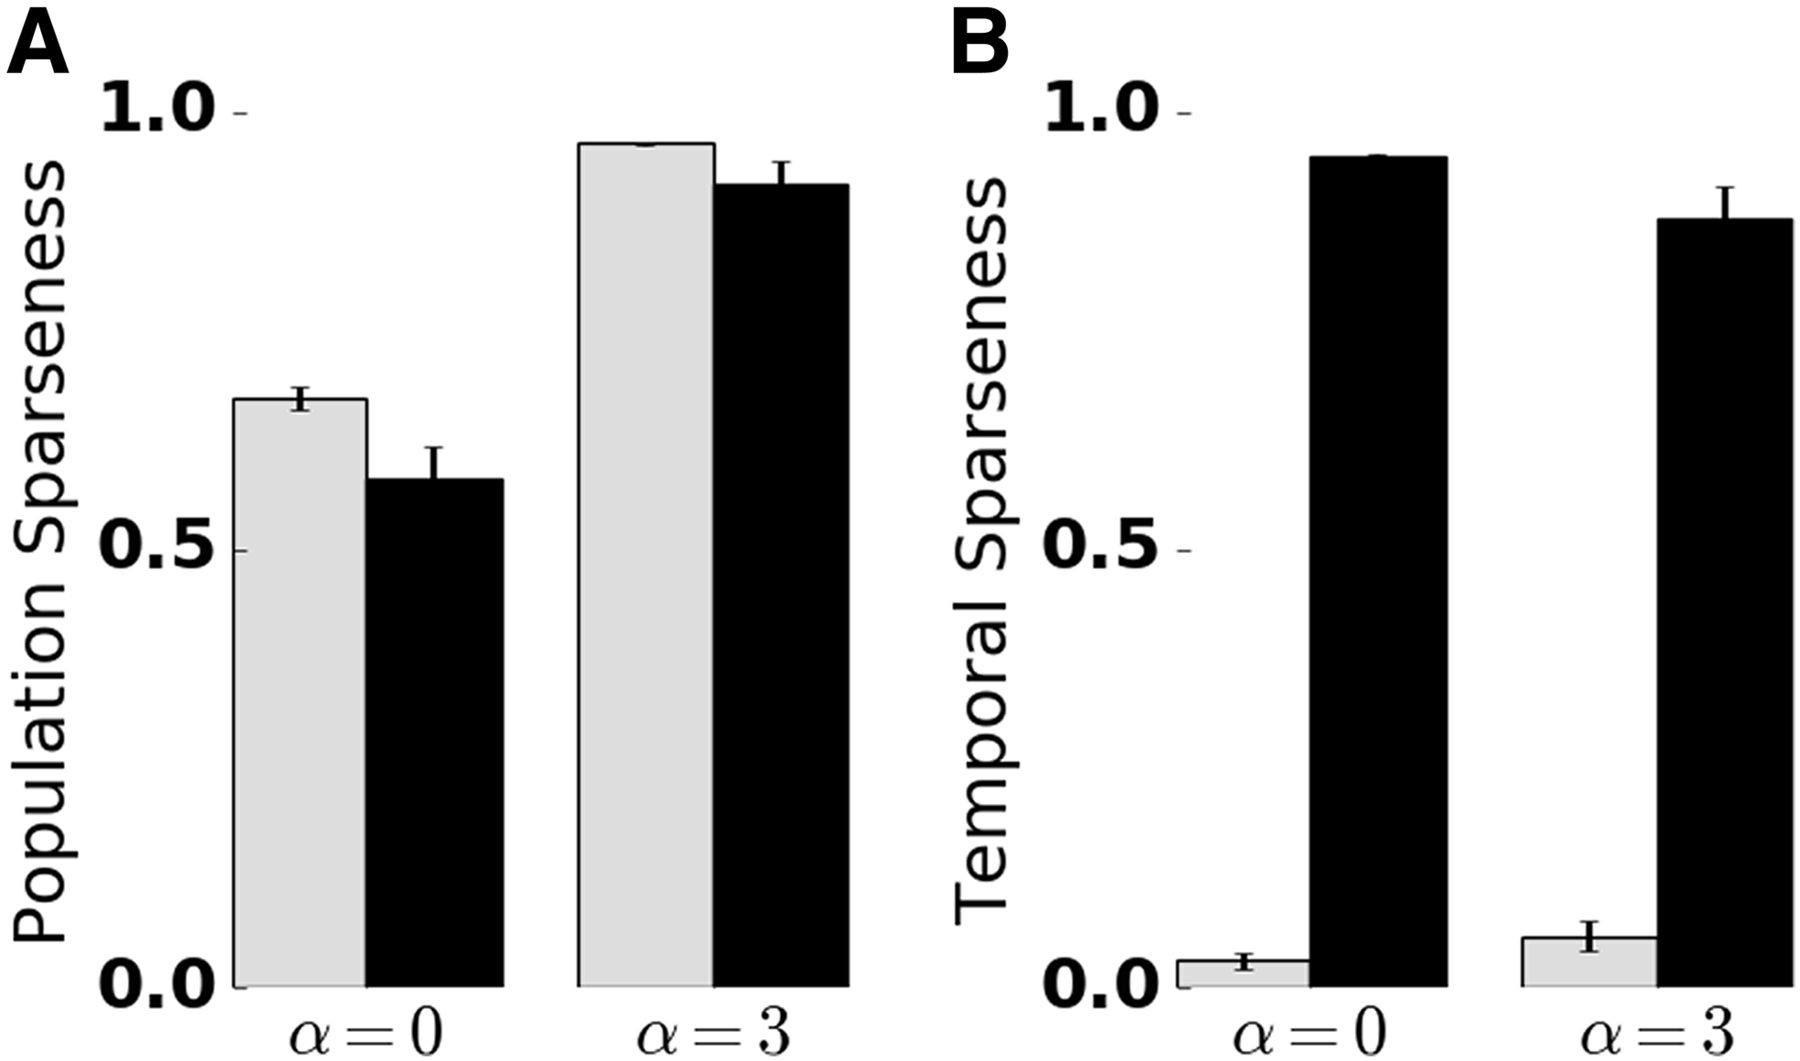
Quantification of temporal and population sparseness in the KC population. Sparseness was measured in the absence (α = 0) and presence (α = 3) of lateral inhibition, and the presence (black bars) and absence (gray bars) of SFA. The sparseness measure was averaged over 50 trials. Error bars indicate SD. A value of 1 corresponds to maximally sparse responses. A, Adaptation promotes temporal sparseness. B, Lateral inhibition in the AL promotes KC population sparseness. Extended Data Figure 4-1 shows temporal sparseness when SFA was disabled in the PN or KC population, and population sparseness for different numbers of PN inputs per KC.
- Figure 5.
Lateral inhibition in the AL facilitates population sparseness and reduces pattern correlation in the MB. Spike counts (single trial) of 900 randomly selected KCs in response to two similar odors (“Odor A” and “Odor B”) arranged on a 30 × 30 grid in the absence (top row) and in the presence (bottom row) of lateral inhibition. Inactive KCs are shown in black. A, In the absence of lateral inhibition, KCs readily responded to both odors, resulting in an activation pattern where most KCs are active. In the presence of lateral inhibition both odors evoked sparse KC activation patterns. B, Superposition of responses to the two odors. KCs that were activated by both odors are indicated by hot colors (color bar denotes the spike count of the stronger response). KCs that were activated exclusively by one of the two odors are indicated in gray. The fraction of KCs that show overlapping responses is reduced in the presence of lateral inhibition. C, Pattern correlation between the single-trial responses in A to the two odors obtained for PN (blue) and KC (orange) spikes counts, in the absence (α = 0) and presence (α = 3) of lateral inhibition. Dashed line indicates pattern correlation of the input (ORNs). Pattern correlation was retained at the AL and was reduced at the MB level. Lateral inhibition in the AL reduced pattern correlation in KCs, but not in PNs.
- Figure 6.
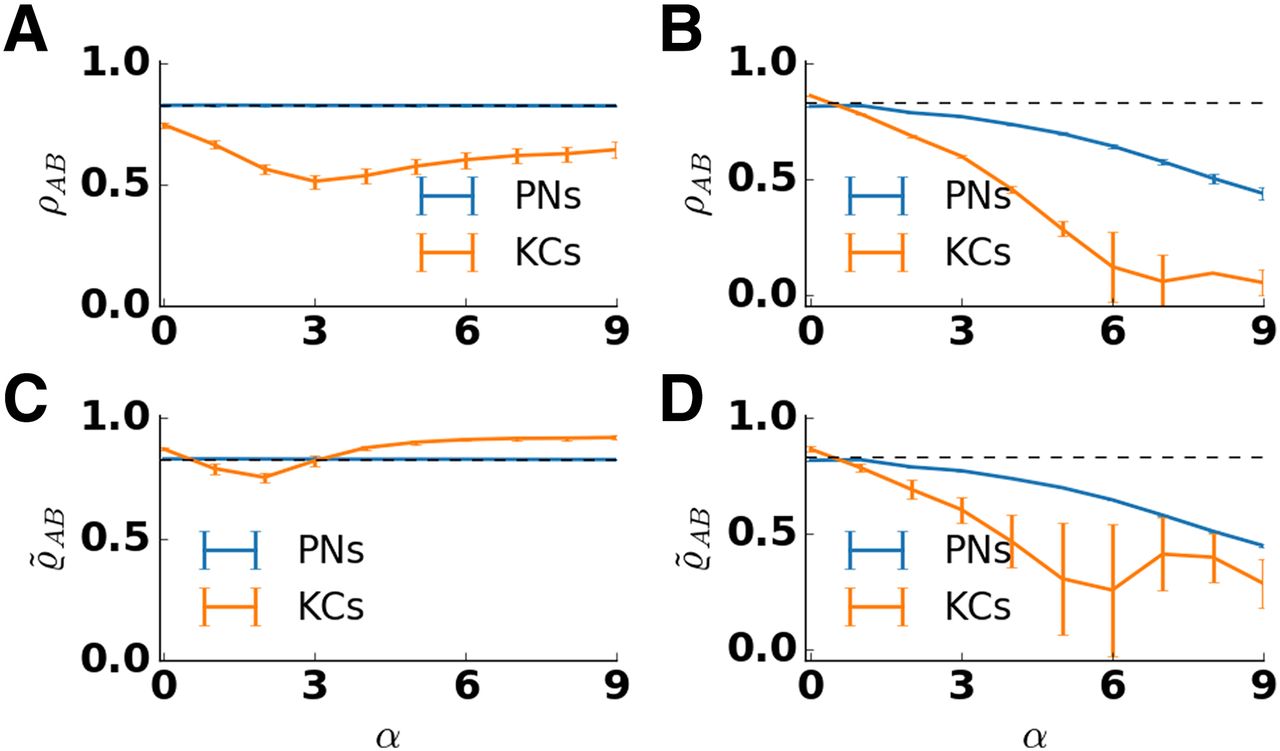
Pattern correlation in the antennal lobe and the mushroom body depend on lateral inhibition strength α. The correlation coefficient ρAB between the response patterns to two similar odors was calculated and averaged over 50 trials and five network realizations for PNs (blue) and KCs (orange). Error bars indicate SD over trials and network realizations. Pattern correlation of the input is indicated by the dashed line. Input correlation is high because similar odors activate largely overlapping set of receptors. A, In the presence of adaptation, pattern correlation in PNs (blue) stays close to the input correlation for all values of lateral inhibition strength. In KCs (orange), the correlation decreases for small values of lateral inhibition strength and increases for large values of lateral inhibition strength. Pattern correlation in KCs is minimal for α = 3. B, In the absence of adaptation, pattern correlation decreases with the lateral inhibition strength both in PNs and KCs. The decrease is stronger in KCs. C, D, Pattern correlation
- Figure 7.
Decoding of odor identity indicates a prolonged and reliable odor information in KC adaptation currents. A, B, D, Decoding accuracy was calculated for nonoverlapping 50 ms time bins, based on a set of seven stimuli (chance level, ∼0.14) presented for 1 s (shaded area). Blue shading indicates SD obtained from a cross-validation procedure (see Materials and Methods). A, Decoding of odor identity from PN spike counts. Decoding accuracy peaks at odor onset and offset, and remains high after stimulation. B, Decoding of odor identity from KC spike counts. Decoding accuracy is above chance only in the first three bins following stimulus onset. C, Adaptation current amplitudes (single trial, hot colors in arbitrary units) of 100 selected KCs in response to “odor A” (top) and “odor B” (bottom). D, Decoding of odor identity from KC adaptation currents. Decoding accuracy peaks 150 ms after odor onset then drops during stimulation, but remains high and is sustained after odor offset.


Tables
- Table 1
Synaptic weights for wOL (ORN-LN), wOP (ORN-PN), wLP (LN-PN), and wPK (PN-KC) connections in different simulation conditions (i–iv)
i ii iii iv wOL 1 nS 1 nS 1 nS 1 nS wOP 1 nS 1.12 nS 1 nS 1.12 nS wLP 0 nS 3 nS 0 nS 3 nS wPK 5 nS 5 nS 5 nS 5 nS Neuron parameters Membrane capacitance cm 289.5 pF Leak conductance gL 28.95 nS Leak potential EL −70 mV Reset potential VR −70 mV Threshold potential VT −57 mV Refractory time τref 5 ms Synaptic parameters Base synaptic weight w0 1 nS PN-KC synaptic weight wPK 5 nS Excitatory synaptic potential EE 0 mV Excitatory time constant τE 2 ms Inhibitory synaptic potential EI −75 mV Inhibitory time constant τI 10 ms Adaptation parameters Spike-triggered current 0.132 nA Adaptation time constant τA 389 ms Adaptation current variance 87.1 pA2
Figure 1-1
Odor response with selective adaptation in the LN and the PN population. Strong phasic PN input elicits phasic KC responses. High KC firing threshold ensures sparse responses in the absence of SFA in the KC population. Download Figure 1-1, TIF file.
Figure 1-2
Odor response with selective adaptation in the LN and the KC population. The absence of SFA in the PN population was compensated by a constant current I0 = 0.38 nA. PNs show a constant population rate response with a slightly delayed onset due to inhibition by LNs. KCs show a strong onset population rate response and a nonzero tonic firing rate. Download Figure 1-2, TIF file.
Figure 2-1
A, B, In the absence of adaptation (A, B), lateral inhibition (B) sharpens the PN tuning profile (blue). C, D, In the presence of adaptation, the PN tuning profile is not affected by lateral inhibition. The tuning profile was obtained by averaging PN firing rates during the 1 s stimulation window and across 50 trials. PNs receive input from ORNs of the corresponding type according to the receptor response profile. The receptor response profile (gray), rescaled between the minimum and maximum PN firing rates, is shown in all panels for comparison. The insets show the input–output relation between the ORN and the PN firing rates. Both averaged (blue line) and single-trial (gray crosses) PN firing rates are shown. Download Figure 2-1, TIF file.
Figure 4-1
A, Temporal sparseness with SFA presence in selected populations. Black: PNs, LNs, and KCs. White dashed: LNs and KCs. White: LNs and PNs. Gray bars indicate simulation in the complete absence of SFA. B, Population sparseness depends on the mean number of PN inputs per KC k, both in the absence (α = 0, left) and presence (α = 3) of lateral inhibition. In comparison with the default number of PN inputs (k = 12, black bars), reducing the mean number of connections to k = 9 (white dashed bars) increased population sparseness, whereas increasing the mean number of connections to k = 15 (white bars) decreased population sparseness. The gray bar corresponds to k = 12 in the absence of SFA and is given for reference. Download Figure 4-1, TIF file.
Figure 6-1
Mean fraction of activated KCs for different strengths of lateral inhibition. We obtained the fraction of activated KCs by counting KCs that have fired at least one spike during one of the given epochs: 1 s of stimulation, 1 s of spontaneous activity, and the first 50 ms after stimulus onset (transient response). A, In the presence of spike frequency adaptation the mean fraction of activated KCs during evoked activity (blue) shows a minimum for the intermediate strength of lateral inhibition. At the minimum, ∼10% of the KCs responded to the stimulus. This fits well with the experimentally reported values in the range of 5–11% (Turner et al., 2008; Honegger et al., 2011). B, In the absence of spike frequency adaptation, the mean fraction of activated KCs decreases with lateral inhibition during evoked activity (blue). Note that for α > 4 the fraction of responding KCs is close to zero or is zero. In the absence of spike frequency adaptation, and higher strengths of inhibition, KCs do not receive strong enough inputs to spike. Download Figure 6-1, TIF file.
Figure 6-2
Mean pairwise PN cross-correlation for different strengths of lateral inhibition. For each PN, a vector obtained by binning the corresponding spike train into 50 ms windows was calculated. Pairwise correlation between the vectors was calculated and averaged over all PN pairs and 50 trials. Download Figure 6-2, TIF file.
In this issue


