

Abstract
Transformations between sensory representations are shaped by neural mechanisms at the cellular and the circuit level. In the insect olfactory system, the encoding of odor information undergoes a transition from a dense spatiotemporal population code in the antennal lobe to a sparse code in the mushroom body. However, the exact mechanisms shaping odor representations and their role in sensory processing are incompletely identified. Here, we investigate the transformation from dense to sparse odor representations in a spiking model of the insect olfactory system, focusing on two ubiquitous neural mechanisms: spike frequency adaptation at the cellular level and lateral inhibition at the circuit level. We find that cellular adaptation is essential for sparse representations in time (temporal sparseness), while lateral inhibition regulates sparseness in the neuronal space (population sparseness). The interplay of both mechanisms shapes spatiotemporal odor representations, which are optimized for the discrimination of odors during stimulus onset and offset. Response pattern correlation across different stimuli showed a nonmonotonic dependence on the strength of lateral inhibition with an optimum at intermediate levels, which is explained by two counteracting mechanisms. In addition, we find that odor identity is stored on a prolonged timescale in the adaptation levels but not in the spiking activity of the principal cells of the mushroom body, providing a testable hypothesis for the location of the so-called odor trace.
- efficient coding
- lateral inhibition
- odor trace
- sensory processing
- spike frequency adaptation
- spiking neural network
Significance Statement
In trace conditioning experiments, insects, like vertebrates, are able to form an associative memory between an olfactory stimulus and a temporally separated reward. Forming this association requires a prolonged odor trace. However, spiking responses in the mushroom body, the principal site of olfactory learning, are brief and bound to the odor onset (temporal sparseness). We implemented a spiking network model that relies on spike frequency adaptation to reproduce temporally sparse responses. We found that odor identity is reliably encoded in neuron adaptation levels, which are mediated by spike-triggered calcium influx. Our results suggest that a prolonged odor trace is established in the calcium levels of the relevant neuronal population. This prediction has found recent experimental support in the fruit fly.
Introduction
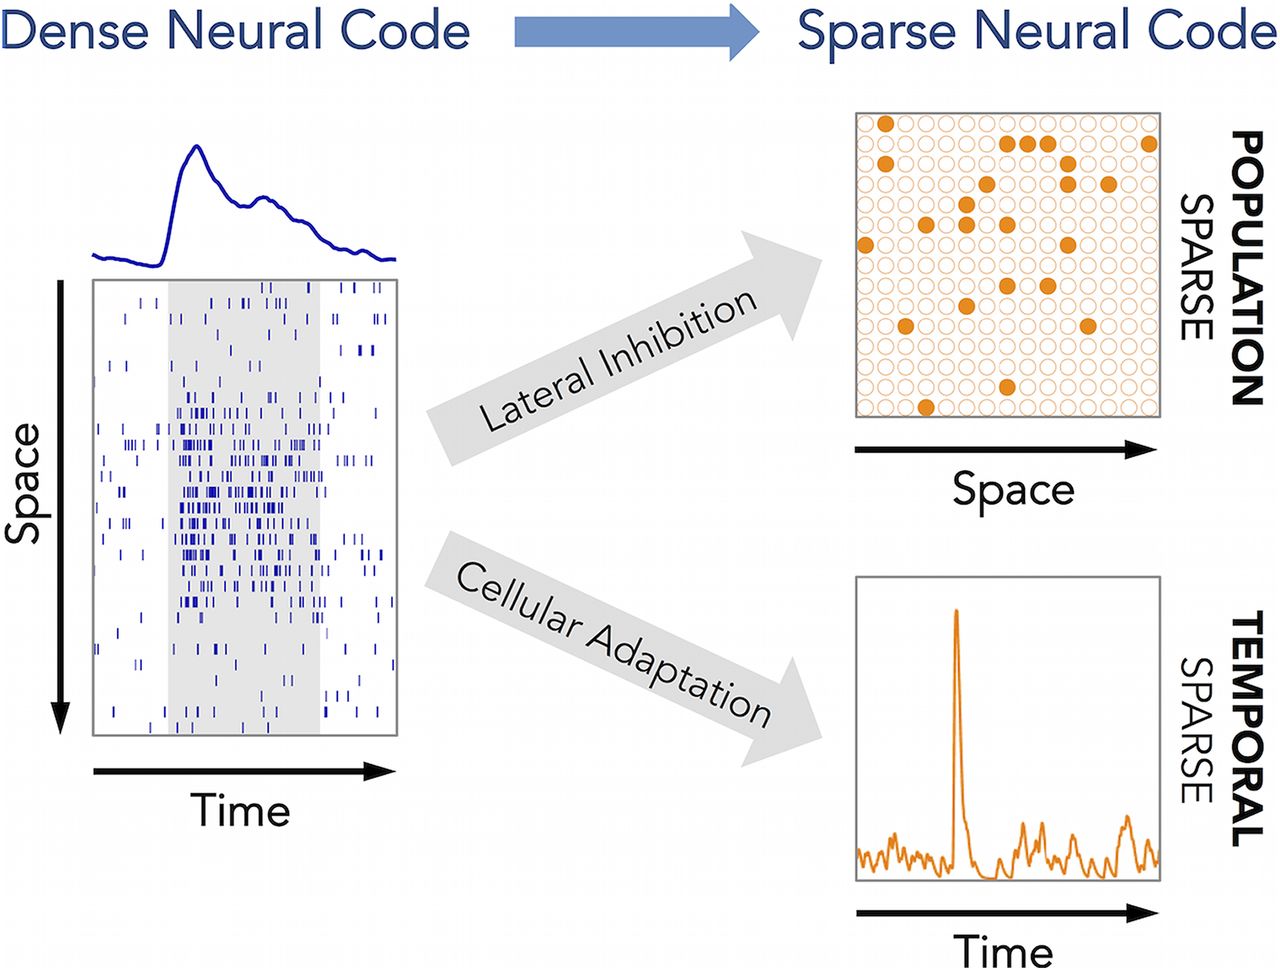
How nervous systems process sensory information is a key issue in systems neuroscience. Animals are required to rapidly identify behaviorally relevant stimulus features in a rich and dynamic sensory environment, and neural computation in sensory pathways is tailored to this need. Sparse stimulus encoding has been identified as an essential feature of sensory processing in higher brain areas in both invertebrate (Perez-Orive et al., 2002; Szyszka et al., 2005; Ito et al., 2008; Turner et al., 2008; Honegger et al., 2011) and vertebrate (Vinje and Gallant, 2000; Hromádka et al., 2008; Isaacson, 2010; Wolfe et al., 2010) systems. Sparse representations provide an economical means of neural information coding (Laughlin and Sejnowski, 2003; Faisal et al., 2008) where information is represented by only a small fraction of all neurons (population sparseness) and each activated neuron generates only few action potentials (temporal sparseness) for a highly specific stimulus configuration (lifetime sparseness; Kloppenburg and Nawrot, 2014).
The nervous systems of insects have limited neuronal resources and thus require particularly efficient coding strategies. The insect olfactory system is analogue to the vertebrate olfactory system and has become a popular model system for the emergence of a sparse code. We use a computational approach to study the transformation from a dense olfactory code in the sensory periphery to a sparse code in the mushroom body (MB), a central structure of the insect brain important for multimodal sensory integration and memory formation. A number of recent studies emphasized the role of sparse coding in the MB. In locusts, sparse responses were shown to convey temporal stimulus information (Gupta and Stopfer, 2012). In Drosophila, sparse coding was found to reduce overlap between odor representations and facilitate their discrimination (Lin et al., 2014). Consequently, sparse coding is an essential feature of plasticity models for olfactory learning in insects (Huerta and Nowotny, 2009; Wessnitzer et al., 2012; Ardin et al., 2016; Peng and Chittka, 2016; Müller et al., 2018), and theoretical work has emphasized the analogy of the transformation from a dense code in projection neurons (PNs) to a sparse code in Kenyon cells (KCs) with dimensionality expansion in machine learning methods (Huerta and Nowotny, 2009; Mosqueiro and Huerta, 2014; Schmuker et al., 2014).
Central to our modeling approach are two fundamental mechanisms of neural computation that are ubiquitous in the nervous systems of invertebrates and vertebrates. Spike frequency adaptation (SFA) is a cellular mechanism that has been suggested to support efficient and sparse coding and to reduce the variability of sensory representation (Benda and Herz, 2003; Farkhooi et al., 2011, 2013). Lateral inhibition is a basic circuit design principle that exists in different sensory systems, mediates contrast enhancement, and facilitates stimulus discrimination (Kuffler, 1953; Hartline et al., 1956; Fuchs and Brown, 1984; Oswald et al., 2006). Both mechanisms are evident in the insect olfactory system. Responses of olfactory receptor neurons (ORNs), local interneurons (LNs), and PNs in the antennal lobe (AL) show stimulus adaptation (Bhandawat et al., 2007; Krofczik et al., 2009; Nagel and Wilson, 2011), and strong adaptation currents have been identified in KCs (Wüstenberg et al., 2004; Demmer and Kloppenburg, 2009). Lateral inhibition in the AL is mediated by inhibitory LNs (Wilson, 2013). It is crucial for establishing the population code at the level of PNs (Wilson et al., 2004; Krofczik et al., 2009; Olsen et al., 2010), for gain control (Stopfer et al., 2003; Olsen and Wilson, 2008), for decorrelation of odor representations (Wilson and Laurent, 2005), and for mixture interactions (Krofczik et al., 2009; Deisig et al., 2010; Capurro et al., 2012).
Together, we find that lateral inhibition and SFA account for the transformation from a dense to sparse coding, decorrelate odor representations, and facilitate precise temporal responses on short and long timescales.
Materials and Methods
Spiking network model
A spiking network model with three layers (ORN, AL, and MB; Fig. 1A) was simulated using Brian 1.4 (Goodman and Brette, 2009). The model includes 35 ORN types, 284 ORNs per type, 35 PNs and LNs, and 1000 KCs. Each of the 35 LN–PN pairs constitutes a glomerulus. Across insect species, the number of glomeruli varies from a few tens to several hundred, and we based our model on the lower end of this range. The ratio between the numbers of PNs and KCs is approximately based on the data available in Drosophila (Turner et al., 2008).
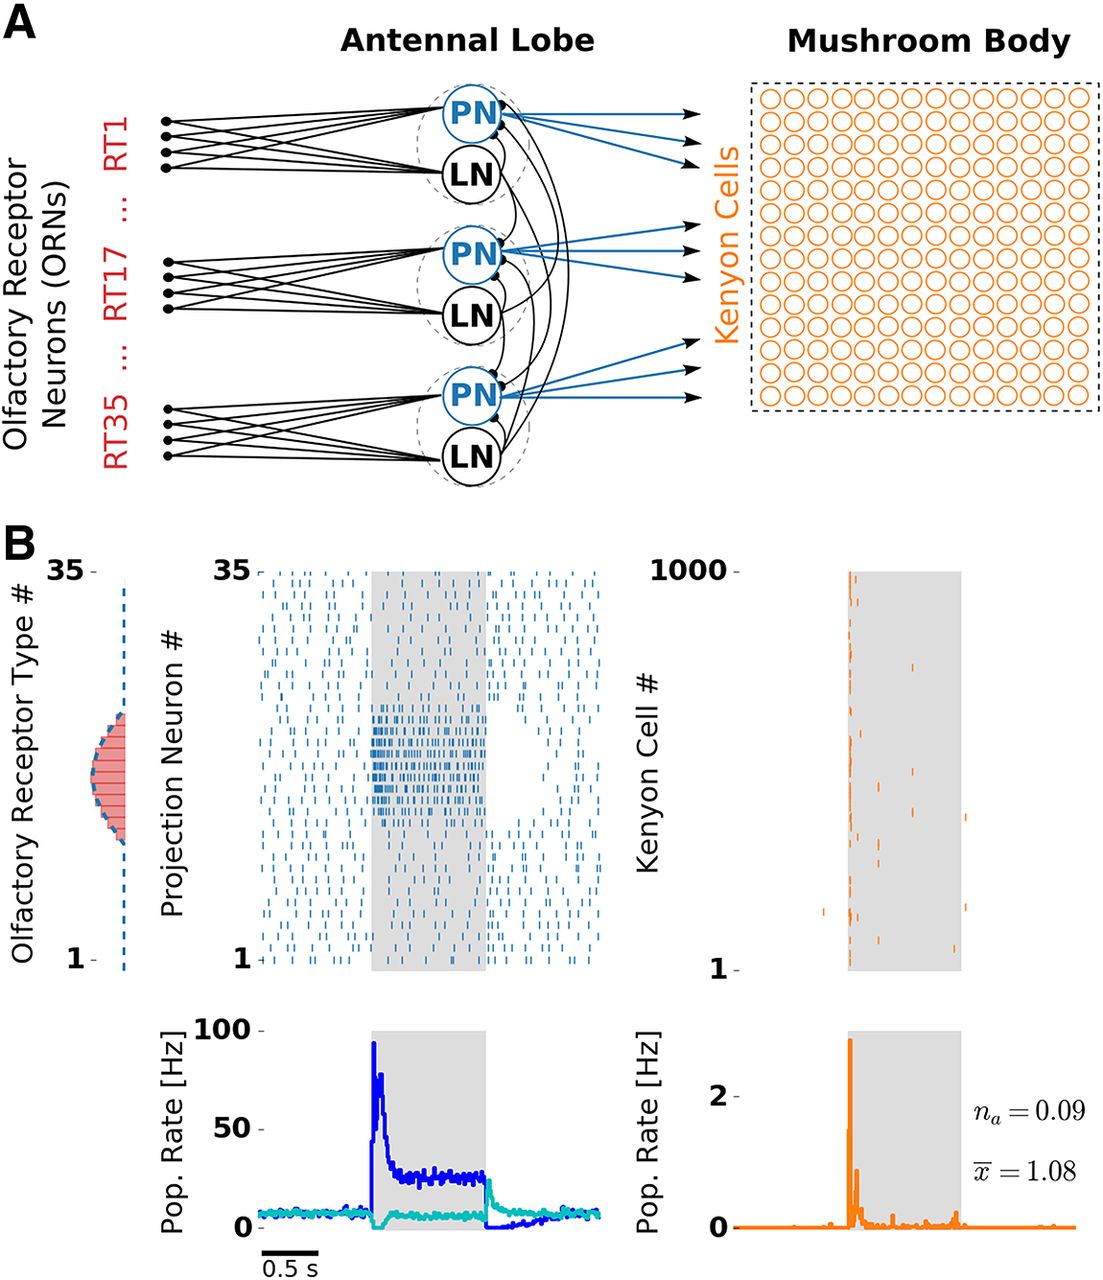
Olfactory network model structure and odor response. A, Network structure resembles the insect olfactory pathway with three main processing stages. In each glomerulus (dashed circles), a PN (blue) and a LN receive convergent ORN input (red) by one receptor type (RT). Each LN provides unspecific lateral inhibition to all PNs. KCs (orange) receive on average 12 inputs from randomly chosen PNs. B, Receptor response profile (red bars, AL input) depicts the evoked firing rate for each ORN type. Evoked PN spike counts (dashed blue line, AL output) follow the ORN activation pattern. Raster plots depict single-trial responses of PNs (blue) and KCs (orange). Presentation of an odor during 1000 ms is indicated by the shaded area. Population (Pop.) firing rates were obtained by averaging over 50 trials. PN spikes display a temporal structure that includes evoked transient responses at stimulus onset and offset, and a pronounced inhibitory postodor response. The PN population rate was averaged over PNs showing on responses (blue) and off responses (cyan). KC spikes were temporally sparse with the majority of the spikes occurring at the stimulus onset. Extended Data Figure 1-1 and Extended Data Figure 1-2 show odor responses with adaptation disabled in the KC and PN population, respectively.
Figure 1-1
Odor response with selective adaptation in the LN and the PN population. Strong phasic PN input elicits phasic KC responses. High KC firing threshold ensures sparse responses in the absence of SFA in the KC population. Download Figure 1-1, TIF file.
Figure 1-2
Odor response with selective adaptation in the LN and the KC population. The absence of SFA in the PN population was compensated by a constant current I0 = 0.38 nA. PNs show a constant population rate response with a slightly delayed onset due to inhibition by LNs. KCs show a strong onset population rate response and a nonzero tonic firing rate. Download Figure 1-2, TIF file.
The connections between the three network layers (ORNs, AL, MB) are feedforward and excitatory. Within the AL, LNs provide lateral inhibition to PNs. ORNs provide input to PNs and LNs. All ORNs of the same receptor type target the same single glomerulus. Every LN has inhibitory connections with all PNs, mediating unspecific lateral inhibition within the AL. Every KC receives 12 PN inputs on average (Szyszka et al., 2005; Turner et al., 2008). Connections between PNs and KCs were randomly drawn. Synaptic weights between all neurons are given in Table 1 for four different simulation conditions.
Synaptic weights for wOL (ORN-LN), wOP (ORN-PN), wLP (LN-PN), and wPK (PN-KC) connections in different simulation conditions (i–iv)
Responses to a set of seven stimuli, 50 trials each, and 3000 ms trial duration were simulated. Stimuli had a duration of 1000 ms and were presented at t = 1000 ms. All neurons were initialized with membrane voltage set to the leak potential and the adaptation current set to zero. To achieve steady-state conditions, simulations were prerun for 2000 ms without recording the activity.
Receptor input
ORNs were modeled as Poisson spike generators, with evoked firing determined by a receptor response profile and a spontaneous baseline. In the absence of stimulus, the spontaneous firing rate of all ORNs is set to
The intensity (amplitude) of ORN activation,
Neuron model
PNs, LNs, and KCs were modeled as leaky integrate-and-fire neurons with conductance-based synapses and a spike-triggered adaptation (Treves, 1993) current IA
. We use the same set of cell parameters for all neuron types (Table 2). This supports the generic character of our model and ensures that effects reported in this study are not a result of neuron type-specific parameters. The membrane potential of the ith neuron from the PN, LN, and KC populations obeys the following:
Parameters of the neuron model
Membrane potentials follow a fire-and-reset rule. The fire-and-reset rule defines the spike trains of PNs, LNs, and KCs denoted by
Synaptic conductances gi
obey the following:
Adaptation currents
Simulation conditions
The following four different scenarios were simulated: (i) without lateral inhibition and cellular adaptation, (ii) with lateral inhibition, (iii) with cellular adaptation, and (iv) with lateral inhibition and cellular adaptation. We quantified the strength of lateral inhibition with a multiplicative factor, α, that sets the synaptic weight between LNs and PNs (wLP) in units of the base synaptic weight (w0), as follows:
Lateral inhibition is a network effect, conveyed by synaptic transmission, and was therefore compensated by the scaling of synaptic weights. Weight scaling provides compensation during spontaneous as well as evoked activity. The scenario without lateral inhibition acts as a control condition, which deliberately does not include slow inhibitory synaptic dynamics.
In scenarios without cellular adaptation (1 and 2 above), the dynamic adaptation current was replaced by a compensatory static current,
In all scenarios, the spontaneous firing rate of PNs was set to ∼8 Hz (Perez-Orive et al., 2002; Krofczik et al., 2009; Chou et al., 2010; Meyer et al., 2013) by adjusting the synaptic weights between the ORNs and the PNs (wOP ).
Code accessibility
Script files for model simulation are accessible at: https://github.com/nawrotlab/SparseCodingInSpikingInsectModel.
Running the simulation requires Python 2.7, Brian 1.4, and numpy 1.11. All code was run on a x86-64 Linux machine.
run_IF.py, run_saIF.py - simulation scripts were used to run the model in the absence and presence of SFA, respectively. All parameters are contained within the respective scripts. Running the script file will save simulation results to file in the Python pickle format.
sim_code.py is the code of the neuron, input, and network models.
Data analysis
Population firing rate
The spike count of the ith neuron, in the kth time bin with size Δt is given by the following:
Sparseness measure
The sparseness of evoked KC responses was quantified by the widely used modified Treves–Rolls measure (Treves and Rolls, 1991; Willmore and Tolhurst, 2001):
Pattern overlap
We define the activation pattern for a given odor by a vector containing the evoked spike count for every neuron in a population. Pattern overlap between two similar odors, A and B, was calculated using an expression formally equivalent to Pearson’s correlation coefficient, as follows:
In addition, we consider trial-averaged activation patterns
The overlap between the trial-averaged patterns was calculated both for the PN and the KC population, and averaged over five network realizations with randomly drawn PN–KC connectivity.
Lateral inhibition scaling with parameter α
To test whether the decrease of overlap was robust for different strengths of lateral inhibition, the synaptic weight wOP
was adjusted as follows:
Decoding analysis
Odor identity was recovered from odor representations by Gaussian naive Bayes classification (Rish, 2000), using the scikit-learn package (Pedregosa et al., 2012). Training and testing data consisted of simulated odor representations for a set of seven stimuli (
Results
Spiking network model of the olfactory pathway with lateral inhibition and spike frequency adaptation
We designed a spiking network model that reduces the complexity of the insect olfactory processing pathway to a simplified three-layer network (Fig. 1A) that expresses the structural commonality across different insect species, as follows: an input layer of ORNs, subdivided into different receptor types, the AL, a first-order olfactory processing center, and the MB. Furthermore, the model combines the following two essential computational elements: (1) lateral inhibition in the AL, and (2) spike frequency adaptation in the AL and the MB.
The processing between the layers is based on excitatory feedforward connections. Converging receptor input from all ORNs of one type is received by spatially confined subunits of the AL called glomeruli. In our model, glomeruli are represented by a single uniglomerular PN and a single inhibitory LN. In the MB, each KC receives, on average, 12 PN inputs (Szyszka et al., 2005), based on a random connectivity between the AL and the MB (Caron et al., 2013). All neurons in the AL and the MB were modeled as leaky integrate-and-fire neurons with spike-triggered adaptation. Based on evidence from theoretical studies (Schwalger et al., 2010) and experimental studies (Fisch et al., 2012), adaptation channels cause slow fluctuations. We accounted for this fact by simulating channel noise in the slow adaptation currents (Materials and Methods).
We simulated ORN responses to different odor stimuli. Single ORN responses were modeled in the form of Poisson spike trains with firing rates dependent on the receptor type and stimulus identity. The relationship is set by a receptor response profile (Fig. 1B, left) that determines ORN firing rates of all receptor types for a given stimulus. Responses to different stimuli are generated by shifting the response profile along the receptor space. The offset between any two stimuli reflects their dissimilarity: similar stimuli activate overlapping sets of olfactory receptors, whereas dissimilar stimuli activate largely disjoint sets of receptors. Stimuli were presented for 1 s, reflected by a step-like increase of ORN firing rate.
In the absence of stimuli, ORNs fired with a rate of 20 Hz reflecting their spontaneous activation (Nagel and Wilson, 2011). Both LNs and PNs receive direct ORN input. We tuned synaptic weights of the model to match physiologically observed firing rates of PNs and LNs, which are both ∼8 Hz (Perez-Orive et al., 2002; Krofczik et al., 2009; Chou et al., 2010; Meyer et al., 2013; for details, see Materials and Methods). Lateral inhibition and SFA, the neural mechanisms under investigation, both provide an inhibitory contribution to the total input of a neuron. In our model, SFA is a cellular mechanism mediated by a slow, spike-triggered, hyperpolarizing current in LNs, PNs, and KCs, whereas a global lateral inhibition in the AL is mediated by LNs with fast synapses that receive input from a single ORN type and inhibit all PNs in a uniform fashion.
Odor responses at the AL and the MB level of the spiking network model
Figure 1B illustrates PN and KC responses to one odor. PNs driven by the stimulus showed a strong transient response at the stimulus onset, a pronounced adaptation during the stimulus, and a period of silence after stimulus offset due to the slow decay of the strong adaptation current. This resembles the typical phasic–tonic response patterns of PNs (Bhandawat et al., 2007; Nawrot, 2012; Meyer et al., 2013).
PNs receiving direct input from ORNs activated by the stimulus showed a strong response at the stimulus onset. Interestingly, the population firing rate over these PNs revealed that the “on” response follows a biphasic profile with an early and a late component. In addition, PNs with no direct input from stimulated ORNs showed an “off” response at the stimulus offset. Nondriven PNs were suppressed during a short period after stimulus onset and showed reduced firing during the tonic response. The PN population response consisted of complex activations of individual PNs with phases of excitation and inhibition. Hence, in the AL, odors were represented as spatiotemporal spike patterns across the PN population.
At the level of the MB, KCs typically show none or very little spiking during spontaneous activity and respond to odors with only a few spikes in a temporally sparse manner (Perez-Orive et al., 2002; Ito et al., 2008; Turner et al., 2008). In our model, synaptic weights between PNs and KCs were tuned to match the very low probability of spontaneous firing. The resulting KC responses were temporally sparse. Because of the negative feedback mediated by strong spike frequency adaptation, most KC spikes were confined to stimulus onset. Notably, we also found that KCs sometimes exhibited off responses. These KC off spikes occurred very rarely, because they are driven by the PN off response, which is much weaker compared with the PN on response. The timing and amplitude of temporally sparse responses are in good quantitative agreement with in vivo KC recordings (Ito et al., 2008).
Dense and dynamic odor representations in the AL
To explore the effects of lateral inhibition and cellular adaptation on stimulus representations, we simulated odor responses in conditions in which we separately deactivated one or both mechanisms. Lateral inhibition was deactivated by setting the inhibitory synaptic weight between LNs and PNs to zero and simultaneously reducing the value of the excitatory synaptic weight between ORNs and PNs, such that the spontaneous firing rate of 8 Hz was kept. Adaptation was deactivated by replacing the dynamic adaptation current by a constant current with an amplitude that maintained the average spontaneous firing rate.
Figure 2 illustrates the separate effects of lateral inhibition and adaptation on odor responses in the PN population. In all conditions, PNs fired spontaneously before stimulation due to spontaneous ORN activation. PNs driven by stimulation receive input from ORNs that were activated by the presented odor. In the absence of adaptation and lateral inhibition (Fig. 2Ai,Bi), the stimulus response followed the step-like stimulation and showed no further temporal structure. In the presence of lateral inhibition (Fig. 2Aii,Bii), PNs not driven by the stimulus were strongly suppressed. Adaptation alone (Fig. 2Aiii,Biii) resulted in a phasic–tonic response profile with a high phasic peak amplitude immediately after stimulus onset. In the presence of both mechanisms (Fig. 2Aiv,Biv), we observed the characteristic phasic–tonic PN response. The transient response was reduced in peak amplitude, and, interestingly, followed a biphasic profile with an early and a late component.
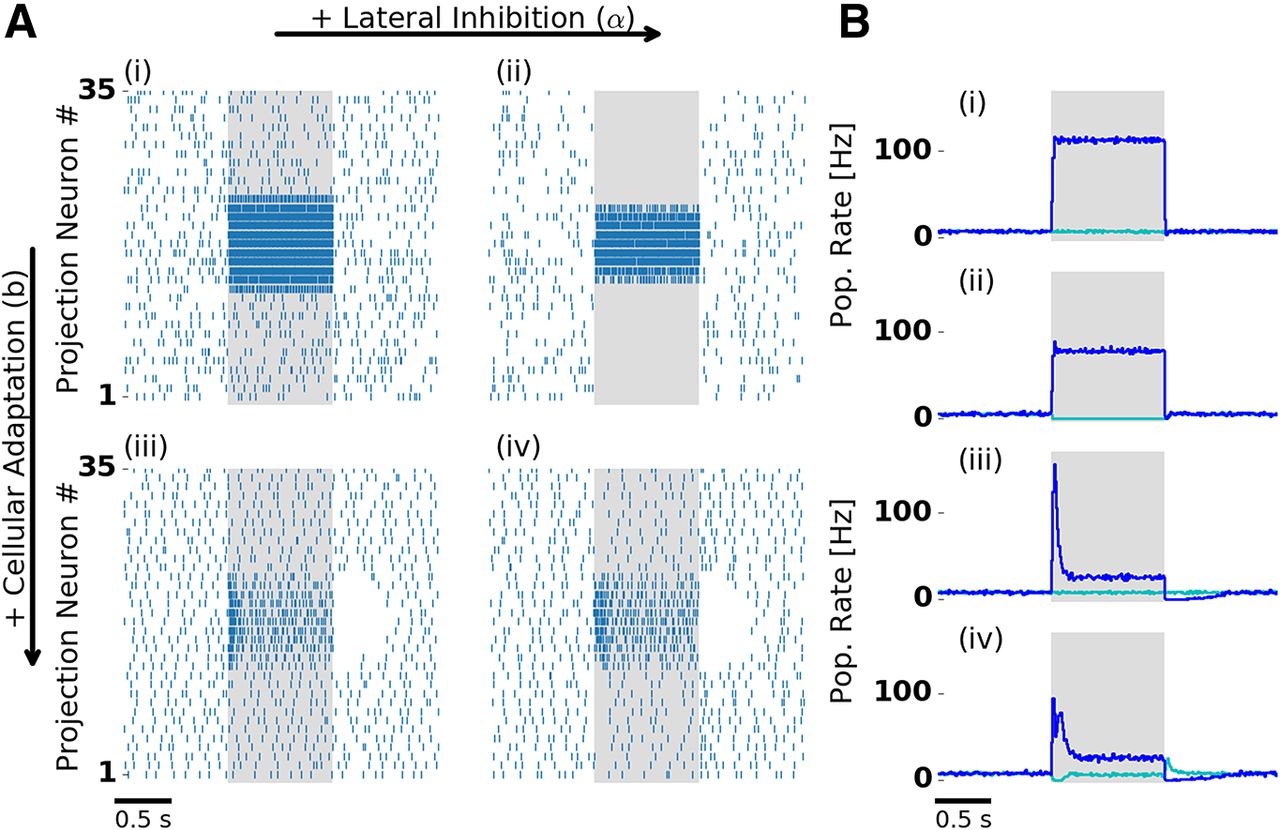
Lateral inhibition and cellular adaptation shape PN odor response dynamics. A, Single-trial PN spiking responses simulated with (right column) and without (left column) lateral inhibition, and with (bottom row) and without (top row) adaptation. Presentation of a single odor during 1000 ms is indicated by the shaded area. With adaptation, PNs display a temporal structure that includes a transient and a tonic response, and a pronounced inhibitory postodor response. B, Trial-averaged population firing rate: PNs driven by stimulation (blue) and remaining PNs (cyan). Bi–iv indicate the presence and absence of lateral inhibition and adaptation, as in A. In the presence of lateral inhibition, firing rates during stimulation are reduced. In the presence of lateral inhibition and adaptation (Aiv, Biv) PNs show either transient on responses (blue) or off responses (cyan). Aiv and Biv are reproduced in Figure 1B. Extended Data Figure 2-1 shows PN tuning profiles and input–output relation.
Figure 2-1
A, B, In the absence of adaptation (A, B), lateral inhibition (B) sharpens the PN tuning profile (blue). C, D, In the presence of adaptation, the PN tuning profile is not affected by lateral inhibition. The tuning profile was obtained by averaging PN firing rates during the 1 s stimulation window and across 50 trials. PNs receive input from ORNs of the corresponding type according to the receptor response profile. The receptor response profile (gray), rescaled between the minimum and maximum PN firing rates, is shown in all panels for comparison. The insets show the input–output relation between the ORN and the PN firing rates. Both averaged (blue line) and single-trial (gray crosses) PN firing rates are shown. Download Figure 2-1, TIF file.
In our model, the interaction of lateral inhibition and the intrinsic adaptation currents in LNs and PNs account for biphasic PN responses. Because LNs are adapting, lateral inhibition is strongest at stimulus onset. Most PNs were initially suppressed and showed a slightly delayed response, whereas the initial response of PNs with strong input (early component) was not affected. Fast and delayed PN responses have also been found experimentally in the honeybee (Strube-Bloss et al., 2012). Model evidence for the interplay of cellular and network mechanisms behind biphasic PN responses was found in the pheromone system of the moth (Belmabrouk et al., 2011).
Spike frequency adaptation supports temporal sparseness in the MB
To isolate the contributions of adaptation and lateral inhibition (the latter was present only at the AL level) to odor responses at the MB level, we again tested the four conditions by deactivating one or both mechanisms. In all four conditions, KCs were almost silent and spiked only sporadically during spontaneous activity, whereas the amplitude and temporal profile of their odor response differed across conditions (Fig. 3).
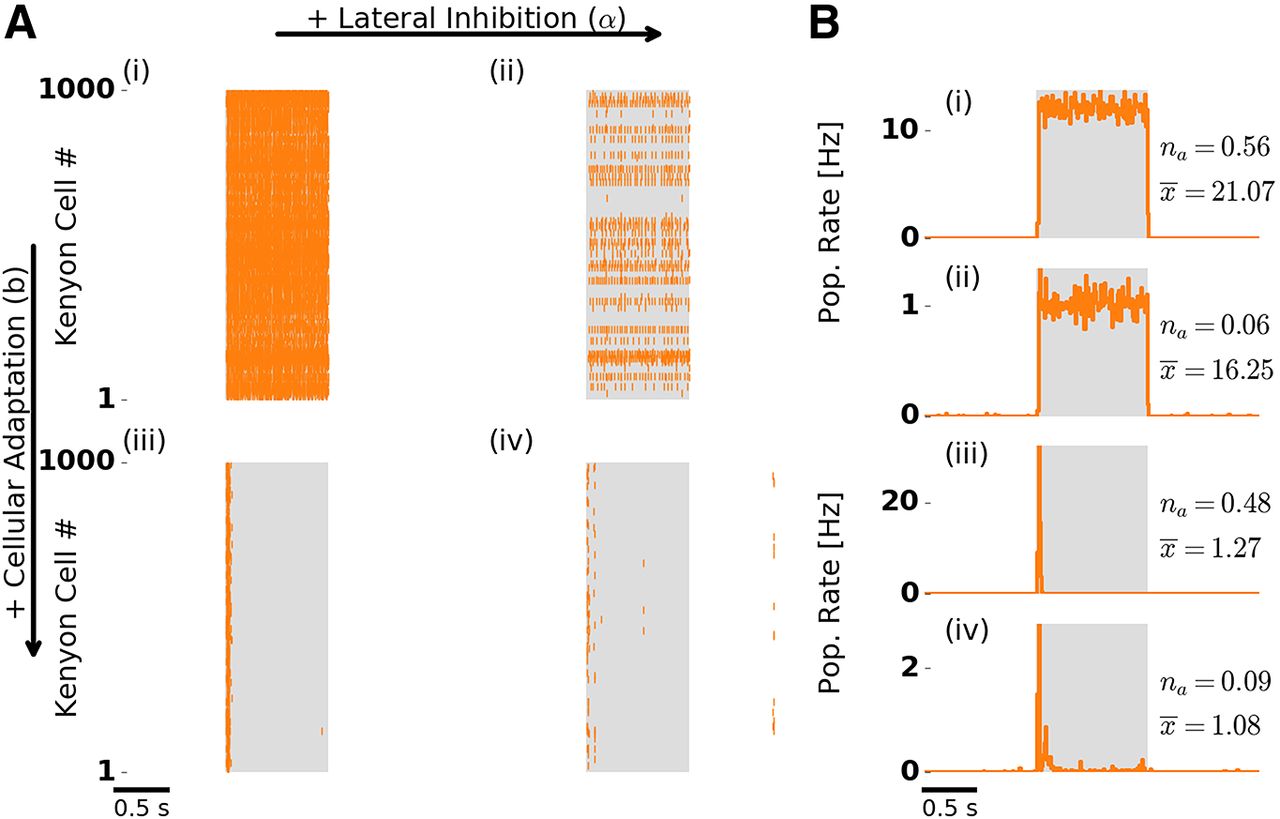
Odor response dynamics of the KC population. Figure layout is as in Figure 2. A, Single-trial population spike raster responses. B, Trial-averaged KC population firing rate. Numbers to the right indicate the fraction of activated KCs (na
) and the mean number of spikes per activated KC during stimulation (
In the presence of adaptation, we observed temporally sparse responses (Fig. 3Aiii,iv,Biii,iv). KCs typically responded with only one to three spikes (mean spikes per responding KC were slightly above one; Fig. 3Biii,iv, compare
In the absence of adaptation and regardless of the presence (Fig. 3Ai,Bi) or absence (Fig. 3Aii,Bii) of lateral inhibition, responding KCs fired throughout stimulation, because they received persistently strong input from PNs. Such persistent KC responses are in disagreement with experimental observations (Perez-Orive et al., 2002; Ito et al., 2008; Turner et al., 2008).
We quantified temporal sparseness of KC responses by calculating a measure modified from (Treves and Rolls, 1991; Materials and Methods). Comparison of temporal sparseness across the four conditions confirms that KC responses were temporally sparse only in the presence of adaptation, whereas lateral inhibition had no effect on temporal sparseness (Fig. 4A). Selective absence of adaptation in the KC population (Extended Data Fig. 1-1) did not have an effect on KC temporal sparseness (Extended Data Fig. 4-1A). This is due to a high KC spiking threshold that requires strong input and ensures sparse responses. Selective absence of adaptation in the PN population (Extended Data Fig. 1-2) led to persistent tonic KC responses, in addition to the onset KC responses. This is due to strong tonic PN input leading to reduced KC temporal sparseness.
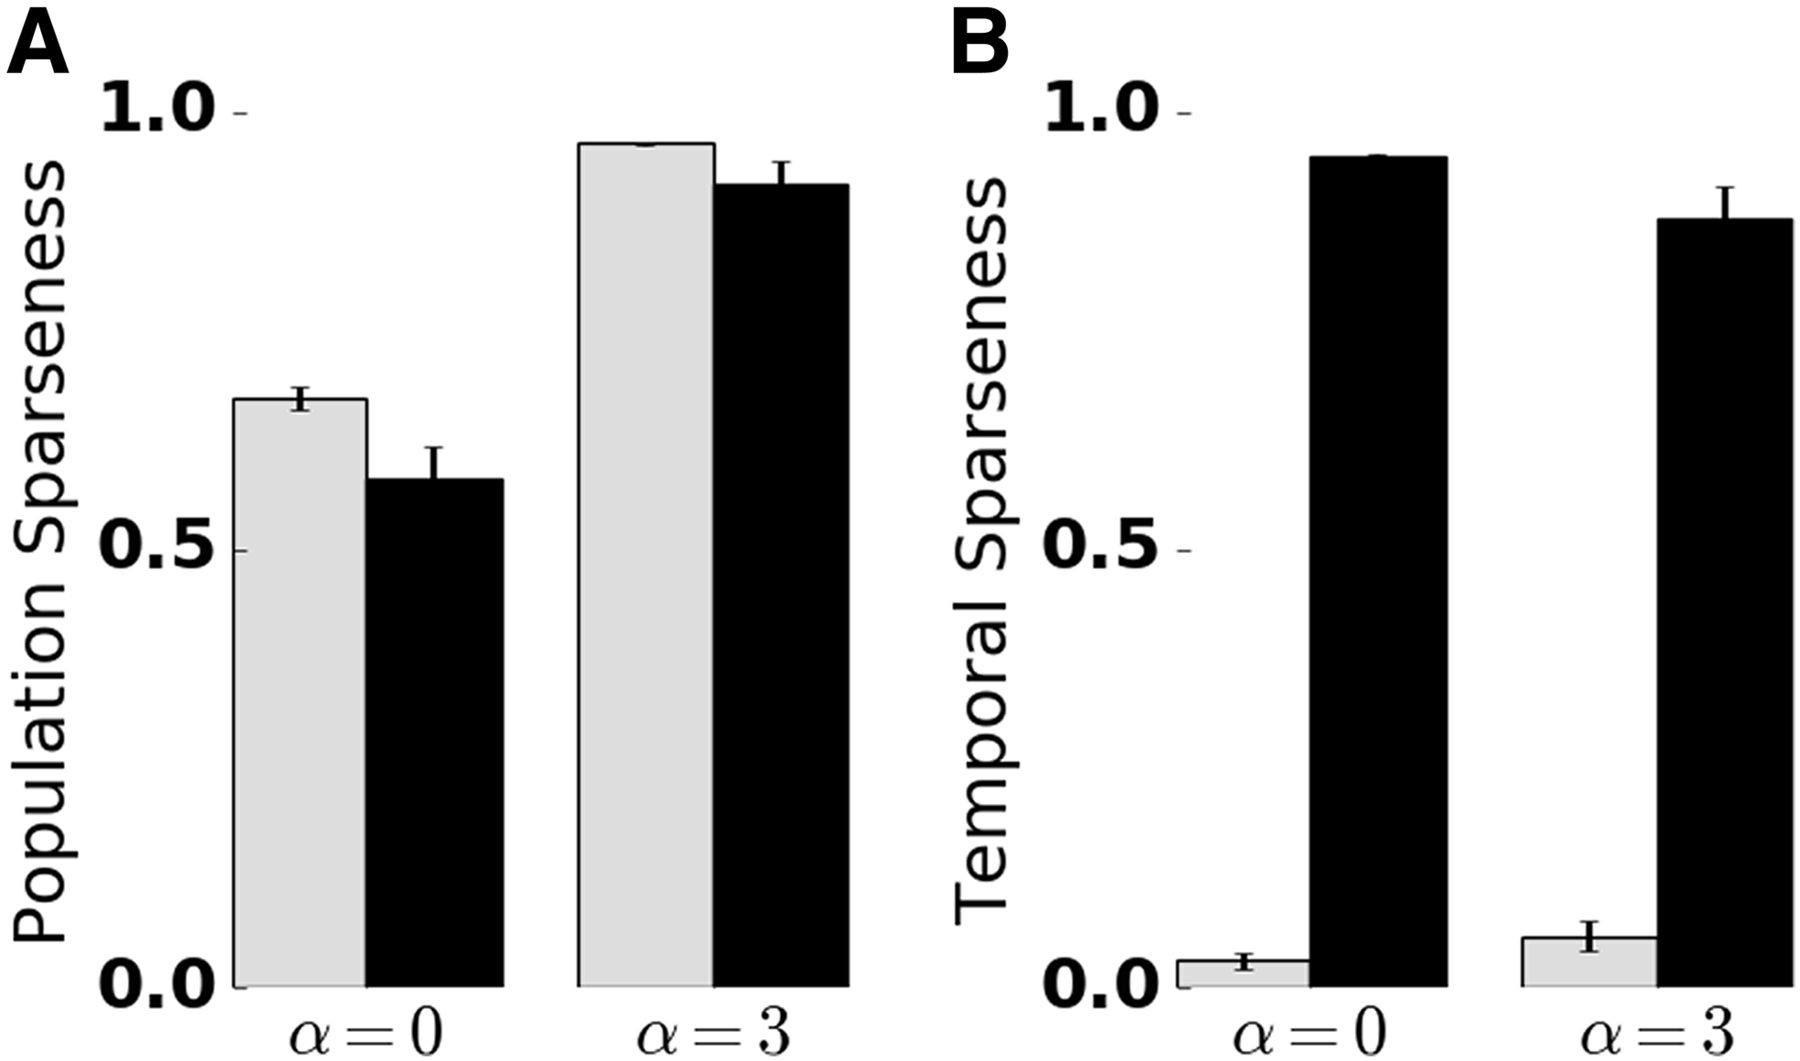
Quantification of temporal and population sparseness in the KC population. Sparseness was measured in the absence (α = 0) and presence (α = 3) of lateral inhibition, and the presence (black bars) and absence (gray bars) of SFA. The sparseness measure was averaged over 50 trials. Error bars indicate SD. A value of 1 corresponds to maximally sparse responses. A, Adaptation promotes temporal sparseness. B, Lateral inhibition in the AL promotes KC population sparseness. Extended Data Figure 4-1 shows temporal sparseness when SFA was disabled in the PN or KC population, and population sparseness for different numbers of PN inputs per KC.
Figure 4-1
A, Temporal sparseness with SFA presence in selected populations. Black: PNs, LNs, and KCs. White dashed: LNs and KCs. White: LNs and PNs. Gray bars indicate simulation in the complete absence of SFA. B, Population sparseness depends on the mean number of PN inputs per KC k, both in the absence (α = 0, left) and presence (α = 3) of lateral inhibition. In comparison with the default number of PN inputs (k = 12, black bars), reducing the mean number of connections to k = 9 (white dashed bars) increased population sparseness, whereas increasing the mean number of connections to k = 15 (white bars) decreased population sparseness. The gray bar corresponds to k = 12 in the absence of SFA and is given for reference. Download Figure 4-1, TIF file.
Lateral inhibition supports population sparseness in the MB
We observed that the fraction of responding KCs was considerably lower in the presence of lateral inhibition (Fig. 3B, compare na across panels). We recall that lateral inhibition in our model is acting on PNs. The transient PN population rate response showed a biphasic peak in the presence of lateral inhibition. Effectively, the transient PN response was broadened in time and its amplitude was reduced (Fig. 2B, compare iii, iv). As a result, KCs received lower peak input from PNs. How does this affect KC responses on a population level?
We visualized MB odor representations with activation patterns obtained by arranging KC spike counts evoked by two similar odors on a 30 × 30 grid in arbitrary order (Fig. 5A). In the absence of lateral inhibition (Fig. 5A, top), a majority of the KC population was activated by both tested odors Each of the 1000 KCs receives input from, on average, 12 PNs and thus from approximately one-third of the total PN population. KCs are readily activated by the strong PN input within a short time window following stimulus onset. Matching experimental results, KCs responded with one to three spikes. Turner et al. (2008) counted 2.2–4.9 KC response spikes in Drosophila in vivo intracellular recordings. Using extracellular single unit recordings, Ito et al. (2008) reported that moth KCs typically respond with a single spike and a maximum of five spikes. These numbers correspond to the apparent KC responses in the locust displayed in Broome et al. (2006).

Lateral inhibition in the AL facilitates population sparseness and reduces pattern correlation in the MB. Spike counts (single trial) of 900 randomly selected KCs in response to two similar odors (“Odor A” and “Odor B”) arranged on a 30 × 30 grid in the absence (top row) and in the presence (bottom row) of lateral inhibition. Inactive KCs are shown in black. A, In the absence of lateral inhibition, KCs readily responded to both odors, resulting in an activation pattern where most KCs are active. In the presence of lateral inhibition both odors evoked sparse KC activation patterns. B, Superposition of responses to the two odors. KCs that were activated by both odors are indicated by hot colors (color bar denotes the spike count of the stronger response). KCs that were activated exclusively by one of the two odors are indicated in gray. The fraction of KCs that show overlapping responses is reduced in the presence of lateral inhibition. C, Pattern correlation between the single-trial responses in A to the two odors obtained for PN (blue) and KC (orange) spikes counts, in the absence (α = 0) and presence (α = 3) of lateral inhibition. Dashed line indicates pattern correlation of the input (ORNs). Pattern correlation was retained at the AL and was reduced at the MB level. Lateral inhibition in the AL reduced pattern correlation in KCs, but not in PNs.
In the presence of lateral inhibition (Fig. 5A, bottom), the fraction of activated KCs was reduced substantially (KCs activated; trial averaged, 9%; SD, 3%). Again, this matches well the experimentally reported fraction of stimulus activated KCs in the range of 5–10%, as measured in Drosophila (Turner et al., 2008; Honegger et al., 2011) and 6–11% in the locust (Perez-Orive et al., 2002; Broome et al., 2006). In our model, due to the lower peak input from PNs, only KCs with large numbers of PN inputs are likely to be activated. Therefore, the KC population responds more selectively. The range of individual KC responses (one to three spikes) was not affected. These activation patterns demonstrate that the MB odor representations are sparse on a population level, as each odor is represented by the activity of a small fraction of the KC population.
To quantify the population sparseness of odor representations in the MB, we again calculated a sparseness measure (see Materials and Methods). Population sparseness increased in the presence of lateral inhibition, independent of SFA (Fig. 4B). In the presence of lateral inhibition and SFA, both population and temporal sparseness were in qualitative and quantitative agreement with experimental findings (Perez-Orive et al., 2002; Szyszka et al., 2005; Ito et al., 2008; Turner et al., 2008). We note that population sparseness also depends on the connectivity parameters of the model (see Discussion). In particular, increasing the average number of PN inputs per KC decreased population sparseness, whereas reducing this number resulted in an increase of population sparseness (Extended Data Fig. 4-1). However, lateral inhibition has a dominant effect on population sparseness, irrespective of the PN–KC connectivity (Extended Data Fig. 4-1). Together, odor representations at the MB level were characterized by a small fraction of the KC population responding with a small number of spikes.
Decorrelation of odor representations between AL and MB
In our model, lateral inhibition in the AL increased population sparseness of MB odor representations. Does an increased KC population sparseness lead to less overlap between MB odor representations? We visualized the overlap between odor representations in the MB by overlaying KC activation patterns in response to two similar odors (Fig. 5B): KCs responding exclusively to odor A or odor B are shown in gray, whereas KCs responding to both odors are color coded. With lateral inhibition (Fig. 5B, bottom), most of the KC responses were unique to odor A or odor B, and only a few KCs were activated by both odors. In contrast, with lateral inhibition deactivated (Fig. 5B, top), the ratio of KCs with unique responses to the total number of activated cells was low, indicating highly overlapping responses. We quantified the overlap between odor representations evoked by two similar odors in the PN and the KC populations. To this end, we calculated an overlap measure (formally equivalent to Pearson’s correlation coefficient; see Materials and Methods) between spike count patterns evoked by odors A and B (Fig. 5C). Interestingly, PNs retained the overlap of the input, independent of lateral inhibition. In contrast, KC representations showed a reduced overlap that decreased even further in the presence of lateral inhibition.
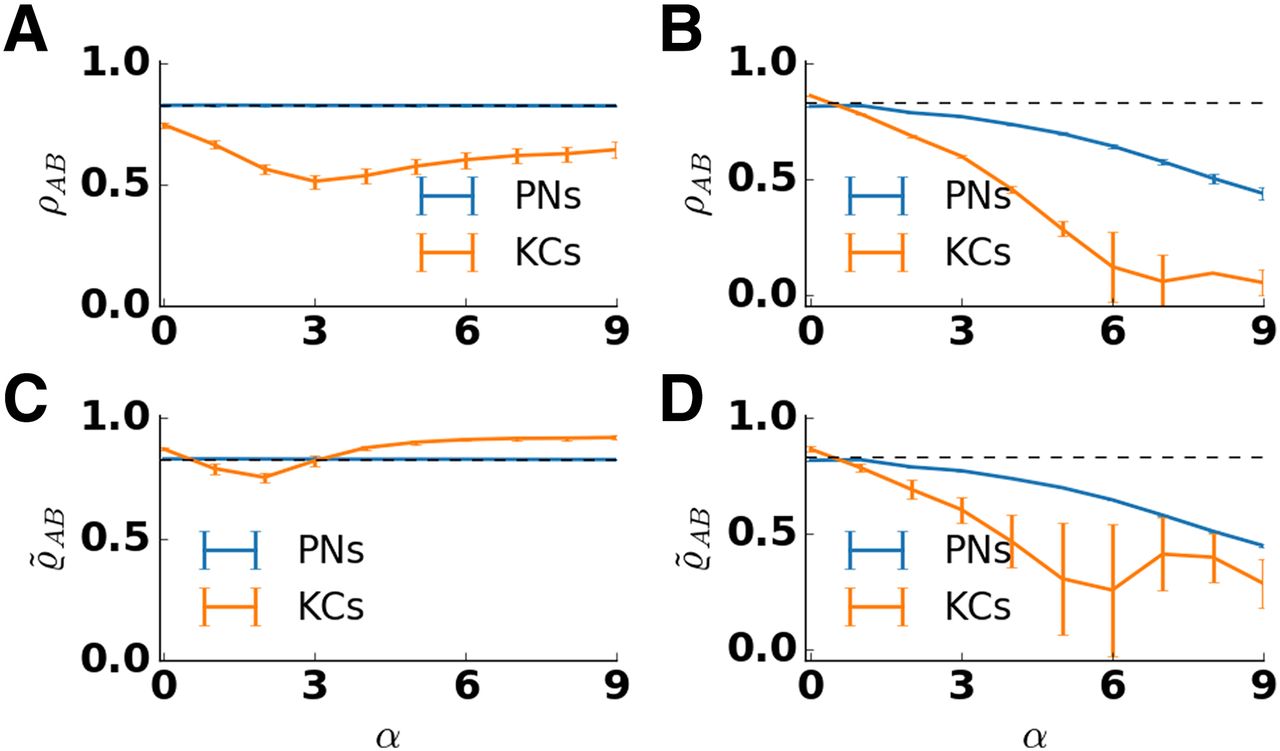
We tested how scaling of the lateral inhibition strength affected the pattern overlap in PN and KC odor representations. To this end, we varied the strength of lateral inhibition (α) in the AL by increasing the strength of inhibitory synapses and adjusting feedforward weights (see Materials and Methods). In addition, we calculated pattern correlations in the absence of adaptation. As before, pattern correlation was calculated for two similar odors that activated an overlapping set of receptors. In the absence of adaptation, lateral inhibition decorrelated odor representations in both populations (Fig. 6B). However, for increasing strength of lateral inhibition this leads to an unphysiological regime with an unrealistic low fraction of KCs that show a response (Extended Data Fig. 6-1B). In the presence of adaptation, increasing lateral inhibition had different effects on the PN and KC populations (Fig. 6A). In PNs, the correlation of the input was retained for all tested values of lateral inhibition. In KCs, pattern correlation first decreased for weak to moderate lateral inhibition strength but then increased for strong lateral inhibition. For an intermediate strength of the inhibitory weights, the pattern correlation between KC responses to similar odors attained a minimal value. For comparison, the bottom panels of Figure 6 show the overlap

Pattern correlation in the antennal lobe and the mushroom body depend on lateral inhibition strength α. The correlation coefficient ρAB between the response patterns to two similar odors was calculated and averaged over 50 trials and five network realizations for PNs (blue) and KCs (orange). Error bars indicate SD over trials and network realizations. Pattern correlation of the input is indicated by the dashed line. Input correlation is high because similar odors activate largely overlapping set of receptors. A, In the presence of adaptation, pattern correlation in PNs (blue) stays close to the input correlation for all values of lateral inhibition strength. In KCs (orange), the correlation decreases for small values of lateral inhibition strength and increases for large values of lateral inhibition strength. Pattern correlation in KCs is minimal for α = 3. B, In the absence of adaptation, pattern correlation decreases with the lateral inhibition strength both in PNs and KCs. The decrease is stronger in KCs. C, D, Pattern correlation
Figure 6-1
Mean fraction of activated KCs for different strengths of lateral inhibition. We obtained the fraction of activated KCs by counting KCs that have fired at least one spike during one of the given epochs: 1 s of stimulation, 1 s of spontaneous activity, and the first 50 ms after stimulus onset (transient response). A, In the presence of spike frequency adaptation the mean fraction of activated KCs during evoked activity (blue) shows a minimum for the intermediate strength of lateral inhibition. At the minimum, ∼10% of the KCs responded to the stimulus. This fits well with the experimentally reported values in the range of 5–11% (Turner et al., 2008; Honegger et al., 2011). B, In the absence of spike frequency adaptation, the mean fraction of activated KCs decreases with lateral inhibition during evoked activity (blue). Note that for α > 4 the fraction of responding KCs is close to zero or is zero. In the absence of spike frequency adaptation, and higher strengths of inhibition, KCs do not receive strong enough inputs to spike. Download Figure 6-1, TIF file.
Figure 6-2
Mean pairwise PN cross-correlation for different strengths of lateral inhibition. For each PN, a vector obtained by binning the corresponding spike train into 50 ms windows was calculated. Pairwise correlation between the vectors was calculated and averaged over all PN pairs and 50 trials. Download Figure 6-2, TIF file.
What is the explanation for the observed minimum in pattern overlap? The minimum of pattern overlap for α = 3 coincides with the minimum of the fraction of activated KCs (Extended Data Fig. 6-1). A lower fraction of responding KCs can be understood as an increased selectivity of KC responses. Both can be linked to changes of the PN input with two counteracting effects. For low strengths of lateral inhibition, the amplitude of transient PN input decreases with lateral inhibition due to temporal dispersion of response spikes across the PN population (Fig. 2Biv). KC selectivity increases, whereas pattern overlap decreases.
The increase of pattern overlap for
In general, a reduction of pattern correlation from PN to KC representations is characteristic for the insect MB (Laurent, 2002). Furthermore, low overlap between KC representations has been found to facilitate the discrimination of odors (Campbell et al., 2013). We therefore choose the intermediate strength of the inhibitory weights (α = 3) as a reference point in our model.
Odor encoding on short and long timescales
Next, we tested whether in our model the information about stimulus identity is contained in AL and MB odor representations by performing a decoding analysis in subsequent time bins of 50 ms (see Materials and Methods). In PNs, decoding accuracy peaked during stimulus onset and offset (Fig. 7A). Both peaks coincide with a state of transient network activity caused by the odor onset or offset. The on and the off responsive PNs establish odor representations optimized for discrimination. After stimulus onset, decoding accuracy dropped but remained on a plateau well above chance level. Remarkably, after stimulus offset, odor identity could be decoded for an extended time period (several hundreds of milliseconds), albeit with a reduced accuracy. Such odor aftereffects have been demonstrated previously in experiments (Szyszka et al., 2011; see Discussion).

Decoding of odor identity indicates a prolonged and reliable odor information in KC adaptation currents. A, B, D, Decoding accuracy was calculated for nonoverlapping 50 ms time bins, based on a set of seven stimuli (chance level, ∼0.14) presented for 1 s (shaded area). Blue shading indicates SD obtained from a cross-validation procedure (see Materials and Methods). A, Decoding of odor identity from PN spike counts. Decoding accuracy peaks at odor onset and offset, and remains high after stimulation. B, Decoding of odor identity from KC spike counts. Decoding accuracy is above chance only in the first three bins following stimulus onset. C, Adaptation current amplitudes (single trial, hot colors in arbitrary units) of 100 selected KCs in response to “odor A” (top) and “odor B” (bottom). D, Decoding of odor identity from KC adaptation currents. Decoding accuracy peaks 150 ms after odor onset then drops during stimulation, but remains high and is sustained after odor offset.
In KCs, decoding accuracy was above chance level only in the first two to three time bins (∼100 ms) after stimulus onset (Fig. 7B). In all other time bins, decoding accuracy remained at chance level. Because the spiking activity in the KC population is temporally sparse, the continuous information at the AL output is lost in the MB spike count representation. This raises the question of whether and if so, then how the information could be preserved in the MB throughout the stimulus. The intrinsic timescale of the adaptation currents might potentially support prolonged odor representations (Fig. 7C). We therefore repeated the decoding analysis on the adaptation currents measured in KCs (Fig. 7D). Indeed, the stimulus identity could reliably be decoded based on the intensity of the adaptation currents in subsequent time bins of 50 ms. Decoding accuracy peaked after stimulus onset and then slowly decreased. Remarkably, the timescale of the decay is comparable during and after stimulation. Because KCs show very little spontaneous activity, the decoding accuracy after stimulation decays with the adaptation time constant. This is due to the exponential decay of the adaptation currents evoked by stimulation and the stochastic adaptation current fluctuations in the background due to channel noise.
Discussion
We investigated the transformation between dense AL and sparse MB odor representations in a spiking network model of the insect olfactory system. Our generic model demonstrates lateral inhibition and spike frequency adaptation as sufficient mechanisms underlying dynamic and combinatorial responses in the AL that are transformed into sparse MB representations. To simulate responses to different odors, we incorporated simple ORN tuning and glomerular structure in our model. This approach allows us to investigate how different odors are represented in the AL and MB population activity and to assess information about odor identity contained in respective odor representations. We inspected overlap between odor representations in both populations. Sparse coding reduces overlap between representations, as has been predicted on theoretical grounds (Marr, 1969; Albus, 1971; Kanerva, 1988) and has been shown for MB odor representations (Szyszka et al., 2005; Turner et al., 2008; Lin et al., 2014). Similarly, our model shows pattern decorrelation in the MB but not in the AL.
Postodor responses
In our model, we found on and off responsive PNs. At the stimulus offset, the off responsive PNs transiently increase, whereas the on responsive PNs transiently decrease their firing rate (Fig. 2). On responsive PNs remain adapted beyond stimulus offset. Their excitability thus stays reduced until the slow adaptation current has decayed. In contrast, in off responsive PNs increased lateral inhibition during stimulation causes a below-baseline adaptation level throughout the stimulus and thus an increased excitability. In effect, the odor-evoked and the postodor PN activation patterns are reversed (i.e., anti-correlated; data not shown). This result matches well the experimental observations in the honeybee (Szyszka et al., 2011; Nawrot, 2012; Stierle et al., 2013) and Drosophila (Galili et al., 2011) PNs. Those results show highly correlated response patterns throughout stimulation and stable, but anti-correlated, postodor response patterns.
Differential mechanism underlying temporal and population sparseness in KCs
In our model, the two mechanisms underlying temporal sparseness and population sparseness act independently.
Temporal sparseness of KC responses in our model compares well to the experimentally recorded spiking responses in Drosophila, locust, and moth (Perez-Orive et al., 2002; Ito et al., 2008; Turner et al., 2008), and to calcium imaging experiments in the honeybee (Szyszka et al., 2005). The model proposed here solely relies on spike frequency adaptation for temporally sparse responses. On a cellular level, strong adaptation currents in KCs, which are suitable for the generation of sparse responses, have been found in the honeybee (Wüstenberg et al., 2004) and cockroach (Demmer and Kloppenburg, 2009). In the model, temporal sparseness is not affected by the deactivation of lateral inhibition, a finding supported by a previous study by Farkhooi et al. (2013).
Several studies have suggested that either feedforward inhibition (Assisi et al., 2007) or feedback inhibition (Szyszka et al., 2005; Papadopoulou et al., 2011; Gupta and Stopfer, 2012; Lei et al., 2013; Kee et al., 2015) causes temporally sparse responses. The existence of inhibitory feedback neurons in the MB has been demonstrated experimentally in different insect species (cockroach: Takahashi et al., 2017; Drosophila: Liu and Davis, 2009; honeybee: Grünewald, 1999; locust: Papadopoulou et al., 2011), whereas evidence for feedforward inhibition to the MB is lacking (Gupta and Stopfer, 2012). Our model demonstrates that temporally sparse responses can be obtained without an inhibitory circuit motive. There is further evidence for a GABA-independent mechanism for the temporal shortening of KC responses. Calcium imaging studies in Drosophila (Lei et al., 2013; Lin et al., 2014) and in the honeybee (Farkhooi et al., 2013; Froese et al., 2014) showed that the temporal profile of the fast response dynamics of KCs is preserved even if GABAergic inhibition is blocked.
What could be the benefit of temporally sparse responses in KCs? We hypothesize that temporal sparseness is an important strategy for the system to follow fast transient inputs rather than representing static input. The typical laboratory experiment uses controlled odor stimuli that are presented with static intensity for up to several seconds. However, in a natural setting, olfactory inputs are highly dynamic (Vickers et al., 2001). Natural odor plumes do not represent a gradient intensity due to diffusion. Rather, odors distribute in space and time in a filamentous structure (Vickers, 2000; Celani et al., 2014), and filaments from different odors do not mix perfectly (Szyszka et al., 2012). Because of wind and animal movement, particularly relevant for flying insects, the olfactory input will generally be highly dynamic in time, resulting in fast and steep changes of odor concentration whenever the animal encounters an odor filament. In such an on–off scenario, temporally sparse responses in KCs might enable the processing of rapid odor filament encounters. We hypothesize that the KC population provides a temporally sparse representation of the odor identity of each filament with a single spike or a few spikes in each KC. The system is thus able to track individual odor filament encounters over time, and the animal can adapt its behavior accordingly (e.g., during odor source location in foraging flights; Budick, 2006; Van Breugel and Dickinson, 2014; Egea-Weiss et al., 2018). At the periphery, it has been shown that the olfactory receptor neurons in various insect species are able to follow fast repeating olfactory input pulses even for high pulse frequencies (Vickers et al., 2001; Szyszka et al., 2014). Our results show that the mechanism of spike frequency adaptation is able to generate temporally sparse responses to the onset of an odor and thus to detect temporal changes in the olfactory input rather than encoding the persistence of a stimulus. Adaptation has previously been implicated as a means to compute the temporal derivative of sensory input (Lundstrom et al., 2008; Tripp and Eliasmith, 2010; Farkhooi et al., 2013). A second advantageous property of spike frequency adaptation is that it facilitates the reliability of individual responses and significantly reduces the variability in the number of response spikes across repeated stimulus representation (Farkhooi et al., 2011, 2013). Temporal sparseness is not limited to the insect MB and has been discovered in diverse sensory systems, notably in mammalian sensory cortices (Vinje and Gallant, 2000; Hromádka et al., 2008; Isaacson, 2010; Wolfe et al., 2010), where it has also been linked to the encoding of temporally dynamic input in natural sciences (Haider et al., 2010; Yen et al., 2010). We suggest that SFA is a general mechanism across sensory systems and taxa supporting reliable temporally sparse responses under natural sensory input conditions.
The KC population sparseness in our model matches qualitatively and quantitatively with experimental estimates from electrophysiological responses in locust and Drosophila (Perez-Orive et al., 2002; Turner et al., 2008) and from calcium imaging in Drosophila (Honegger et al., 2011). Our model shows sparse KC responses on a population level in the presence of, but not in the absence of, lateral inhibition. Calcium imaging experiments in the honeybee (Froese et al., 2014) have shown that inactivating GABA transmission disrupts population sparseness, which is in line with our modeling results. In Drosophila, feedback inhibition contributes to the population sparseness of KCs, as blocking of feedback inhibition reduced population sparseness and undermined the learned discrimination of similar odors (Lei et al., 2013; Lin et al., 2014). In addition, a cellular mechanism such as a high threshold for KC activation in Drosophila (Turner et al., 2008) and active KC subthreshold properties in locust (Perez-Orive et al., 2002; Jortner et al., 2007) have been shown to support population sparseness. Moreover, the plasticity of inhibitory feedback changing response patterns in the KC population might be crucial for associative learning (Liu and Davis, 2009; Haehnel and Menzel, 2010; Filla and Menzel, 2015; Haenicke et al., 2018). We suggest that different neurophysiological mechanisms of sparseness are not mutually exclusive but rather act in concert. Both lateral inhibition in the AL and feedback inhibition in the MB are likely to be necessary for sparse KC population responses.
Evidently, the sparse connectivity scheme between the PN and KC populations is the anatomic basis for population sparse response patterns in the KC layer (Nowotny et al., 2005; Jortner et al., 2007; Huerta and Nowotny, 2009). This connectivity is divergent-convergent with an apparent high degree of randomness (Caron et al., 2013). In our model, connectivity is parametrized by the average number of inputs k per KC and by the synaptic weight of PN-KC (wPK). Experimental estimates indicate a small number of inputs per KC. Anatomical data in Drosophila provided estimates of k ∼ 13 (Turner et al., 2008) and
Decorrelation of odor representations between AL and MB
Decorrelation of stimulus representations has been postulated to be a fundamental principle underlying sensory processing (Barlow, 1961, 2001). In particular, in the olfactory system odor representations are transformed to decorrelate activity patterns evoked by similar odors, making them more distinct (Uchida et al., 2013; Friedrich and Wiechert, 2014; Galizia, 2014). Transformations decreasing the overlap between representations are termed pattern decorrelation. Less overlapping representations increase memory capacity (Treves and Rolls, 1991) and make the discrimination of odors easier (Campbell et al., 2013). In our model, we found that AL odor representations preserved the similarity of the input, whereas representations of similar odors at the periphery became decorrelated in the MB.
We quantified the effects of lateral inhibition and adaptation on pattern correlations. We found that decorrelation of activity patterns in the AL occurred only in the absence of adaptation. Moreover, the amount of decorrelation depended on lateral inhibition strength. Considering decorrelation of odor representations, the difference between lateral inhibition and adaptation is substantial. In our model, lateral inhibition alone sharpens PN responses, whereas adaptation leads to linearization of the input–output relation between the input from ORNs and the PN output (Extended Data Fig. 2-1). In computational studies, lateral inhibition was previously shown to decorrelate odor representations (Luo et al., 2010; Schmuker et al., 2011). In a Drosophila study using single sensillum recordings from ORNs and whole-cell recordings from PNs, lateral connection in the AL were found not to affect correlations between glomerular channels (Bhandawat et al., 2007), but there is also evidence for decorrelation of AL representations (Olsen et al., 2010). In our model, pattern correlation between representations of similar odors was preserved at the level of the AL but was reduced in the MB. The observed counteracting effect of adaptation on pattern decorrelation by lateral inhibition in the AL is generally valid for strong adaptation. Strong adaptation currents provide slow, negative feedback that has a linearizing effect on the input–output relation (Ermentrout, 1998). As a consequence of strongly adapting PNs in our model, the pattern correlation of AL odor representations is equal to the pattern correlation given by the tuning profile of the ORN input (Fig. 6).
Odor representation in adaptation currents
Early investigations of dynamical odor representations have shown that odor identity can be reliably decoded from PN spike counts in 50 ms time bins (Stopfer et al., 2003; Mazor and Laurent, 2005; Krofczik et al., 2009). We used this approach to show that odor representations were specific and reliable in our model, including both AL and MB odor representations. We found that odor representations were optimized for discrimination during odor onset (Fig. 7B,C). Optimal decoding during stimulus onset is in agreement with electrophysiological evidence from locust and honeybee PNs (Mazor and Laurent, 2005; Krofczik et al., 2009). In the auditory system, Hildebrandt et al. (2015) found that grasshoppers use the onset of a sound pattern as the most reliable information for sound localization. Their study provides behavioral evidence that, in the presence of adaptation, the onset response preserves absolute stimulus levels. Our model shows that at the MB level, stimulus identity could be decoded from KC spike counts only during a short time window after stimulus onset (up to ∼150 ms; Fig. 7B). This is a consequence of the temporally sparse KC responses.
Moreover, we found that KC adaptation currents retain a representation of stimulus identity, resembling a prolonged odor trace (Perisse and Waddell, 2011; Dylla et al., 2013). In our model, an odor trace present in adaptation levels extends well beyond the brief spiking responses. Adaptation currents constitute an internal dynamical state of the olfactory network that is not directly accessible to downstream neurons: a “hidden state” (Buonomano and Maass, 2009). However, adaptation levels influence the responses to (subsequent) stimuli (Farkhooi et al., 2013) and may also affect downstream processing through an indirect pathway.
Our results suggest that odor representations are not exclusively found in the spiking activity. The phenomenological model of spike-triggered adaptation used in this study (see Materials and Methods; for review, see Benda and Herz, 2003) is motivated by calcium-activated outward potassium currents. Those currents are activated by spike-triggered calcium influx, which is only slowly removed. We propose that information carried by temporally sparse KC spikes is stored on prolonged timescales by the slowly decaying calcium concentration. We predict long-lasting levels of calcium in the KC population that retain odor information and provide a potential substrate for a short-term sensory memory. Therefore, classification of calcium levels recorded in the MB should reveal odor identity on a timescale determined by the decay of the intracellular calcium level. Indeed, a recent study by Lüdke et al. (2018) showed that prolonged calcium activity in KCs encoded odor information and could be related to behavioral odor recognition performance in trace conditioning experiments where a conditioned odor stimulus is followed by a temporally delayed reinforcement stimulus.
Acknowledgments
Acknowledgments: We thank Farzad Farkhooi for the initial network model and conceptual discussions.
Footnotes
The authors declare no competing financial interests.
This research is supported by the German Research Foundation (Grant 403329959) within the Research Unit “Structure, Plasticity and Behavioral Function of the Drosophila mushroom body” (DFG-FOR 2705; https://www.uni-goettingen.de/en/601524.html). R.B. received a scholarship from the Research Training Group “Sensory Computation in Neural Systems” (DFG-RTG 1589) funded by the German Research Foundation.
This is an open-access article distributed under the terms of the Creative Commons Attribution 4.0 International license, which permits unrestricted use, distribution and reproduction in any medium provided that the original work is properly attributed.
References
In this issue


