

Article Figures & Data
Figures
- Figure 2.
Forelimb motor skill consolidation is impaired in premanifest stage in YAC128 mice. A, B, Timeline (A) and experimental schematic (B) of single pellet reaching task. C, Heat map of successful attempts in WT and YAC128 mice at day 1 and day 8. Each horizontal line in the heat map represents the performance of an individual mouse. Each vertical white line represents the time to reach 50% of the pellets. D, Average speed of success over the training phase of single pellet reaching task in WT and YAC128 mice. E, F, Scatter plot and group mean of the success rate at day 1 versus day 8 of the single pellet reaching task within WT (E) and YAC128 mice (F). G, Kinetic of total attempts (including success, drop and failed attempts) across single pellet reaching task training days in WT and YAC128 mice. H, Kinetic of fail rate and drop rate during single pellet training in WT and YAC128 mice. I, Experimental schematic. J, Group mean sucrose consumption across days. K, Group mean water consumption across days. L, Group mean sucrose consumption normalized to bodyweight across days. M, Sucrose preference at day 1, day 2, and day 3 in WT and YAC128 mice. Square symbols represent female mice and circles represent males. Error bars show SEM; ***p < 0.001.
- Figure 1.
Motor consolidation alterations in swimming tank test and rotarod task in premanifest stage in YAC128 mice. A, D, Activity trail plots. B, E, Group mean of the distance traveled in circular corridor (B) or in open field (E) in WT and YAC128 mice. C, F, Group mean of the velocity in circular corridor (C) or in open field (F) in WT and YAC128 mice. G, Experimental schematic. H, Time course of cross latency in swimming tank test in WT and YAC128 mice. I, Quantification of failed trials at day 2 and day 7 of swimming tank test in WT and YAC128 mice. J, Quantification of floating behavior across training in YAC128 mice. K, Floating behavior across swimming tank test training in YAC128 mice. Each horizontal line represents the floating behavior of an individual mouse during the 30 s trial for the trial 1 (t1), the trial 2 (t2), and the trial 3 (t3) at day 1, day 2, day 3, and day 7. Each episode of floating behavior is represented in dark blue. Females are represented in blue color while male mice are labeled in red color. L, Experimental schematic. M, Group mean of the time in open arms expressed in percentage in the elevated plus maze WT and YAC128 mice. N, Experimental schematic. O, Time course of the fall latency in rotarod in WT and YAC128 mice. Square symbols represent female mice and circles represent males. Error bars show SEM M.: male, F.: female; *p < 0.05, **p < 0.01, ***p < 0.001; ###p < 0.001 YAC D7 versus WT D7.
- Figure 3.
No major differences on synaptic strength with electrical stimulation in YAC128 MSN. A, Experimental schematic. B, Group mean PPR for WT and YAC128 MSN. Right, Example traces of AMPAR-EPSC at −60 mV in WT and YAC128 MSN. Scale bar: 20 ms, 50 pA. C, Group mean amplitude and frequency of asynchronous evoked events in WT and YAC128 MSN. Right, Example traces of evoked AMPAR-aEPSCs recorded at −70 mV. Star indicating an asynchronous event detected. Scale bar: 50 ms, 25 pA. D, Group mean AMPA/NMDAR ratio calculated in WT and YAC128 MSN. Right, Example traces of evoked AMPAR- and NMDAR-EPSCs at +40 mV. Scale bar: 20 ms, 50 pA. E, Group mean RI calculated in WT and YAC128 MSN. Right, Example traces of evoked AMPAR-EPSCs recorded at −60, 0, and + 40 mV. Scale bar: 20 ms, 50 pA. F, Time course of NMDAR-EPSC amplitude during ifenprodil application for WT and YAC128 MSN and associated example traces in WT and YAC128 mice in the inset. G, Group mean ifenprodil inhibition calculated in WT and YAC128 MSN. Scale bar: 50 ms, 50 pA. Square symbols represent female mice and circles represent males.
- Figure 4.
NMDAR transmission dysfunction at motor cortex to DLS MSN in YAC128 mice. A, left, Experimental schematic. Left down, In vitro validation of 20-Hz blue light stimulation protocol. Scale bar: 0.1 s, 10 mV. Right, Epifluorescent image of AAV5-CamKII-hChR2(H134R)-EGFP injection in the thalamus (top) or in the motor cortex (down). B, C, Group mean AMPA/NMDAR ratio calculated in WT and YAC128 MSN at thalamo-dorsolateral synapses (B) or at motor cortex to dorsolateral synapses (C). Right, Example traces of evoked AMPAR- and NMDAR-EPSCs at +40 mV. Scale bar: 50 ms, 25 pA (B) and 10 ms, 50 pA (C). D, Group mean AMPA/NMDAR ratio calculated in WT-D1+ MSN, WT-D1– MSN, YAC128-D1+ MSN and YAC128-D1– MSN at motor cortex to dorsolateral synapses. Scale bar: 10 ms, 50 pA. E, Group mean RI calculated at motor cortex to DLS synapses in WT and YAC128 MSN. Right, Example traces of evoked AMPAR-EPSCs recorded at −60, 0, and +40 mV. Scale bar: 10 ms, 50 pA (for YAC128) and 10 ms, 50 pA (for WT). F, I-O relationship of motor cortex glutamatergic transmission established by the stimulation duration (synaptic input) and the amplitude of the EPSC (output) in slices from WT and YAC128 MSN. Right, Representative EPSCs evoked by motor cortex terminal stimulation in DLS recorded at −60 mV in WT and YAC128 MSN. Scale bar: 10 ms, 50 pA. G, Group mean amplitude of asynchronous evoked events in WT and YAC128 MSN. Right, Example traces of evoked AMPAR-aEPSCs recorded at –70 mV. Star indicating an asynchronous event detected. Scale bar: 50 ms, 25 pA. H, Group mean decay time of NMDAR–EPSCs at +40 mV in WT and YAC128 MSN. Right, Example traces of NMDAR-EPSC at +40 mV. I, Time course of NMDAR-EPSC amplitude during ifenprodil application for WT and YAC128 MSN. Scale bar: 15 ms. J, Group mean ifenprodil inhibition calculated in WT and YAC128 MSN. Right, Example traces of NMDAR-EPSCs during ifenprodil (3 μM) bath application. Scale bar: 20 ms, 25 pA. K, I-V plots of normalized and averaged NMDAR-EPSCs of motor cortex to DLS MSN in WT and YAC128 mice and their associated example traces. Scale bar: 50 ms, 50 pA. L, Group mean PPR recorded at interval of 50, 100, and 300 ms for WT and YAC128 MSN evoked by motor cortex stimulation. Right, Example traces of AMPAR-EPSC at −60 mV in WT and YAC128 MSN. Scale bar: 50 ms, 25 pA. Square symbols represent female mice and circles represent males.
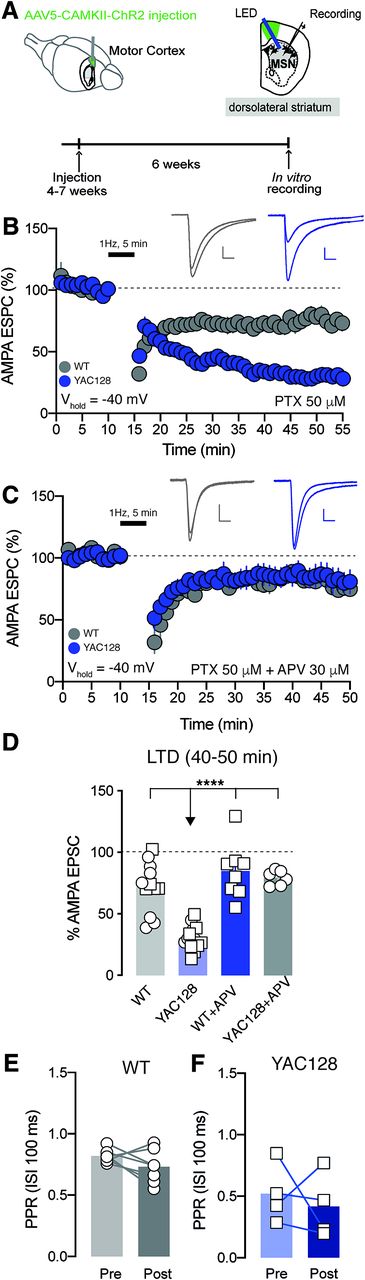
- Figure 5.
Aberrant NMDAR dependent LTD at motor cortex to DLS MSN in YAC128 mice. A, Experimental schematic. B, C, Kinetic of AMPA EPSC amplitude normalized to baseline at motor cortex to DLS MSN after low-frequency stimulation (1 Hz, 5 min) in WT and YAC128 groups with picrotoxin (50 μM; B) or with picrotoxin and APV (30 μM; C). Top, Example traces pre and post 1 Hz, 5 min. D, Quantification of AMPA EPSC amplitude normalized to baseline at motor cortex to DLS MSN after low-frequency stimulation in WT and YAC128 groups without and with APV application. E, F, PPR pre and post low-frequency stimulation protocol at motor cortex to DLS MSN in WT (E) and YAC128 mice (F). Scales bar: 20 ms, 50 pA. Square symbols represent female mice and circles represent males. Error bars show SEM; ****p < 0.0001.
- Figure 6.
Motor training induced motor cortex to DLS MSN plasticity is occluded in YAC128 mice. A, Experimental schematic. B, Average speed of success at the end of the training phase of single pellet reaching task (day 8 to day 9) in WT and YAC128 mice. C, D, Group mean AMPA/NMDAR ratio calculated in WT and YAC128 MSN in naive group or after single pellet reaching task training. Right, Example traces of evoked AMPAR- and NMDAR-EPSCs at +40 mV. Scales bar: 50 ms, 100 pA. Error bars show SEM.


In this issue


