

Article Figures & Data
Figures
- Figure 1.
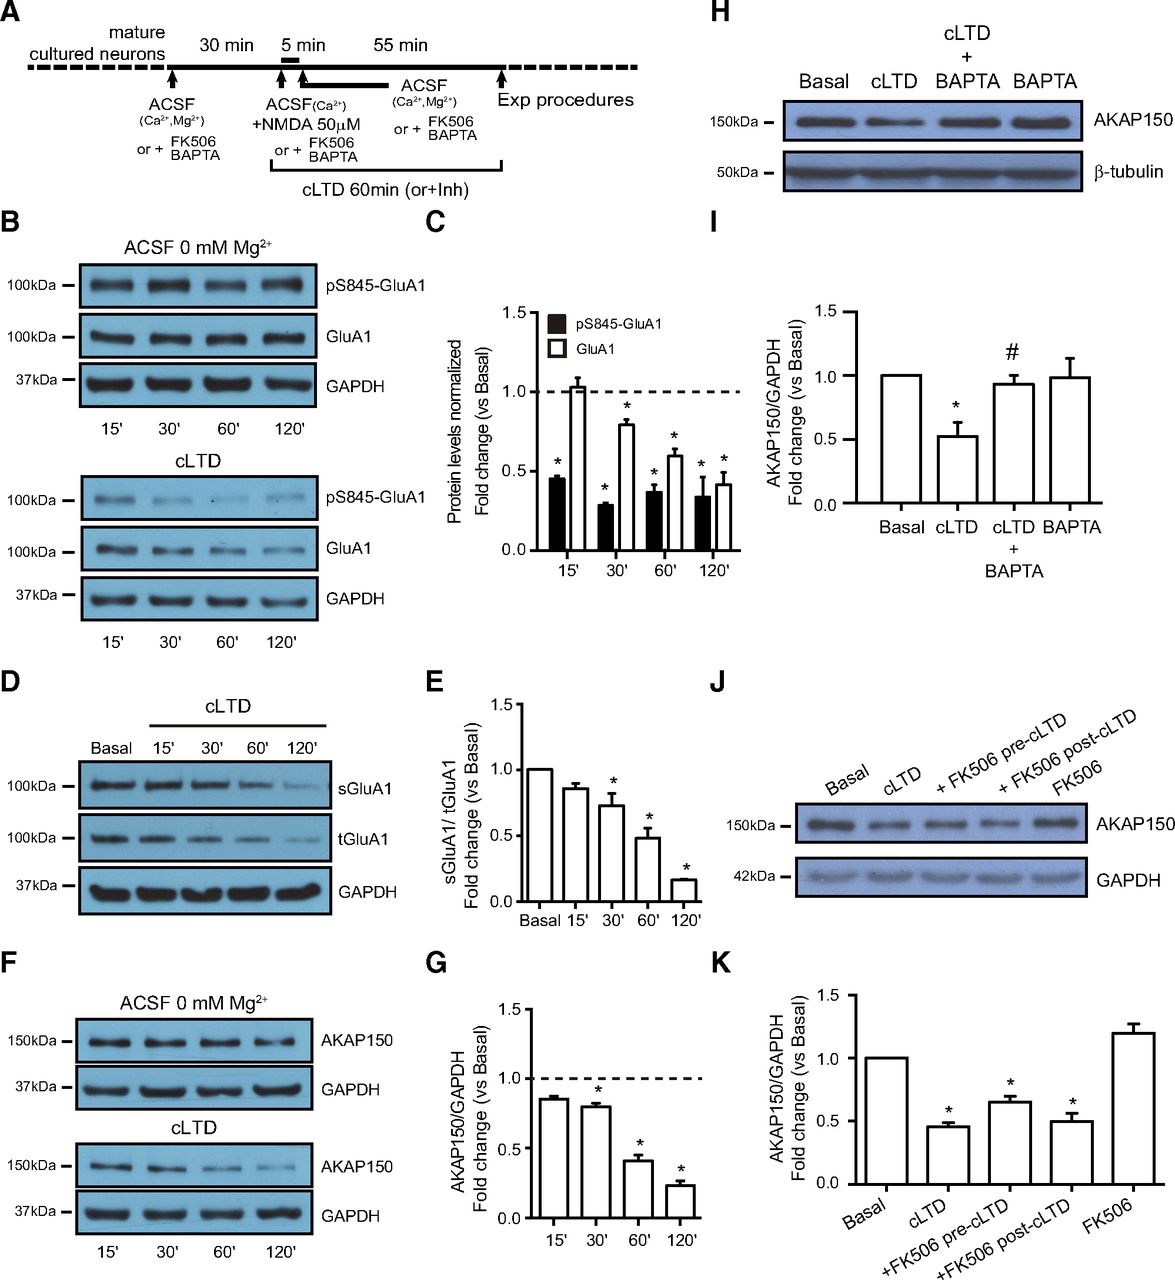
cLTD reduces AKAP150. A, Cultured neurons were incubated in ACSF buffer for 30 min to equilibrate cells before 50 μM NMDA treatment for 5 min (cLTD). Cells were lysed after cLTD induction at indicated times (or 60 min if no time is indicated) in the presence or absence of inhibitors, antagonists, or cell-permeable Ca2+ chelators as indicated in the experimental design scheme. B, Representative blot images showing reduced levels of Ser-845 GluA1 and GluA1 after treatment (cLTD) compared with cells in ACSF buffer. Ser-845 GluA1 levels (pS845-GluA1; ∼110-kDa band, top panel) were related to total GluA1 (GluA1; ∼110-kDa band, middle panel). GAPDH was used as a loading control (∼36-kDa band, bottom panel). C, Quantification of pS845-GluA1 and GluA1 changes in response to NMDA stimulation compared with basal condition (n = 5–17, *p < 0.0001 vs basal). D, Representative blot images showing reduced levels of surface GluA1 after treatment (sGluA1; ∼110-kDa band, top panel) related to total GluA1 (tGluA1; ∼110-kDa band, middle panel). GAPDH was used as a loading control (∼36-kDa band, bottom panel). E, Quantification of surface GluA1 changes in response to cLTD compared with basal condition (n = 6, *p = 0.0310 for 30 min and *p < 0.0001 for 60 min and 120 min vs basal). F, Representative blot images showing reduced levels of AKAP150 after cLTD (∼150-kDa band, top panel) related to GAPDH (bottom panel). G, Quantification of AKAP150 changes in response to cLTD compared with baseline (n = 5–20, *p = 0.0021 for 30 min and *p < 0.0001 for 60 min and 120 min vs basal). H, J, Representative blot images showing the effect of the presence of Ca2+ chelator BAPTA (H; 20 μM) or Ca2+-dependent phosphatase CaN inhibitor FK506 (J; 10 μM) on AKAP150 protein levels after cLTD (top panel) related to β-tubulin (∼51-kDa band, bottom panel) or GAPDH (bottom panel) used as a loading control. I, K, Quantification of AKAP150 changes in response to cLTD in presence of BAPTA (I) or FK506 (K) compared with cLTD treatment (n = 3 in BAPTA experiments, *p = 0.0187 vs basal and #p = 0.0377 vs cLTD, n = 3–10 in FK506 pre-cLTD, *p < 0.0001 vs basal and FK506 post-cLTD experiments, *p = 0.0073 vs basal). Bar represent mean ± SEM.
- Figure 2.
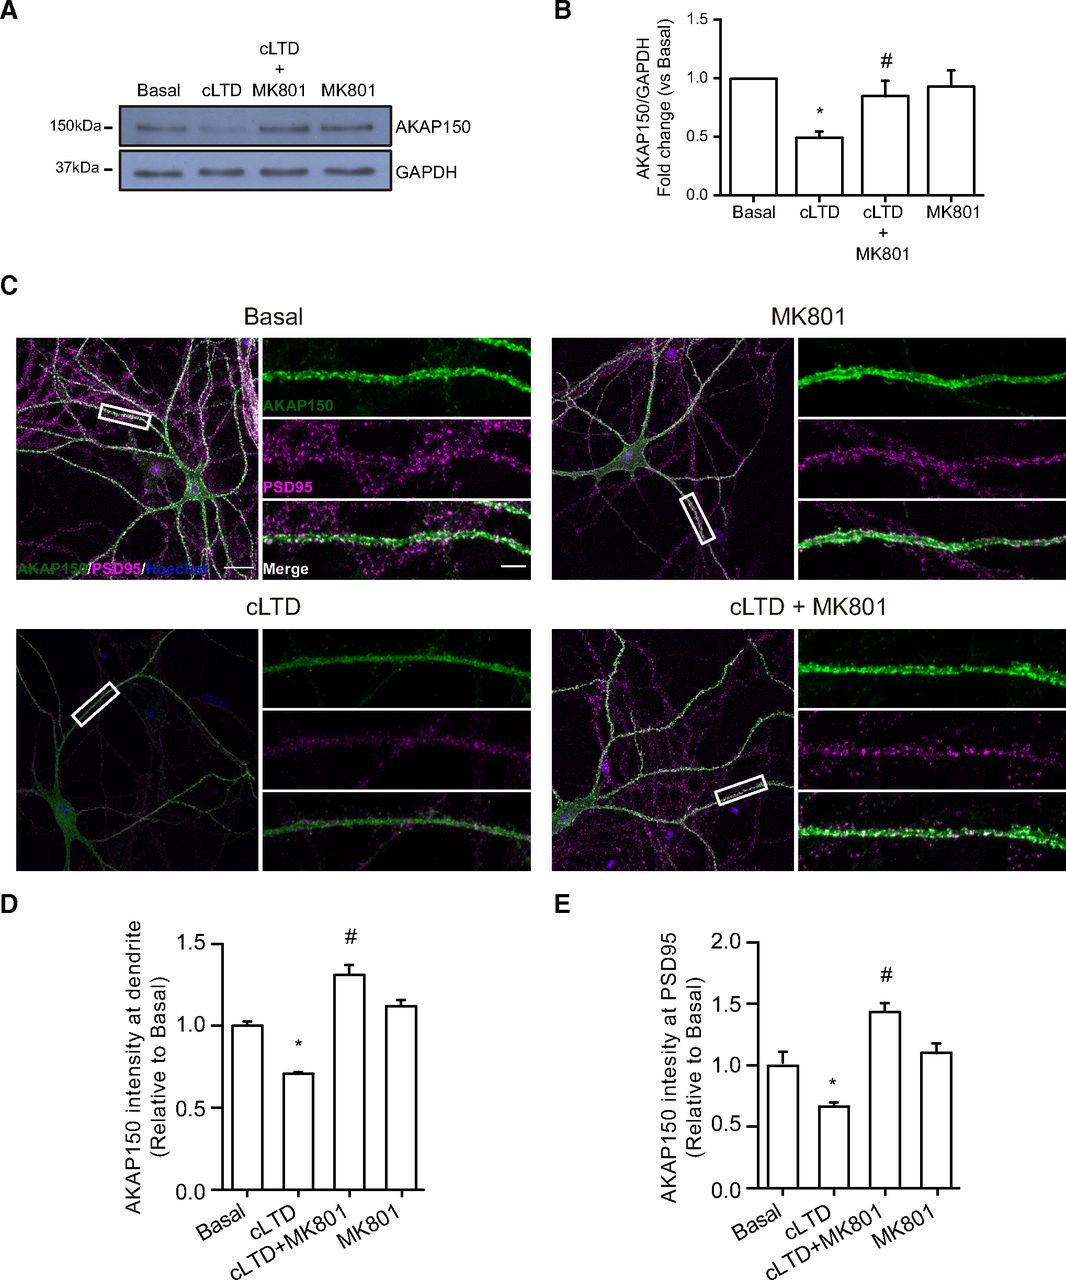
cLTD-mediated reduction of AKAP150 requires calcium influx through NMDA receptors. A, Representative blot images showing the effect of NMDAR antagonist MK801 (10 μM) on AKAP150 protein levels after cLTD (top panel) related to GAPDH (bottom panel) used as a loading control. B, Quantification of AKAP150 changes in response to NMDA stimulation in presence of MK801 compared with cLTD (n = 4, *p = 0.0036 vs basal and #p = 0.0395 vs cLTD). C, Representative confocal images of primary neurons showing AKAP150 (green), postsynaptic marker PSD95 (magenta) and nuclei (blue) staining. Separated color panels for individual marker from the boxed regions have been magnified for dendrite clarity (right panels). Lower right panels show the merge for AKAP150 (green)/PSD95 (magenta), where cLTD reduced dendritic and synaptic intensity in AKAP150 staining. The presence of MK801 (10 μM) blocks this reduction. D, Quantification of AKAP150 intensity at dendrites. cLTD reduced AKAP150 dendritic intensity and the presence of MK801 avoids this reduction (n > 15 dendrites of different neurons from four independent cultures, *p < 0.0001 vs basal; #p < 0.0001 vs cLTD). E, Quantification of AKAP150 intensity at the PSD95. cLTD reduction of synaptic AKAP150 intensity was blocked by MK801 (n > 50 puncta from >15 dendrites from four independent cultures, *p = 0.0150 vs basal; #p < 0.0001 vs cLTD). Scale bars = 20 μm (C, left panels) and 5 μm (C, right panels). Bars represent mean ± SEM.
- Figure 3.
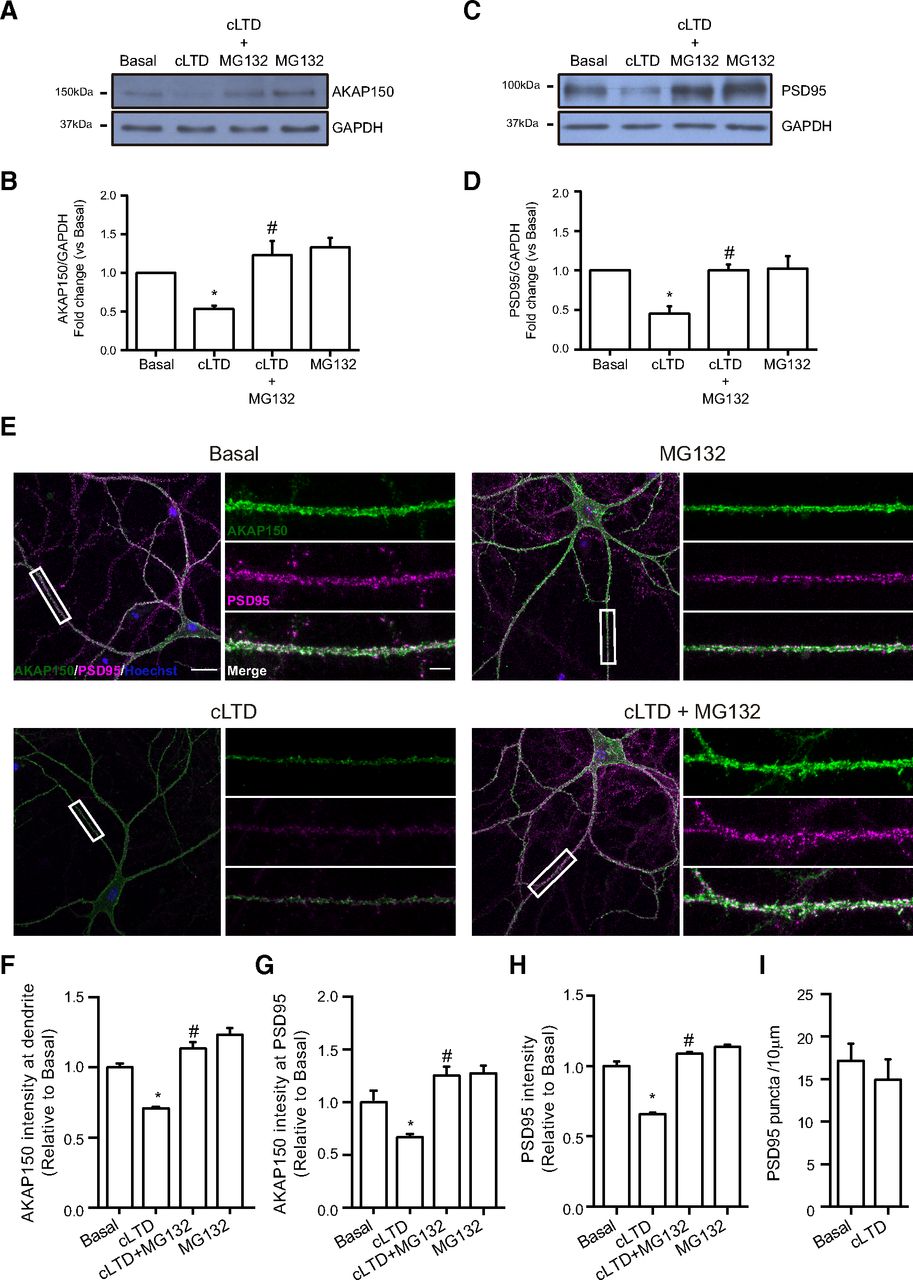
cLTD-mediated reduction of AKAP150 requires proteasome activity. A, Representative blot images showing the effect of proteasome inhibitor MG132 (10 μM) on AKAP150 protein levels after cLTD (top panel) related to GAPDH (bottom panel) used as loading control. B, Quantification of AKAP150 changes in response to NMDA stimulation in presence of MG132 compared with cLTD (for n = 4, *p = 0.0125 vs basal and #p = 0.0014 vs cLTD). C, Representative blot images showing the effect of proteasome inhibitor MG132 (10 μM) on PSD95 protein levels after cLTD (top panel) related to GAPDH (bottom panel) used as loading control. D, Quantification of PSD95 changes in response to NMDA stimulation in presence of MG132 compared with cLTD (for n = 3, *p = 0.0092 vs basal and #p = 0.0091 vs cLTD). E, Representative confocal images of primary neurons showing AKAP150 (green), postsynaptic marker PSD95 (magenta) and nuclei (blue) staining. Separated color panels for individual marker from the boxed regions have been magnified for dendrite clarity (right panels). Lower right panels show the merge for AKAP150 (green)/PSD95 (magenta), where cLTD reduced dendritic and synaptic intensity in AKAP150 staining. The presence of MG132 (10 μM) blocks this reduction. F, Quantification of AKAP150 intensity at dendrites. cLTD reduced AKAP150 dendritic intensity and the presence of MG132 avoids this reduction (n > 15 dendrites of different neurons from four independent cultures, *p < 0.0001 vs basal; #p < 0.0001 vs cLTD). G, Quantification of AKAP150 intensity at the PSD95. cLTD reduction of synaptic AKAP150 intensity was blocked by MG132 (n > 50 puncta from >15 dendrites from four independent cultures, *p = 0.0150 vs basal; #p < 0.0001 vs cLTD). H, Quantification of PSD95 intensity at dendrites. cLTD reduction of PSD95 intensity was blocked by MG132 (n > 15 dendrites of different neurons from four independent cultures, *p = 0.0005 vs basal; #p = 0.0002 vs cLTD). I, Quantification of PSD95 puncta at dendrites normalized to basal. There is no difference in puncta number between basal and cLTD conditions (n > 50 puncta from >15 dendrites from four independent cultures). Scale bars = 20 μm (A, left panels) and 5 μm (A, right panels). Bars represent mean ± SEM.
- Figure 4.
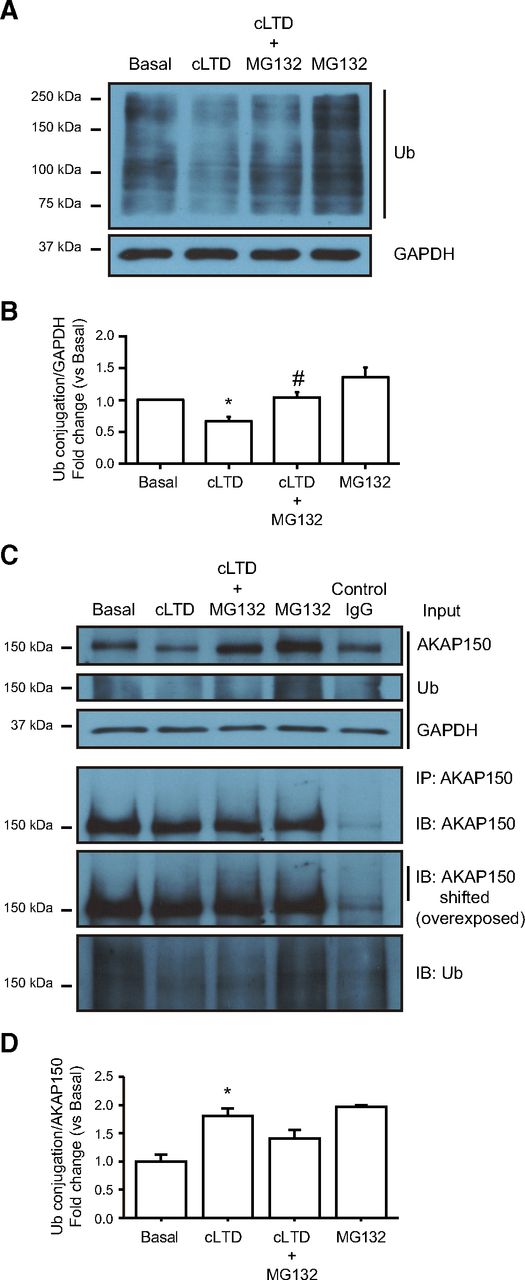
cLTD-mediated AKAP150 degradation requires AKAP150 ubiquitination. A, Representative blot images showing the ubiquitination (Ub) of high molecular weight protein after cLTD (top panel) related to GAPDH (bottom panel) used as a loading control. B, Quantification of total ubiquitination signal in response to cLTD in presence of MG132 (10 μM) compared with cLTD (n = 6, *p = 0.0355 vs basal and #p = 0.0183 vs cLTD). C, Representative blot images showing an increase in AKAP150 ubiquitination after cLTD. Lysates from neurons after cLTD were immunoprecipitated with anti-AKAP150 or control rabbit IgG (control IgG) and blotted with anti-AKAP150 and anti-ubiquitin (Ub). The three top panels show representative blot images (input) for AKAP150 and 150-kDa ubiquitinated proteins (Ub) related to GAPDH (bottom panel of three) used as a loading control. The three bottom panels show representative blot images of immunoprecipitated Ub-AKAP150 protein (IP:AKAP150; including overexposed panel to observe AKAP150-shifted) and total ubiquitination levels (Ub). D, Quantification of ubiquitinated-AKAP150 levels related to total AKAP150 signal in response to cLTD compared with basal (n = 3 for each group, *p = 0.0026 vs basal). Bars represent mean ± SEM.
- Figure 5.
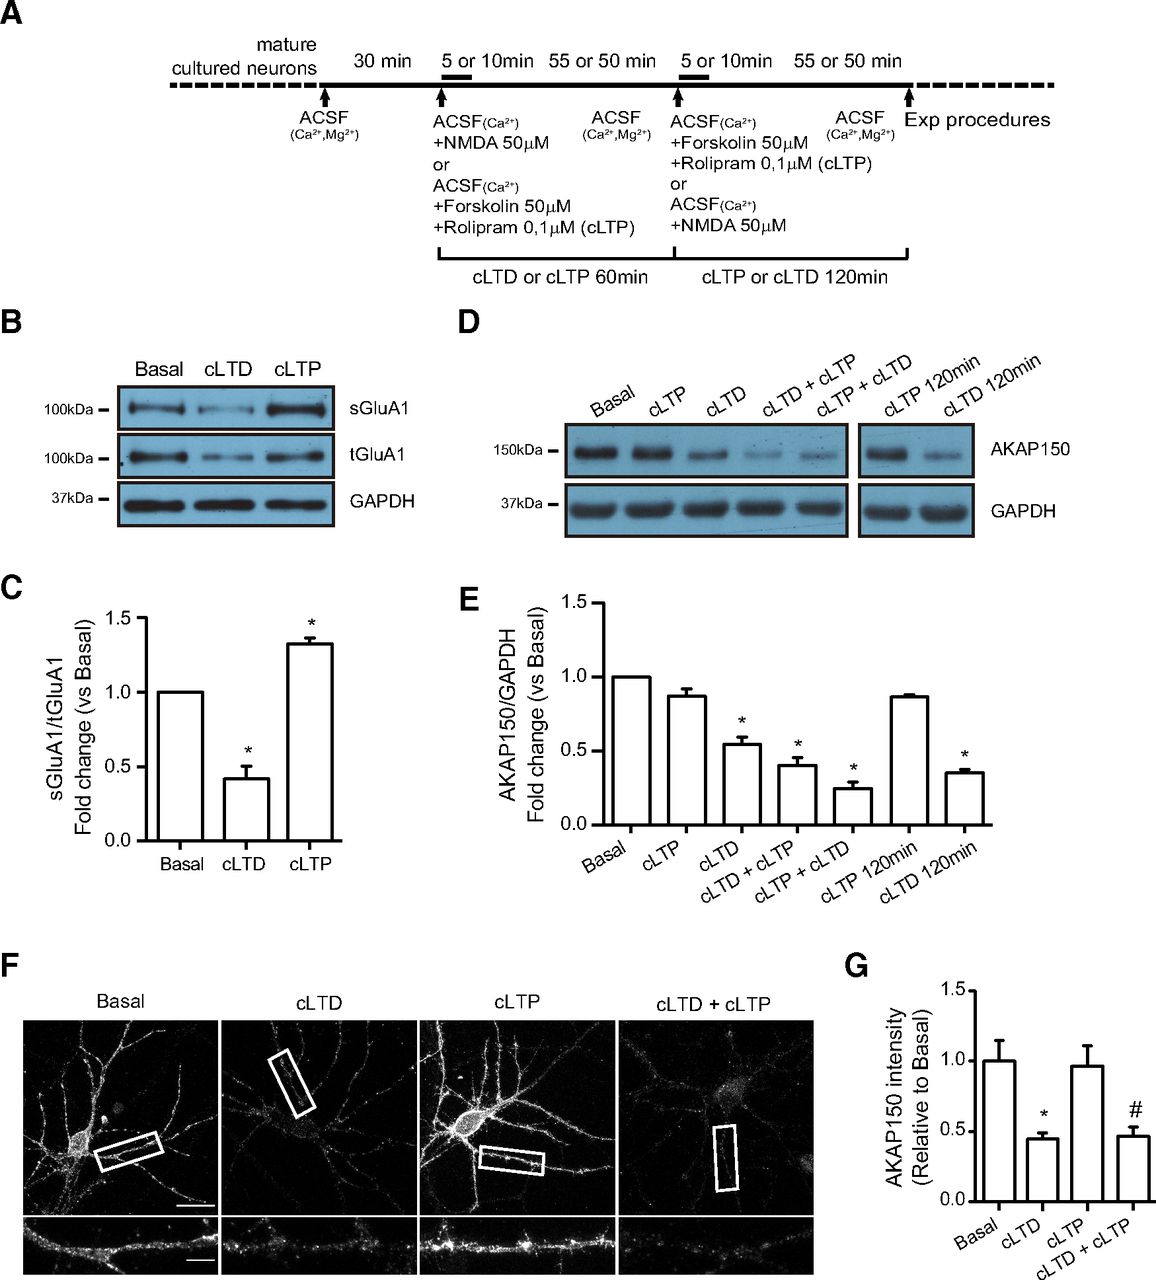
cLTP neither rescue nor prevents cLTD-mediated reduction of AKAP150 levels. A, Hippocampal neurons were cultured during 17–21 DIV. cLTP was induced with forskolin/rolipram (50 μM/0.1 μM) for 60 min (10-min stimulation plus 50-min incubation in ACSF buffer) before or after cLTD as indicated in experimental design scheme. B, Representative blot images showing increased levels of surface GluA1 after cLTP treatment (sGluA1; ∼110-kDa band, top panel) related to total GluA1 (tGluA1; ∼110-kDa band, middle panel). GAPDH was used as a loading control (∼36-kDa band, bottom panel). C, Quantification of surface GluA1 changes in response to cLTD and cLTP compared with basal condition (n = 4–9, *p < 0.0001 for cLTD and *p = 0.0009 for cLTP vs basal). D, Representative blot images showing levels of AKAP150 in response to cLTP before and after cLTD treatment (top panel) and GAPDH (bottom panel) as a loading control. E, Quantification of AKAP150 changes in response to cLTP before and after cLTD treatment compared with basal (n = 3–9, *p < 0.0001 vs basal). F, Dendritic staining for AKAP150 after cLTD with or without cLTP. Representative confocal images showing AKAP150 (gray). Separated panels from the boxed regions have been magnified for dendrite clarity (bottom panels). cLTD reduced AKAP150 staining. The presence of cLTP (50 μM; 0.1 μM) does not rescue AKAP150 levels. G, Quantification of AKAP150 intensity at dendrites normalized to basal condition. cLTD reduced AKAP150 dendritic intensity and cLTP induction does not prevent this reduction (n > 25 dendrites of different neurons from three independent cultures, *p = 0.0004 vs basal; #p = 0.0017 vs basal). Scale bars = 20 μm (F, top panels) and 5 μm (F, bottom panels). Bars represent mean ± SEM.
- Figure 6.
Silencing endogenous AKAP150 reduces AMPARs-GluA1 subunit levels. A, AKAP150 was silenced (sh or shAKAP150) or overexpressed (ov or ovAKAP150) in neuronal cultures after transduction with lentiviral vectors. Representative blot images showing the efficiency of shAKAP150 or ovAKAP150 transduction in primary neurons. Empty lentiviral vector (Ø; pLVTHM or pWPI) was used as a control. B, Silencing AKAP150 does not affect related scaffold proteins like PSD95 (∼95-kDa band) or SAP97 (∼140-kDa band). Representative blot images showing levels of AKAP150 (top panel; as a control of silencing or overexpressing), PSD95 and SAP97 when endogenous AKAP150 was knocked down (shAKAP150) or overexpressed (ovAKAP150). GAPDH (bottom panel) was used as a loading control. C, Quantification of PSD95 or SAP97 levels when AKAP150 was silenced (shAKAP150) or overexpressed (overAKAP150) normalized to basal (n = 4). D, Endogenous AKAP150 silencing reduces S845-GluA1 phosphorylation and total GluA1 protein. Representative blot images showing AKAP150 levels (top panel; as a control of silencing), phosphorylated GluA1 (pS845-GluA1), total GluA1 and GAPDH (bottom panel; loading control). E, Quantification in pS845-GluA1 and GluA1 levels in response to AKAP150 knock-down compared with basal (n = 3, *p = 0.0057 vs basal; #p = 0.0070 vs basal). F, AKAP150 overexpression does not modify S845-GluA1 phosphorylation and total GluA1 protein levels. Representative blot images showing AKAP150 (top panel; as a control of overexpression), phosphorylated GluA1 (pS845-GluA1), total GluA1 and GAPDH (bottom panel; loading control) levels. G, Quantification of pS845-GluA1 and GluA1 in response to AKAP150 overexpression compared with basal (n > 3). H, Representative confocal images of dendrites show GluA1 (magenta), presynaptic VGlut1 (gray), and postsynaptic PSD95 (blue) levels after knocking down AKAP150 compared with basal condition (Ø; empty vector). GFP expression (green) is used as a control of transduction. Down-regulation of endogenous AKAP150 reduced dendritic and synaptic GluA1 intensity. Bottom panels in H show the merge for GFP/GluA1/PSD95/VGlut1. I, Quantification of GluA1 (GluA1) intensity normalized to basal. AKAP150 knockdown expression reduced dendritic (o) and synaptic (ν) GluA1 (n > 30 dendrites of different neurons from five independent cultures, *p < 0.0001 vs basal; #p < 0.0001 vs basal). J, Surface GluA1 levels on cLTD in presence of shAKAP150. Representative blot images showing decreased levels of surface GluA1 after cLTD in presence of shAKAP150 (sGluA1; ∼110-kDa band, top panel) related to total GluA1 (tGluA1; ∼110-kDa band, middle panel). GAPDH was used as a loading control (∼36-kDa band, bottom panel). K, Quantification of surface GluA1 changes in response to cLTD in presence of shAKAP150 compared with basal condition (n = 3, *p = 0.0030 for cLTD, *p = 0.0012 for shAKAP150+cLTD, *p = 0.0018 for empty+cLTD and *p = 0.0141 for shAKAP150 vs basal). L, Quantification of AKAP150 in response to cLTD in presence of shAKAP150 compared with basal condition (n = 3, *p = 0.0080 for cLTD, *p < 0.0001 for shAKAP150+cLTD, *p = 0.0080 for empty+cLTD and *p = 0.0003 for shAKAP150 vs basal). Scale bars = 5 μm. Bars represent mean ± SEM.
- Figure 7.
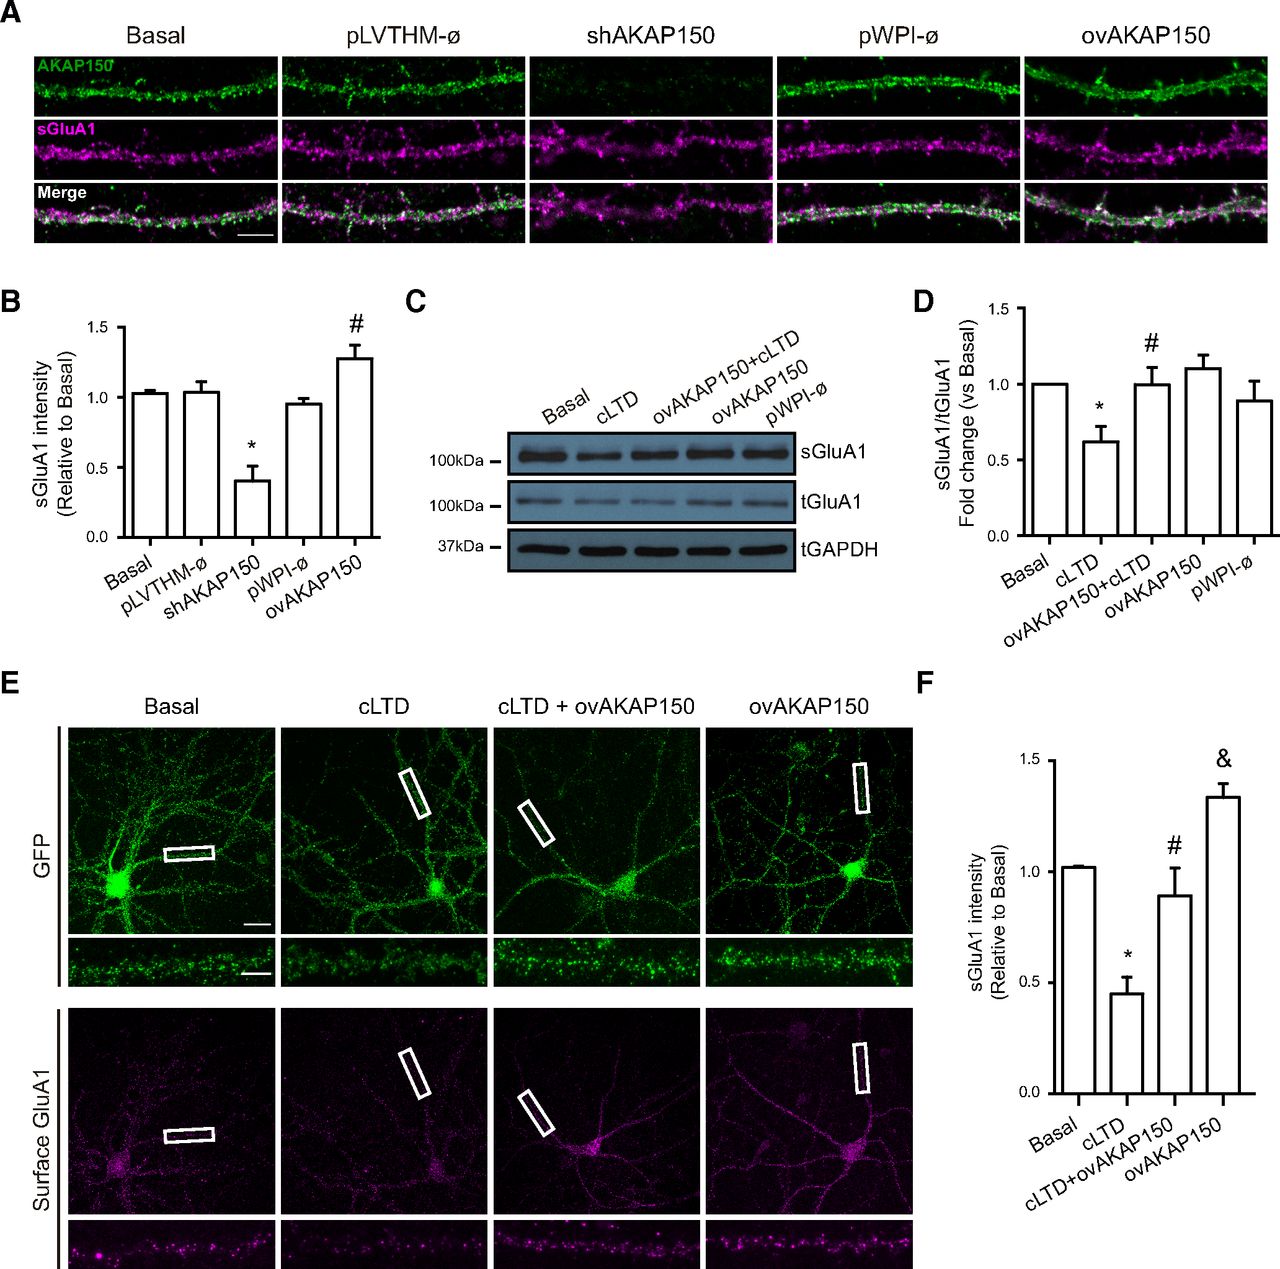
Overexpression of AKAP150 blocked cLTD-mediated GluA1-AMPARs endocytosis. A, Representative confocal images of dendrites showing AKAP150 silencing (shAKAP150) and overexpressing (ovAKAP150) effect on surface GluA1 expression. AKAP150 (green) and surface GluA1 (magenta). Bottom panels, Merge for AKAP150/sGluA1. Knocking down endogenous AKAP150 reduced and AKAP150 overexpression increased surface GluA1 intensity. Empty lentiviral vector (Ø; pLVTHM or pWPI) was used as a control. Scale bar = 5 μm. B, Quantification of surface GluA1 intensity (sGluA1) after silencing or overexpressing AKAP150 (n > 12 dendrites of different neurons from four independent cultures, *p < 0.0001, #p = 0.0419 vs basal). C, cLTD was induced in primary neurons overexpressing AKAP150 and surface proteins were biotinylated and pulled-down. Representative blot images show surface GluA1 (top panel; sGluA1), total GluA1 (middle panel; tGluA1) and GAPDH levels (bottom panel; loading control). D, Quantification of surface GluA1 intensity (sGluA1) in response to cLTD without or with overexpression of AKAP150 compared with basal (n = 6, *p = 0.0173 vs basal; #p = 0.0185 vs cLTD). E, Representative confocal images show surface GluA1 and GFP staining on primary neurons overexpressing AKAP150 after cLTD induction. Separated panels from the boxed regions have been magnified for dendrite clarity (bottom panels). AKAP150 overexpression prevents cLTD-dependent surface GluA1 reduction compared with control cells expressing GFP. F, Quantification of surface GluA1 intensity (sGluA1) in response to cLTD without or with overexpression of AKAP150 (n = 10 dendrites from 10 independent cultures, *p < 0.0001 vs basal; #p = 0.0016 vs cLTD; &p = 0.0285 vs basal). Scale bars = 20 μm (top panels) and 5 μm (bottom panels). Bars represent mean ± SEM.
- Figure 8.
Model for LTD-mediated AKAP150 degradation through the proteasome system. Under basal conditions, a pool of palmitoylated AKAP150 is anchoring and regulating PKA and CaN function in dendritic spines. After LTD induction, a weak and extended Ca2+ influx depalmitoylate and remove AKAP150 from spines. This removal promotes CaN-mediated dephosphorylation and consequent endocytosis of GluA1-AMPARs. During this process AKAP150 is ubiquitinated and degraded via proteasome. The presence of 20S proteasome inhibitor MG132 blocks not only LTD-mediated AKAP150 degradation but also its removal from spines. Maintenance of AKAP150 levels is sufficient to prevent LTD-induced GluA1-AMPARs endocytosis suggesting that AKAP150 degradation by the proteasome could be an important factor in the regulation of surface GluA1-AMPARs at spines.


Extended Data
Statistical Table
Supplementary Statistical Table. Download Statistical Table, DOCX file.
In this issue


