

Article Figures & Data
Figures
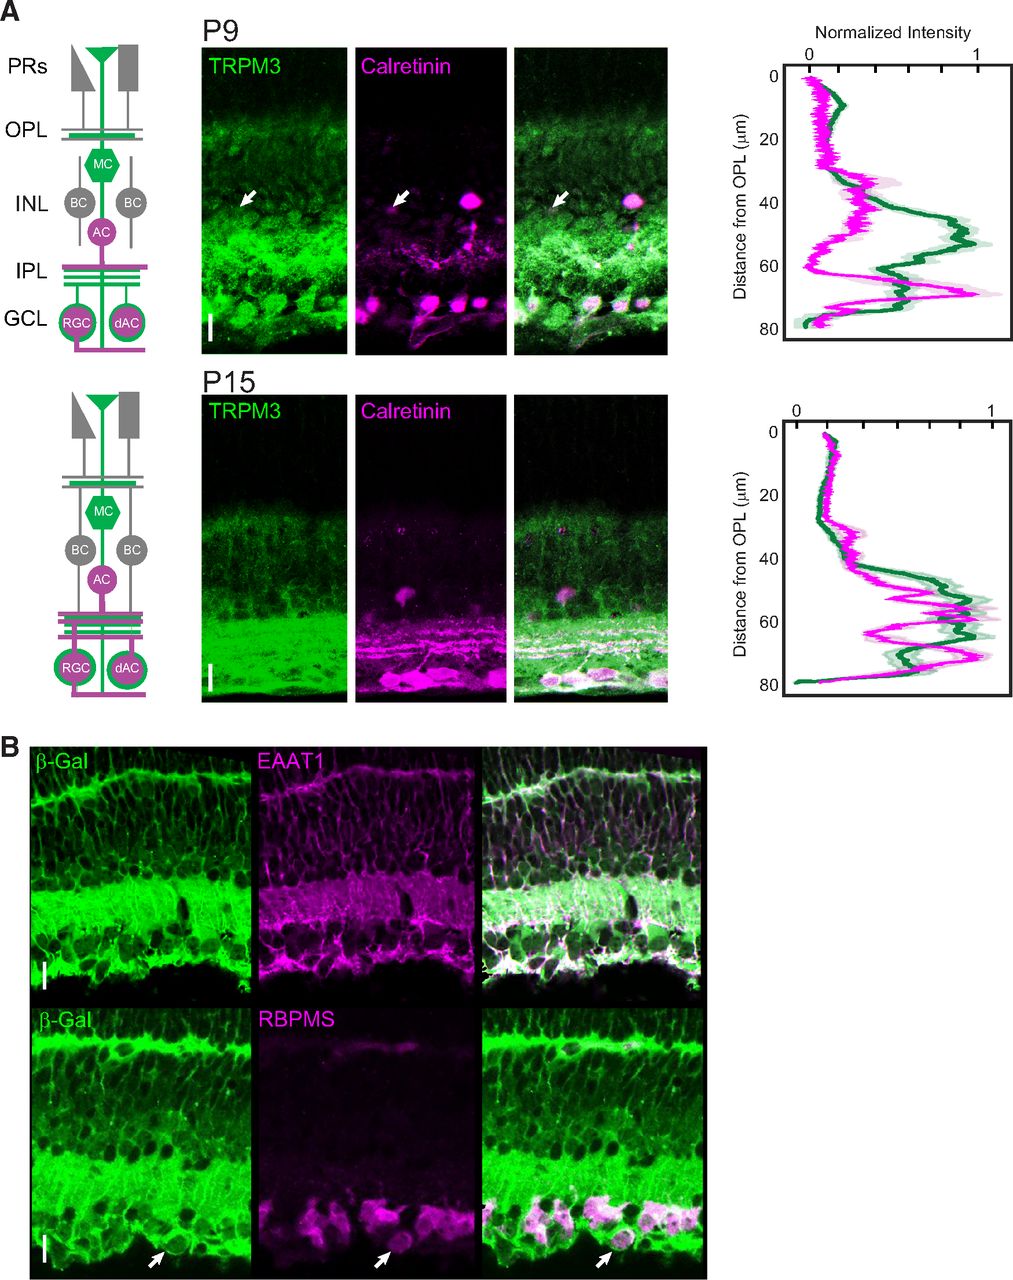
- Figure 1.
TRPM3 expression in postnatal retina. A, left, Schematic of retinal circuit at P9 and P15. Middle, Immunofluorescence for TRPM3 and calretinin at two developmental ages. Calretinin is present in ACs, dACs, and some RGCs. White arrow, A TRPM3 immuno-positive putative AC. Right, Image intensity as a function of distance along the cross-section from the OPL for both TRPM3 (green) and calretinin (magenta). Bold lines are the average intensity from six ROIs and the light regions represent SD. Scale bar: 20 μm. B, TRPM3 reporter co-localizes with Müller glia and RGCs. P12 TRPM3+/− retinas containing a β-Gal cassette in place of exon 17 of the coding sequence of TRPM3 were used to identify cells that express TRPM3 by immunofluorescence. Top, β-Gal co-localizes with EAAT1, a marker for Müller glia. Bottom, β-Gal is also present in the RGC layer, co-localizing with the RGC label, RBPMS (white arrow). PR: photoreceptors; MC: Müller cell; BC: bipolar cell; AC: amacrine cell; dAC: displaced amacrine cell; RGC: retinal ganglion cell; OPL: outerplexiform layer; INL: inner nuclear layer, IPL: inner plexiform layer.
- Figure 2.
Activation of TRPM3 induced prolonged calcium transients in a subset of RGCs. A, Maximum intensity projection of the RGC layer after loading with Cal-520 AM calcium indicator. Red overlay, Cells that exhibited prolonged calcium transients during drug application. Scale bars: 50 μm. B, Representative ΔF/F traces. Red portions, Prolonged calcium transients. C, Comparison of proportion of cells that exhibited prolonged calcium transients. SB = synaptic blockers (50 μM D-AP5, 20 μM DNQX, 8 μM DHβE, 4 μM strychnine, and 5 μM gabazine); p values are from Tukey–Kramer post hoc tests following a two-way ANOVA (there was a significant interaction between drug and genotype: F = 6, p = 0.021); N = 13 experiments from 7 mice (WT, PS); N = 10 experiments from 6 mice (KO PS); N = 8 experiments from 4 mice (WT CIM); N = 3 experiments from 2 mice (KO CIM); and N = 4 experiments from 2 mice (WT, CIM+ SB). For all figures, *p < 0.05 and **p < 0.005. D, Onset of prolonged transients are correlated with waves. Left, Proportion of cells exhibiting a prolonged transient throughout an example movie. Note that many cells initiate prolonged transients at the onsets of waves (blue lines). Middle, Latencies between prolonged transient initiations and the most recent wave drawn from real initiation times compared with latencies of between randomized initiation times drawn from a uniform distribution and the most recent wave; N = 900 cells from 13 experiments on 7 mice. Right, Proportion of cells with a prolonged transient initiation <2 s after the initiation of a wave compared, for each experiment, between real and randomized prolonged transient initiation times. Same dataset as E. E, left, Example simultaneous current clamp recording from RGC and two-photon calcium imaging in ganglion cell layer during bath application of TRPM3 agonist CIM. In this cell, there was a small tonic depolarization associated with bath application of CIM. Right, Two example voltage clamp recordings from RGCs during bath application of PregS. In example cell 1, there is a tonic inward current associated with PregS, while in example cell 2, there was no change in holding current. Summary data provided in main text. F, Prolonged calcium transients correlated with expression of cFOS. Left, Representative images of immunohistochemistry staining against the immediate early gene product c-Fos (green). Images are maximum intensity projections through the ganglion cell layer of TRPM3 Het or KO retinas exposed to 50 μm PregS. Scale bar: 20 μm. Right, Proportion of c-Fos+ cells relative to the total number of DAPI+ cells (n = 2 retinas from 2 mice per experimental group; n = 293 cells for WT Ctrl., n = 322 cells for WT PS, n = 289 cells for KO Ctrl., and n = 330 cells for KO PS). ANOVA with Tukey HSD, **p < 0.01, *p < 0.05.
- Figure 3.
Addition of PregS increased the frequency but not amplitude of sEPSCs and sIPSCs onto RGCs. A, Example spontaneous PSCs recorded from a RGC in control conditions and in the presence of 50 μm PregS. Left, Cell is held at −60 mV to isolate sEPSCs. Right, Cell is held at 0 mV to isolate sIPSCs. Black = control conditions, blue = PregS. B, Cumulative probability distribution of interevent interval and amplitude of sEPSCs (left) and sIPSCs (right). Black = control conditions, blue = PregS. C, Summary of the effects of PregS on frequency and amplitude of PSCs (n = 9 RGCs in each condition from 8 mice for EPSCs and 7 mice for IPSCs), line = average. ANOVA with Tukey HSD, ** p < 0.01, * p < 0.05. Values for outliers shown in parentheses. D, Same as C for PSCs recorded in RGCs in TRPM3 KO mice (n = 6 RGCs in each condition, 3 mice for EPSCs and 5 mice for IPSCs). E, Summary of fold change of PregS on PSC amplitude and frequency comparing WT and TRPM3 KO mice. ANOVA with Tukey HSD, **p < 0.01, *p < 0.05.
- Figure 4.
PregS modulates retinal waves via a TRPM3-independent mechanism. A, Representative ΔF/F traces. B, Comparison of wave properties before and after bath application of 50 μM PregS (PS) in WT and TRPM3 heterozygous (Het) mice (n = 13 experiments in 7 mice; 6 WT and 1 Het); p values in B, C are from paired t tests. C, Same as B but for TRPM3 KO mice (n = 10 experiments in 5 mice). D, Comparison between genotypes of the extent of modulation of wave properties by bath application of PregS. Same dataset as B, C. E, Comparison of wave properties between genotypes (n = 25 experiments in 10 mice, 9 WT and 1 Het; n = 21 experiments in 7 KO mice).


In this issue


