
Main menu

  • HOME
  • CONTENT
    • Early Release
    • Featured
    • Current Issue
    • Issue Archive
    • Blog
    • Collections
    • Podcast
  • TOPICS
    • Cognition and Behavior
    • Development
    • Disorders of the Nervous System
    • History, Teaching and Public Awareness
    • Integrative Systems
    • Neuronal Excitability
    • Novel Tools and Methods
    • Sensory and Motor Systems
  • ALERTS
  • FOR AUTHORS
  • ABOUT
    • Overview
    • Editorial Board
    • For the Media
    • Privacy Policy
    • Contact Us
    • Feedback
  • SUBMIT

User menu

Search

  • Advanced search
eNeuro
eNeuro

Advanced Search


  • HOME
  • CONTENT
    • Early Release
    • Featured
    • Current Issue
    • Issue Archive
    • Blog
    • Collections
    • Podcast
  • TOPICS
    • Cognition and Behavior
    • Development
    • Disorders of the Nervous System
    • History, Teaching and Public Awareness
    • Integrative Systems
    • Neuronal Excitability
    • Novel Tools and Methods
    • Sensory and Motor Systems
  • ALERTS
  • FOR AUTHORS
  • ABOUT
    • Overview
    • Editorial Board
    • For the Media
    • Privacy Policy
    • Contact Us
    • Feedback
  • SUBMIT
PreviousNext
Research ArticleResearch Article: New Research, Cognition and Behavior

Induction of LTM following an Insulin Injection

Yuki Totani, Junko Nakai, Varvara E. Dyakonova, Ken Lukowiak, Manabu Sakakibara and Etsuro Ito
eNeuro 14 April 2020, 7 (2) ENEURO.0088-20.2020; https://doi.org/10.1523/ENEURO.0088-20.2020
Yuki Totani
1Department of Biology, Waseda University, Tokyo 162-8480, Japan
  • Find this author on Google Scholar
  • Find this author on PubMed
  • Search for this author on this site
  • ORCID record for Yuki Totani
Junko Nakai
1Department of Biology, Waseda University, Tokyo 162-8480, Japan
  • Find this author on Google Scholar
  • Find this author on PubMed
  • Search for this author on this site
  • ORCID record for Junko Nakai
Varvara E. Dyakonova
2Koltzov Institute of Developmental Biology, Russian Academy of Sciences, Moscow 119334, Russia
  • Find this author on Google Scholar
  • Find this author on PubMed
  • Search for this author on this site
  • ORCID record for Varvara E. Dyakonova
Ken Lukowiak
3Hotchkiss Brain Institute, University of Calgary, Calgary, Alberta T2N 4N1, Canada
  • Find this author on Google Scholar
  • Find this author on PubMed
  • Search for this author on this site
  • ORCID record for Ken Lukowiak
Manabu Sakakibara
4Research Organization for Nano & Life Innovation, Waseda University, Tokyo 162-8480, Japan
  • Find this author on Google Scholar
  • Find this author on PubMed
  • Search for this author on this site
  • ORCID record for Manabu Sakakibara
Etsuro Ito
1Department of Biology, Waseda University, Tokyo 162-8480, Japan
4Research Organization for Nano & Life Innovation, Waseda University, Tokyo 162-8480, Japan
5Graduate Institute of Medicine, School of Medicine, Kaohsiung Medical University, Kaohsiung 80756, Taiwan
  • Find this author on Google Scholar
  • Find this author on PubMed
  • Search for this author on this site
  • ORCID record for Etsuro Ito
  • Article
  • Figures & Data
  • Info & Metrics
  • eLetters
  • PDF
Loading

Article Figures & Data

Figures

  • Tables
  • Figure1
    • Download figure
    • Open in new tab
    • Download powerpoint
  • Figure 1.
    • Download figure
    • Open in new tab
    • Download powerpoint
    Figure 1.

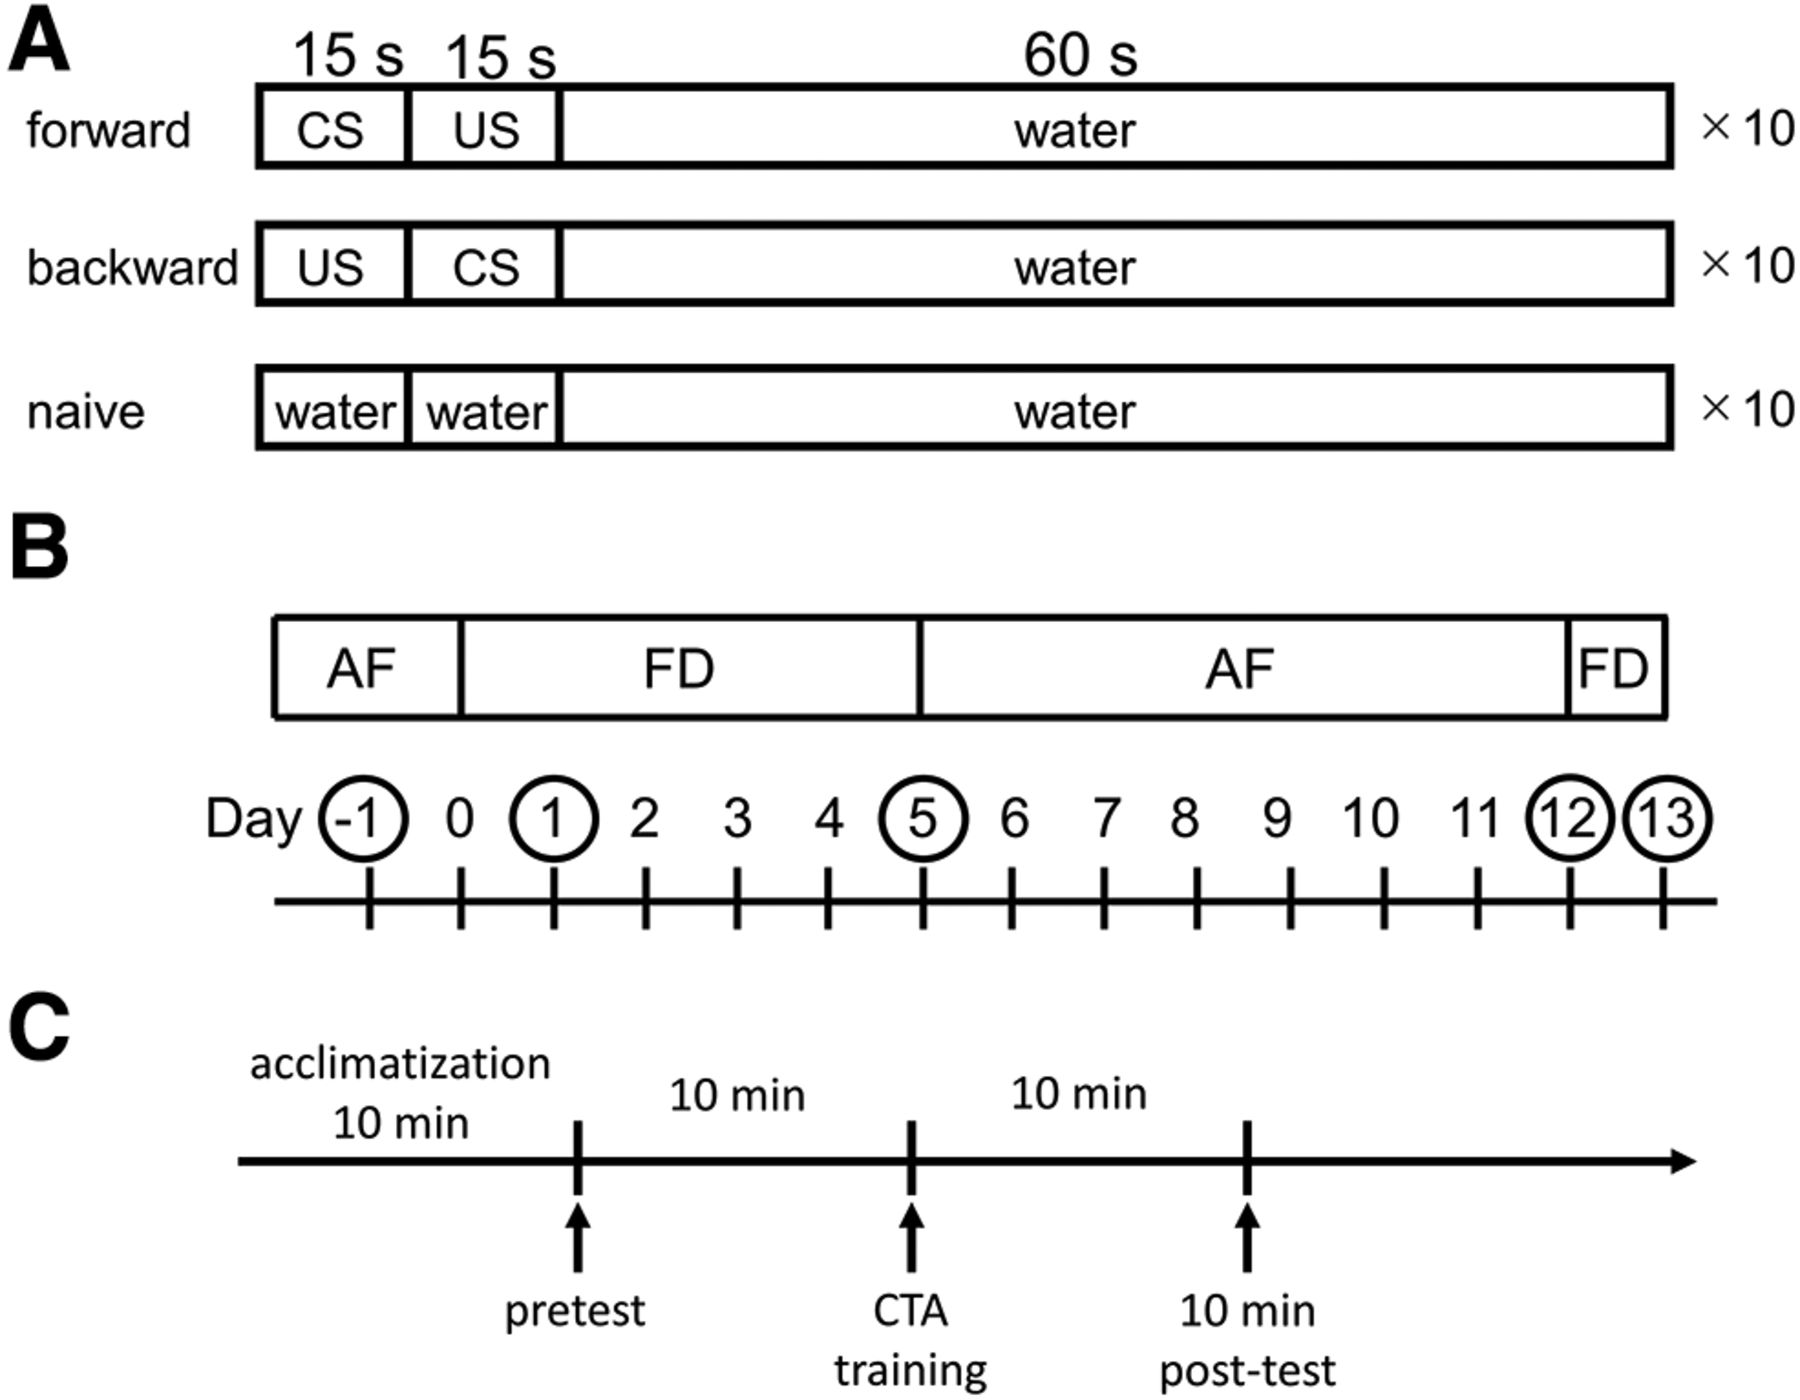
    The CTA training procedures and time lines of food deprivation. A, All snails were first given a pretest 10 min before the training. In this observation period (1 min), the feeding responses (i.e., number of bites) were counted following a 15-s application of 100 mm sucrose (the CS) to the lip of the snail. For taste aversion training, the 100 mm sucrose CS was paired with the 200 mm KCl US. The interstimulus interval was 15 s between the onset of the CS and US. A 90-s ITI was interposed between each pairing of the CS-US. Snails received 10 paired CS-US trials on a single day. Controls included a backward-conditioned (US-CS) group and a naive group to validate associative learning. For the naive control group, only water was applied to the lips instead of the CS and US. In the post-test sessions, snails were again challenged with the CS, and the number of bites was recorded in the 1-min interval after a 15-s application of the CS. B, Food-deprivation status was defined in the following manner: (1) the day when snails began food deprivation is called day 0; (2) day −1 snails had ad libitum access to food (AF), that is, they were not food deprived (FD); (3) day 1 and day 5 snails were food deprived for 1 and 5 d, respectively, after food deprivation, had ad libitum access to food (AF); (4) day 12 snails had ad libitum access to food for 7 d following training on day 5; and (5) day 13 snails were food deprived for an additional 1 d following 7 d of ad libitum access to food. C, Snails were first placed in the test chamber for 10 min to acclimate to the training apparatus. Following the acclimatization, a pretest session was performed, and 10 min after the pretest, CTA training was performed. After CTA training, several post-test sessions were performed to verify the memory expression.

  • Figure 2.
    • Download figure
    • Open in new tab
    • Download powerpoint
    Figure 2.

    Memory formation in day 1, day 5, and day 13 cohorts of snails. The experimental schedule for each cohort of snails is shown at the top of figures. A, The number of bites elicited by the CS (a 100 mm sucrose solution) in 1 min in the pretest session and the post-test sessions for day 1 snails are shown. The feeding response to the CS in the forward conditioned group was significantly reduced at the three memory test sessions (10 min, 1 d, and 7 d), compared with those observed for the backward-conditioned and naive control snails (two-way ANOVA, n = 10 each, F(6,81) = 8.79, p < 0.0001 for interaction, F(2,81) = 29.5, p < 0.0001 for conditioning, F(3,81) = 11.6, p < 0.0001 for test, Holm post hoc test **p < 0.01). B, As in A except the training and testing were performed on the day 5 snails (5 d of food deprivation before CTA training). Learning and memory are not expressed on the three post-training tests (10 min, 1 d, and 7 d; two-way ANOVA, n = at least 6, F(6,57) = 0.50, p = 0.80 for interaction, F(2,57) = 1.18, p = 0.33 for conditioning, F(3,57) = 1.47, p = 0.23 for test). C, As in A, B except that after the 10-min memory test snails were given ad libitum access to food for 7 d. Snails were thus tested for memory following this 7-d period. No LTM was observed. Finally, snails were given a single day of food deprivation, and memory was tested the following day. LTM was now observed (i.e., day 13 snails; two-way ANOVA, n = 10 each, F(6,81) = 2.27, p = 0.045 for interaction, F(2,81) = 4.29, p = 0.024 for conditioning, F(3,81) = 2.41, p = 0.073 for test, Holm post hoc test *p = 0.031 for forward vs backward; *p = 0.024 for forward vs naive). The error bars indicate SEM.

  • Figure 3.
    • Download figure
    • Open in new tab
    • Download powerpoint
    Figure 3.

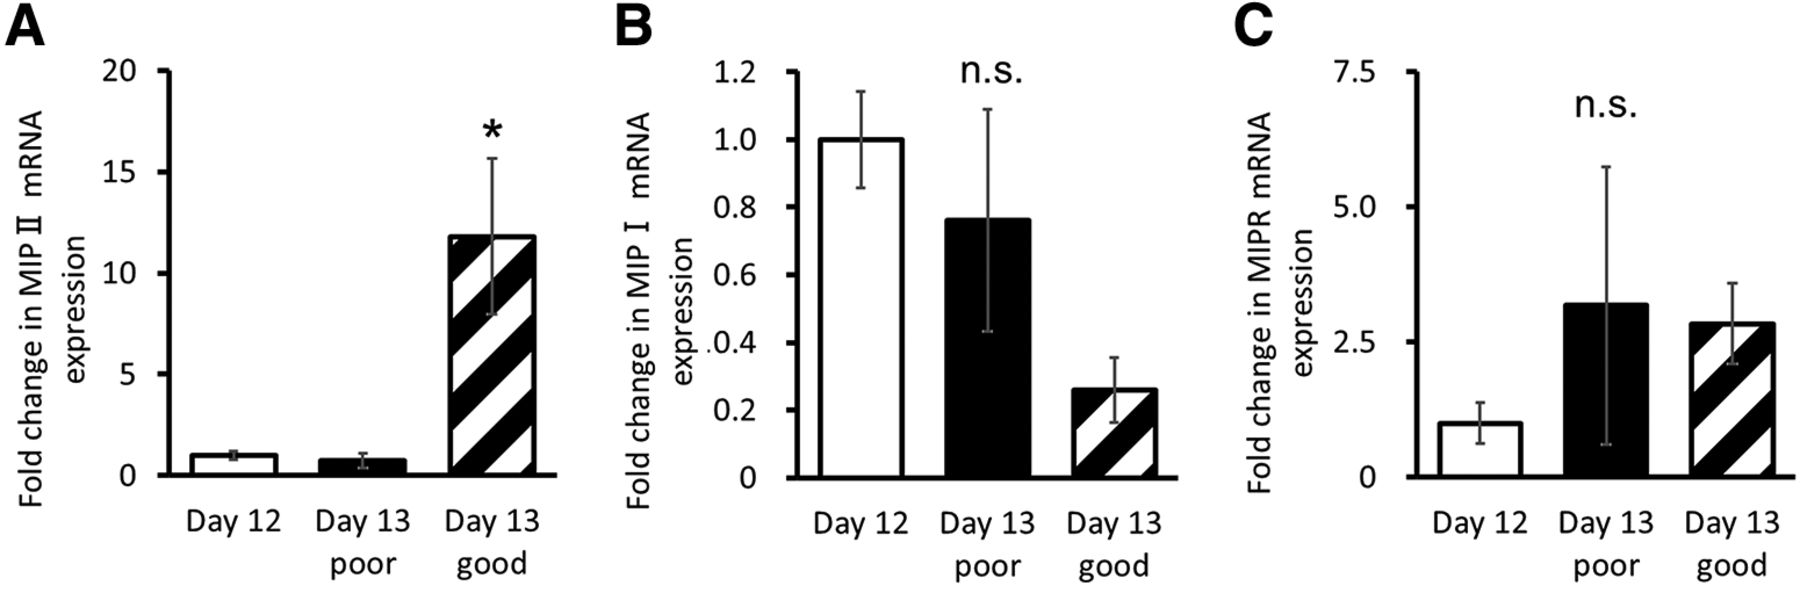
    Real-time PCR of MIP II, MIP I, and MIPR mRNA expression in the CNS of day 12 and day 13 good and poor snails. The data were normalized by the mRNA amounts of HSP40 and GPx. A, MIP II mRNA level was significantly increased in day 13 good learner CNS (one-way ANOVA, n = 5 each, F(2,12) = 7.95, p = 0.0063, Holm post hoc test *p = 0.013 for day 13 good vs day 12; p = 0.0133 for day 13 good vs day 13 poor). B, C, There was no significant difference in the MIP I and MIPR mRNA levels among day 12, day 13 poor learners, and day 13 good learners (one-way ANOVA, n = 5 each, MIP I: F(2,12) = 3.11, p = 0.081, MIPR: F(2,12) = 0.56, p = 0.58). The error bars indicate SEM. n.s., not significant.

  • Figure 4.
    • Download figure
    • Open in new tab
    • Download powerpoint
    Figure 4.

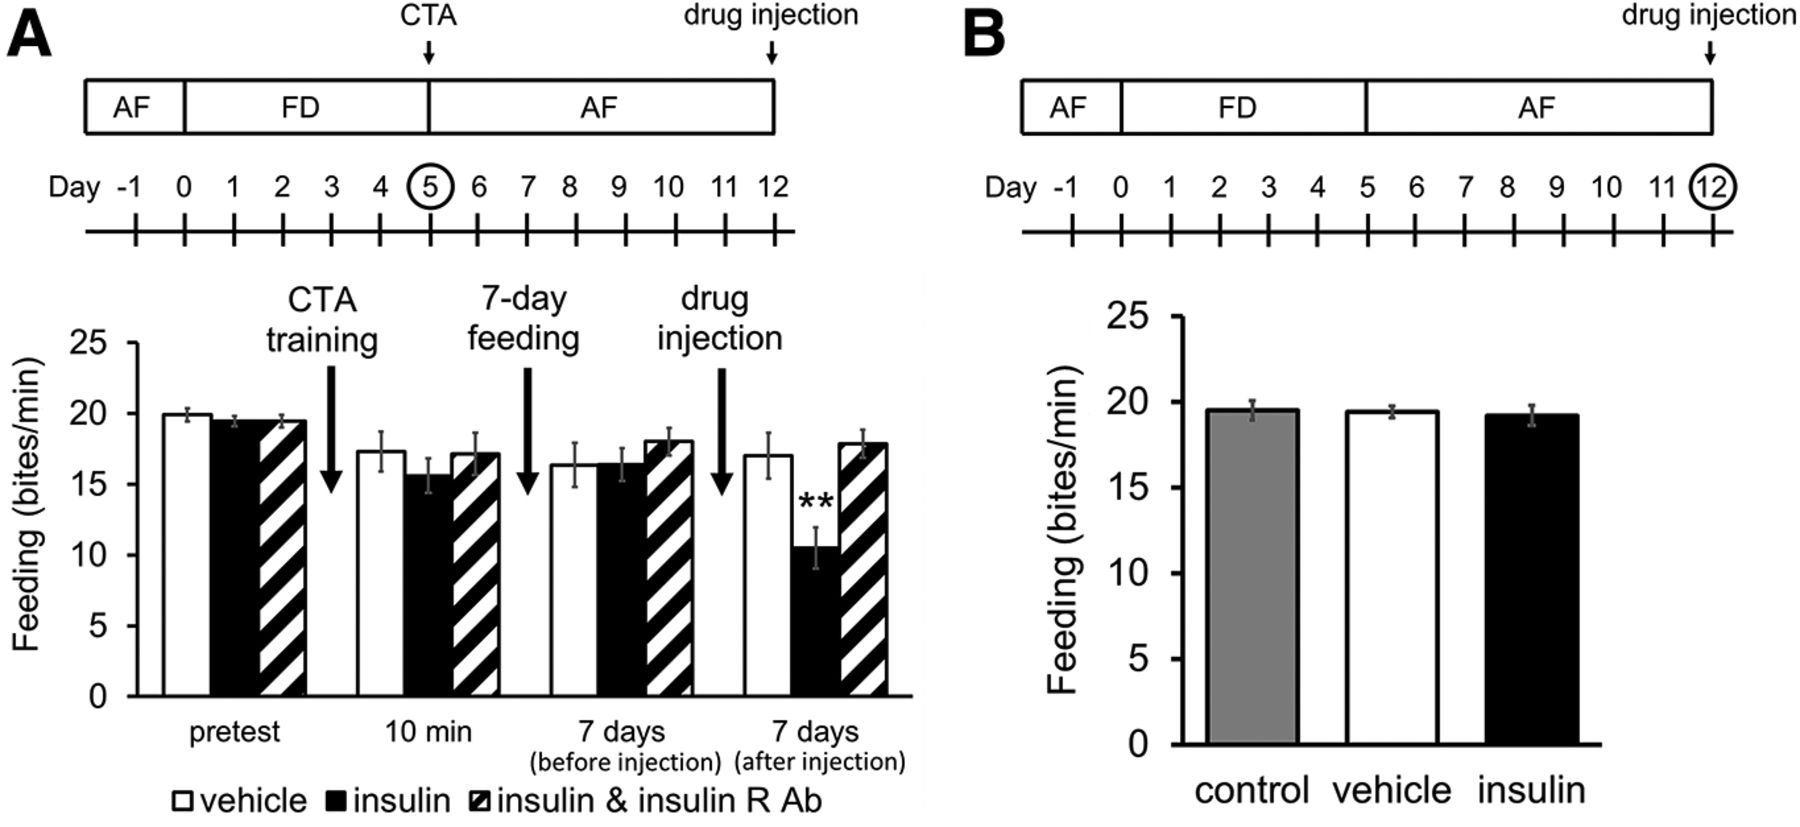
    Insulin injection into day 12 snails and LTM. The experimental schedules are shown at the top of the figures. A, Number of bites elicited by the CS in 1 min in the pretest session and the post-test sessions in day 5 snails following 7 d of ad libitum access to food and 1 h after drug injections in the day 12 snails. LTM was only expressed in day 12 snails that were injected with bovine insulin. Importantly, note that the simultaneous injection of insulin plus the antibody to the insulin receptor did not allow memory to be recalled (two-way ANOVA, n = 40 for insulin injected group and n = 20 for vehicle-injected control and simultaneous injection group, F(6,231) = 3.51, p = 0.0024 for interaction, F(2,231) = 2.97, p = 0.056 for conditioning, F(3,231) = 8.70, p < 0.0001 for test, Holm post hoc test **p = 0.0031 for insulin vs vehicle; p = 0.0049 for insulin vs simultaneous injection). B, The insulin injection did not alter feeding behavior in day 12 naive snails (one-way ANOVA, n = 10 each, F(2,27) = 0.09, p = 0.91). The error bars indicate SEM.

  • Figure 5.
    • Download figure
    • Open in new tab
    • Download powerpoint
    Figure 5.

    The effects of insulin on hemolymph glucose concentration. A, The experimental procedure is shown above the data. Bovine insulin and MIPs injections significantly reduce hemolymph glucose concentrations in eating, day −1, day 1, and day 5 snails. Notice that MIPs also significantly reduce glucose levels but not on the day 5 snails (two-way factorial ANOVA, n = 3 each, F(6,24) = 2.38, p = 0.060 for interaction, F(3,24) = 6.20, p < 0.0029 for food deprivation, F(2,24) = 52.8, p < 0.0001 for treatment, Holm post hoc test *p < 0.05, **p < 0.01). B, Changes in hemolymph glucose concentration in day −1, day 1, day 5, day 12, day 13, and day 12 snails with an insulin injection. There is a significant difference between glucose levels between day 1 and day 5 snails. There are also significant differences in glucose levels between day 12 and day 13 and day 12 insulin-injected snails (one-way ANOVA, n = 10 each, F(5,54) = 13.7, p < 0.0001 Holm post hoc test *p < 0.05, **p < 0.01). The error bars indicate SEM.

Tables

  • Figures
    • View popup
    Table 1

    The primer sequences for real-time PCR amplification of specific Lymnaea stagnalis genes

    Gene nameAccession numberPrimer sequenceProduct size (bp)
    MIP IX06983.1Forward AGCGCTTTGACCTACCTGAC 81
    Reverse ACTCAGTGTGCACGGTTTCA
    MIP IIX59302.1Forward AGAGGGCCAATCATCTTGCAG 77
    Reverse GGAAGCCAGCCAAATTCGAG
    MIPRX84994.1Forward TGACCAGACTGGAACCTGGA 106
    Reverse GGTGGACGTGGCACTATGAA
    HSP40DQ278442.1Forward GGTCTTGAATCCTGATGGACA 104
    Reverse CTTTGGGGAAGGTTATTTTGG
    GPxFJ418796.1Forward TGTAAACGGGACGGAGATTC 118
    Reverse GATCTCGTTTTCCCCATTCA
Back to top

In this issue

eneuro: 7 (2)
eNeuro
Vol. 7, Issue 2
March/April 2020
  • Table of Contents
  • Index by author
  • Ed Board (PDF)
Email

Thank you for sharing this eNeuro article.

NOTE: We request your email address only to inform the recipient that it was you who recommended this article, and that it is not junk mail. We do not retain these email addresses.

Enter multiple addresses on separate lines or separate them with commas.
Induction of LTM following an Insulin Injection
(Your Name) has forwarded a page to you from eNeuro
(Your Name) thought you would be interested in this article in eNeuro.
CAPTCHA
This question is for testing whether or not you are a human visitor and to prevent automated spam submissions.
Print
View Full Page PDF
Citation Tools
Induction of LTM following an Insulin Injection
Yuki Totani, Junko Nakai, Varvara E. Dyakonova, Ken Lukowiak, Manabu Sakakibara, Etsuro Ito
eNeuro 14 April 2020, 7 (2) ENEURO.0088-20.2020; DOI: 10.1523/ENEURO.0088-20.2020

Citation Manager Formats

  • BibTeX
  • Bookends
  • EasyBib
  • EndNote (tagged)
  • EndNote 8 (xml)
  • Medlars
  • Mendeley
  • Papers
  • RefWorks Tagged
  • Ref Manager
  • RIS
  • Zotero
Respond to this article
Share
Induction of LTM following an Insulin Injection
Yuki Totani, Junko Nakai, Varvara E. Dyakonova, Ken Lukowiak, Manabu Sakakibara, Etsuro Ito
eNeuro 14 April 2020, 7 (2) ENEURO.0088-20.2020; DOI: 10.1523/ENEURO.0088-20.2020
Twitter logo Facebook logo Mendeley logo
  • Tweet Widget
  • Facebook Like
  • Google Plus One

Jump to section

  • Article
    • Visual Abstract
    • Abstract
    • Significance Statement
    • Introduction
    • Materials and Methods
    • Results
    • Discussion
    • Footnotes
    • References
    • Synthesis
  • Figures & Data
  • Info & Metrics
  • eLetters
  • PDF

Keywords

  • conditioned taste aversion
  • food deprivation
  • glucose
  • insulin
  • Lymnaea

Responses to this article

Respond to this article

Jump to comment:

No eLetters have been published for this article.

Related Articles

Cited By...

More in this TOC Section

Research Article: New Research

  • Deletion of endocannabinoid synthesizing enzyme DAGLα in Pcp2-positive cerebellar Purkinje cells decreases depolarization-induced short-term synaptic plasticity, reduces social preference, and heightens anxiety
  • Release of extracellular matrix components after human traumatic brain injury
  • Action intentions reactivate representations of task-relevant cognitive cues
Show more Research Article: New Research

Cognition and Behavior

  • Visual Stimulation Under 4 Hz, Not at 10 Hz, Generates the Highest-Amplitude Frequency-Tagged Responses of the Human Brain: Understanding the Effect of Stimulation Frequency
  • Transformed visual working memory representations in human occipitotemporal and posterior parietal cortices
  • Neural Speech-Tracking During Selective Attention: A Spatially Realistic Audiovisual Study
Show more Cognition and Behavior

Subjects

  • Cognition and Behavior
  • Home
  • Alerts
  • Follow SFN on BlueSky
  • Visit Society for Neuroscience on Facebook
  • Follow Society for Neuroscience on Twitter
  • Follow Society for Neuroscience on LinkedIn
  • Visit Society for Neuroscience on Youtube
  • Follow our RSS feeds

Content

  • Early Release
  • Current Issue
  • Latest Articles
  • Issue Archive
  • Blog
  • Browse by Topic

Information

  • For Authors
  • For the Media

About

  • About the Journal
  • Editorial Board
  • Privacy Notice
  • Contact
  • Feedback
(eNeuro logo)
(SfN logo)

Copyright © 2025 by the Society for Neuroscience.
eNeuro eISSN: 2373-2822

The ideas and opinions expressed in eNeuro do not necessarily reflect those of SfN or the eNeuro Editorial Board. Publication of an advertisement or other product mention in eNeuro should not be construed as an endorsement of the manufacturer’s claims. SfN does not assume any responsibility for any injury and/or damage to persons or property arising from or related to any use of any material contained in eNeuro.