

Article Figures & Data
Figures
- Figure 1.
A, Timeline of the experiment. Male and female C57BL/6J mice were placed on a CON diet (10% fat) or an HF diet (60% fat) at 9 weeks of age, which was continued for the duration of the experiment. After ∼3 months on the diet, mice were subjected to GTT, then injected with EdU (3×) 2 weeks later. Four weeks after EdU injections, tissue collection was performed. B, Breakdown of the hippocampus into dorsal (approximately −1.06 to approximately −2.06 mm from bregma) and ventral (approximately −2.92 to approximately −3.80 mm from bregma) subregions, which regulate cognitive and affective processes, respectively. Adapted from Tanti and Belzung (2013).
- Figure 2.
A, Cell proliferation in the dentate gyrus, as measured by the mean (±SEM) number of Ki67+ cells per hemisphere per 40 μm slice throughout the whole hippocampus, and in the dorsal and ventral subregions. On a control diet, females had a greater number of Ki67+ cells in the dorsal hippocampus compared with males, while HF diet reduced the number of Ki67+ cells in the dorsal hippocampus of females only. N = 10/group. **p < 0.01. B, Representative images of Ki67 (green) and DAPI (red) immunostaining in the dorsal hippocampus. Estimation statistics for all neurogenesis-related measures can be seen in Extended Data Figure 2-1.
- Figure 3.
A, Number of neuroblasts/immature neurons in the dentate gyrus, as measured by the mean (±SEM) number of DCX+ cells per hemisphere per 40 μm slice throughout the whole hippocampus, and in the dorsal and ventral subregions. B, On a CON diet, females had a greater number of DCX+ cells in the dorsal hippocampus compared with males, while an HF diet reduced the number of DCX+ cells in the dorsal hippocampus of females only. N = 10/group. *p < 0.05, **p < 0.01. B, Representative images of DCX (green) and NeuN (red) immunostaining in the dorsal hippocampus.
- Figure 4.
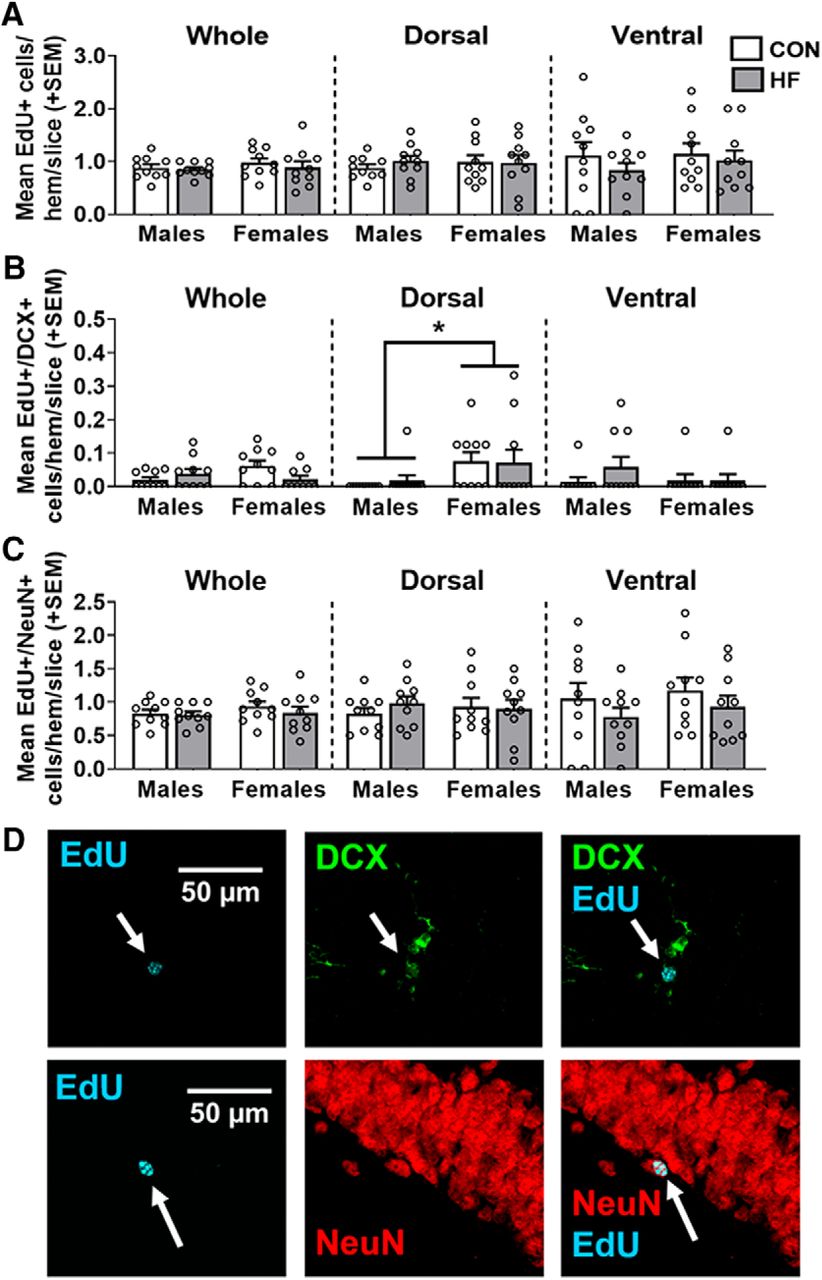
A, Survival of newly born cells in the dentate gyrus, as measured by the mean (±SEM) number of EdU+ cells 28 d post-EdU injection throughout the whole hippocampus and in the dorsal and ventral subregions. There were no group differences in any area measured. B, Newly born cells in the dentate gyrus that differentiated into neuroblasts/immature neurons and survived 28 d post-EdU injection, were measured by the mean (±SEM) number of EdU+/DCX+ cells throughout the whole hippocampus and in the dorsal and ventral subregions. In the dorsal hippocampus, females had a greater number of EdU+/DCX+ cells compared with males, regardless of diet. C, Newly born cells in the dentate gyrus that differentiated into mature neurons and survived 28 d post-EdU injection, were measured by the mean (±SEM) number of EdU+/NeuN+ cells throughout the whole hippocampus and in dorsal and ventral subregions. There were no group differences in any area measured. N = 10/group. *p < 0.05 main effect of sex. D, Representative images of EdU (cyan) alone and colocalized with DCX (green) and NeuN (red).
- Figure 5.
Correlations between metabolic outcomes [weight gain and glucose tolerance (AUC during GTT)] and neurogenesis measures [Ki67+ cells (proliferating cells) and DCX+ cells (neuroblasts/immature neurons)] in the dorsal hippocampus of males (left) and females (right). Mice on both control and high-fat diet are included in these plots. Note the significant inverse associations between metabolic outcomes and neurogenesis in females, but not males. N = 20/sex. *p < 0.05, **p < 0.01.
- Figure 6.
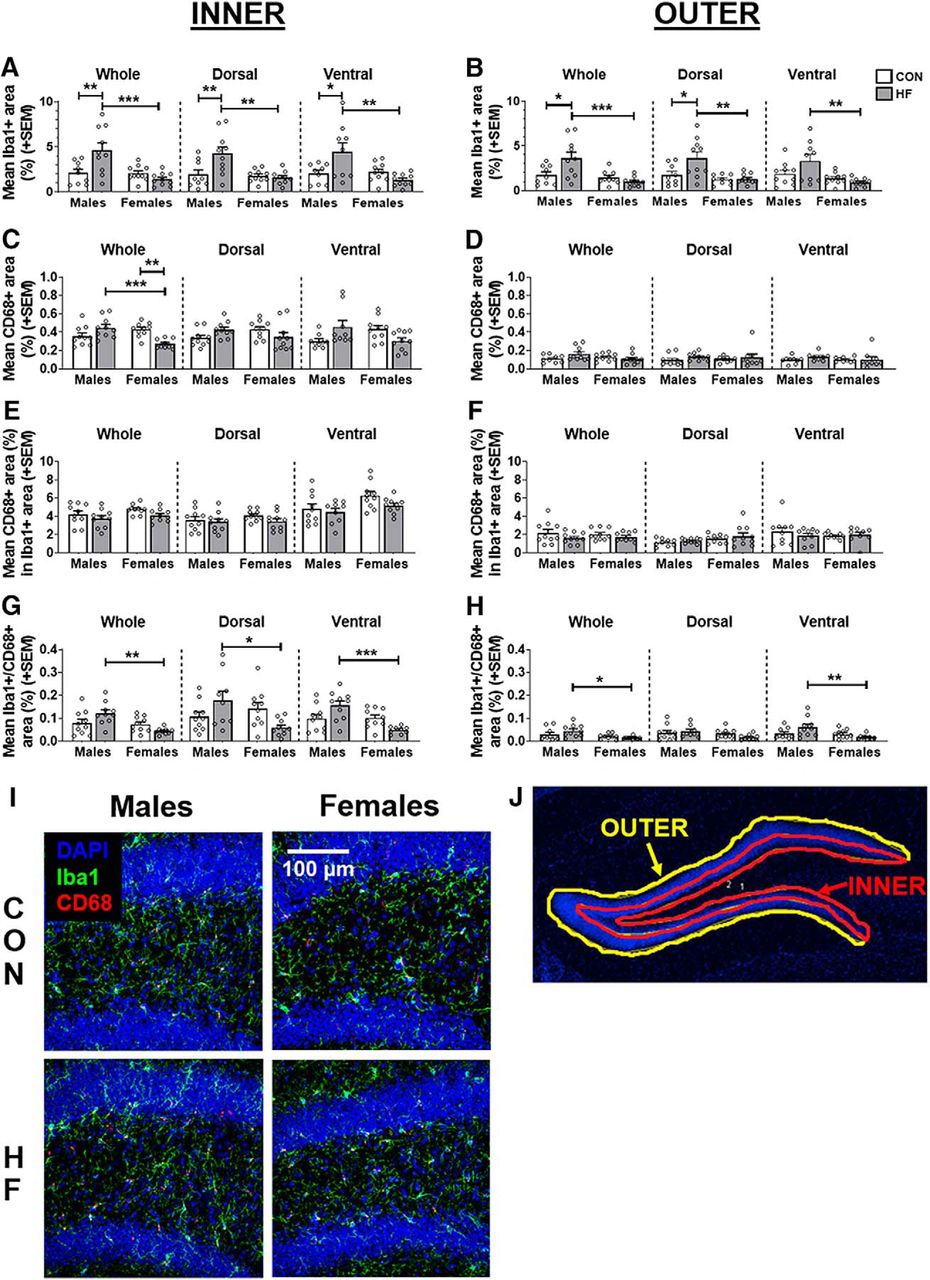
A, B, Microglia density in the inner (A) and outer (B) dentate, as measured by the mean (±SEM) percentage area covered by Iba1+ stain throughout the whole hippocampus and in the dorsal and ventral subregions. C, D, Phagocytic activity in the inner (C) and outer (D) dentate, as measured by the mean (±SEM) percentage area covered by CD68+ stain throughout the whole hippocampus and in the dorsal and ventral subregions. E, F, Relative degree of microglial phagocytic activity in the inner (E) and outer (F) dentate, as measured by the mean (±SEM) percentage of Iba1+ area also positive for CD68 throughout the whole hippocampus and in the dorsal and ventral subregions. G, H, Absolute microglial phagocytic activity in the inner (G) and outer (H) dentate, as measured by the mean (±SEM) percentage area positive for colocalized Iba1 and CD68 throughout the whole hippocampus, and in the dorsal and ventral subregions. N = 10/group. *p < 0.05, **p < 0.01, ***p < 0.001. I, Representative images of Iba1+ (green) and CD68+ (red) cells in the dorsal dentate gyrus. DAPI (blue) counterstaining was used to visualize nuclei, determine position relative to bregma, and create ROIs around the dentate gyrus. J, Representative image of inner and outer ROIs of the dentate gyrus. See Figure 6-1 for estimation statistics performed for microglia-related measures.
- Figure 7.
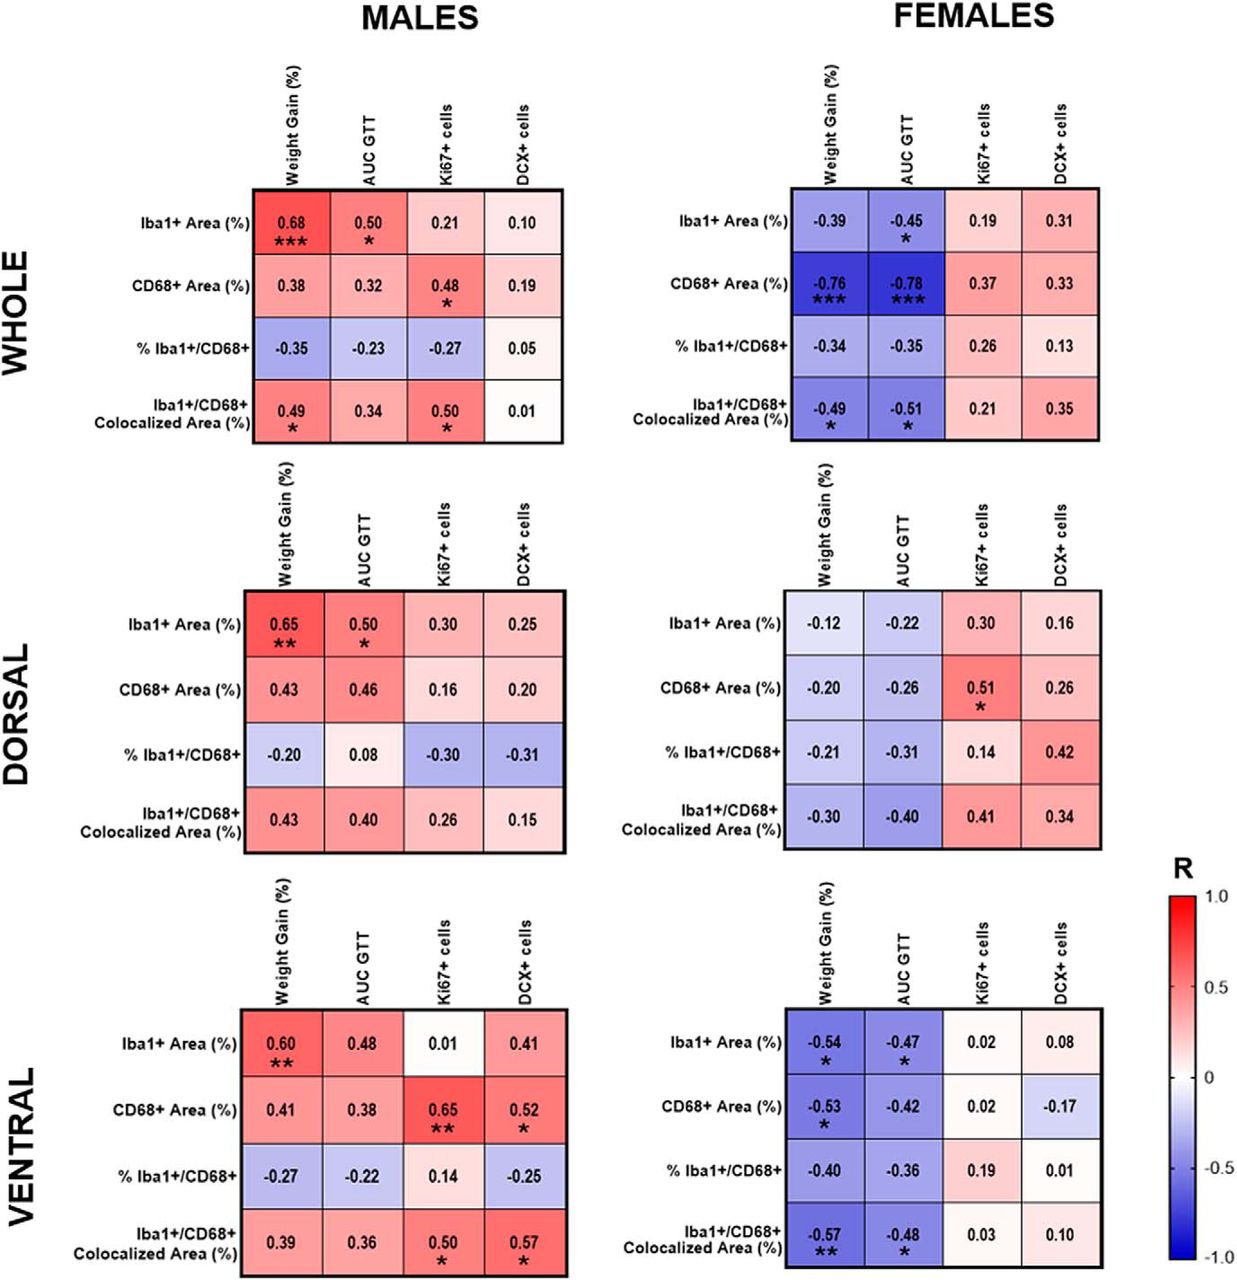
Correlations of microglia measures in the inner dentate with metabolic outcomes and neurogenesis in the whole hippocampus, and in dorsal and ventral subregions of male (left) and female (right) mice. Red indicates positive correlations, and blue indicates negative correlations, with intensity of the color indicative of the strength of the association. *p < 0.05, **p < 0.01.


Extended Data
Figure 2-1
Estimation statistics were performed for neurogenesis-related measures, with data in the table representing the percentage differences between groups and 95% CI values. Values that are bolded/italicized/underlined and highlighted in gray were also found to be statistically significant via hypothesis testing (two-way ANOVA with Tukey’s post hoc test; α = 0.05). M CON, Male CON diet; M HF, male HF diet; F CON, females CON diet; F HF, female HF diet. Download Figure 2-1, XLSX file.
Figure 6-1
Estimation statistics were performed for microglia-related measures, with data in the table representing the percentage differences between groups and 95% CI values. Values that are bolded/italicized/underlined and highlighted in gray were also found to be statistically significant via hypothesis testing (two-way ANOVA with Tukey’s post hoc test; α = 0.05). M CON, Male CON diet; M HF, male HF diet; F CON, females CON diet; F HF, female HF diet. Download Figure 6-1, XLSX file.
In this issue


