

Article Figures & Data
Figures
- Figure 1.
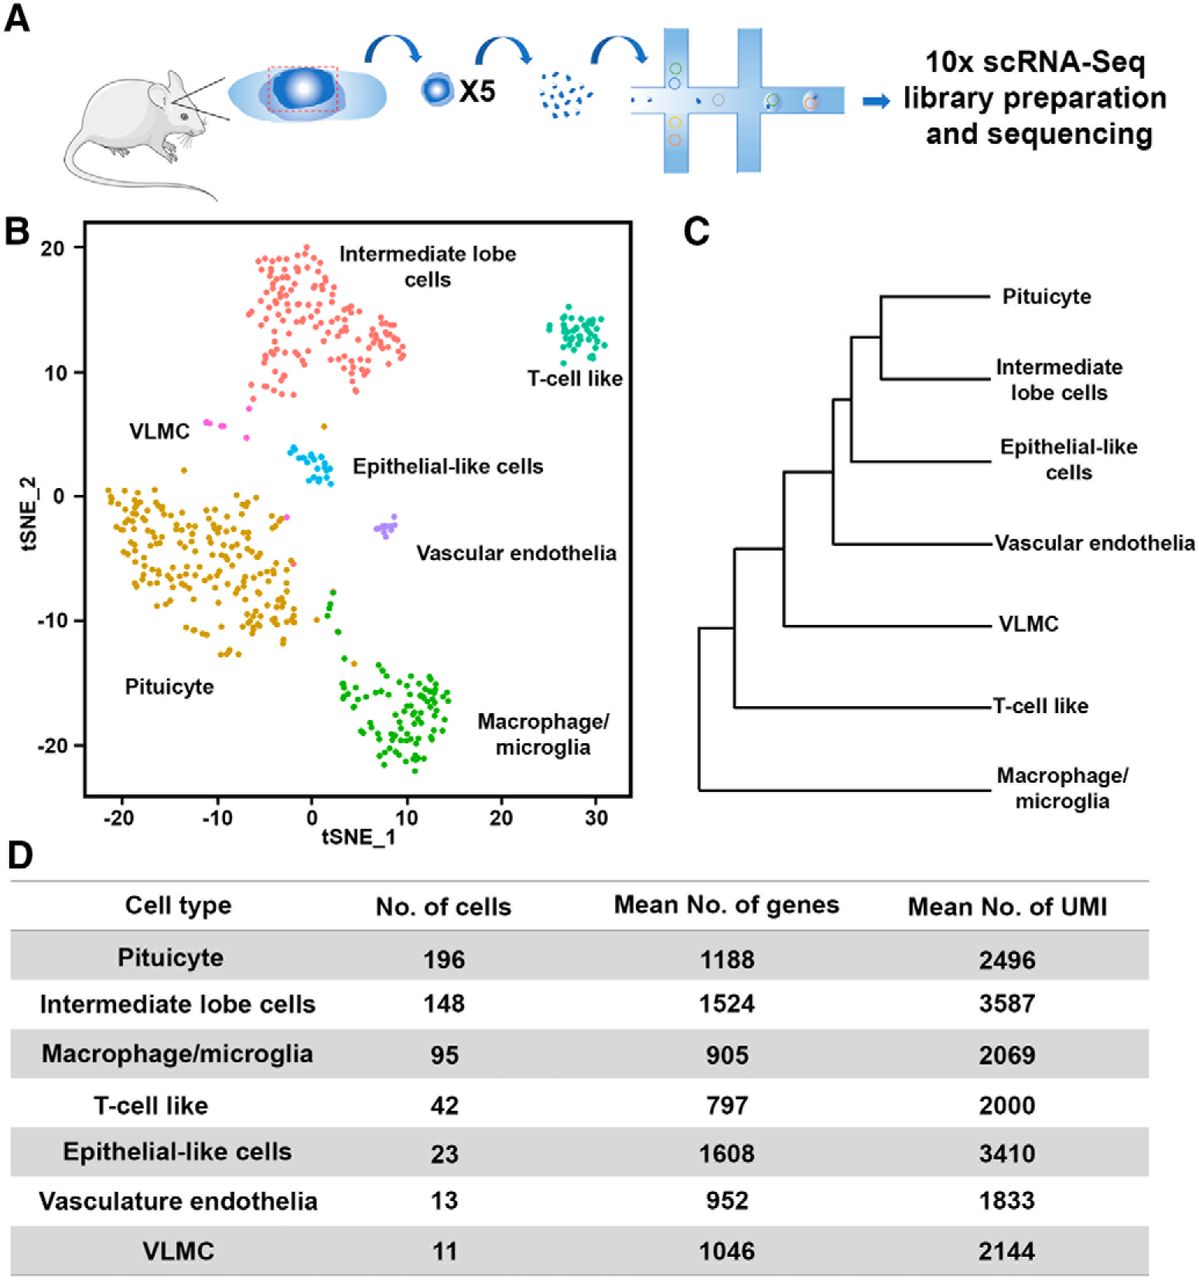
Single-cell RNA-Seq reveals seven cell types of dissected mouse NH. A, Schematic representation of the scRNA-Seq procedure. Neurohypophyseal tissues were dissected from five C57BL6 adult male mice and pooled. Two independent pools were separately subjected to single-cell dissociation, single-cell capturing, and library preparation using the 10x chromium platform. The two libraries were then indexed and combined for sequencing using NextSeq 500 High Output v2 kit (75 cycles). B, The two libraries were pooled and mapped on the tSNE plot, showing cell clusters of IL cells, T-cell like, VLMC, epithelial like cells, vascular endothelia macrophage/microglia, and pituicyte. Each dot represents one cell, and cells with the same color belong to one cell type. C, Dendrogram showing the distance matrix from the PCA space of the average cell among the seven cell types. The length of the path between each two cell types indicates the relativeness between them. D, A table summarizing the number of cells, average number of genes and UMIs found in each cell type.
- Figure 2.
Heatmap of differentially expressed genes in neurohypophyseal and IL cell clusters. Heatmap showing scaled gene expression of the top twenty genes (square brackets) representing each of the seven cell types found in the NH and IL. Each column display gene expression of an individual cell and genes are listed in the rows. Selected marker genes are underlined in red and enlarged on the side.
- Figure 3.
Featured genes representing the landscape of the seven neurohypophyseal and IL cell types. A, Distribution of featured genes from each cell type embedded in tSNE plots. The gene expression scale was color-coded with high expression level in deep blue, low expression in gray. B, Violin plots displaying normalized log-transformed expressions of each featured gene distributed across all the seven clusters. EL, epithelial-like cells; M/m, macrophage/microglia; P, pituicyte; TL, T-cell like; VE, vascular endothelia.
- Figure 4.
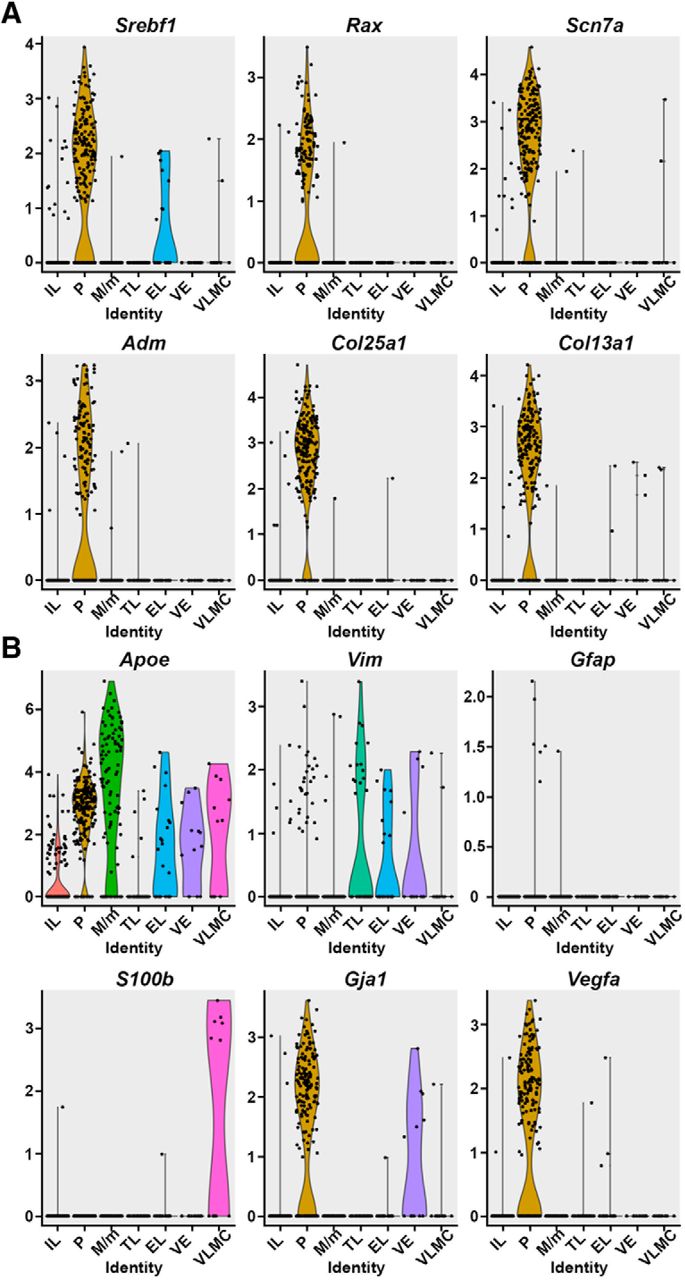
Novel pituicyte markers show higher specificity and robustness compared to previously used markers. A, Violin plots displaying expression distributions of novel pituicyte marker genes in seven pituitary cell types seven clusters. Srebf1, Rax, Scn7a, Adm, Col25a1, and Col13a1 were selected from this single-cell RNA-Seq data and mapped onto the violin plots. The y-axis represents the normalized log-transformed expression of respective genes. Each dot represents a cell and the shape of the violin represents the proportion of cells being enriched compared to the rest of cells in a given cluster. B, Previously published pituicyte markers Apoe, Vim, Gfap, S100β, Gja1 (Cx43), and Vegfa were mapped onto the violin plots within the seven identified cell types. EL, epithelial-like cells; M/m, macrophage/microglia; P, pituicyte; TL, T-cell like; VE, vascular endothelia.
- Figure 5.
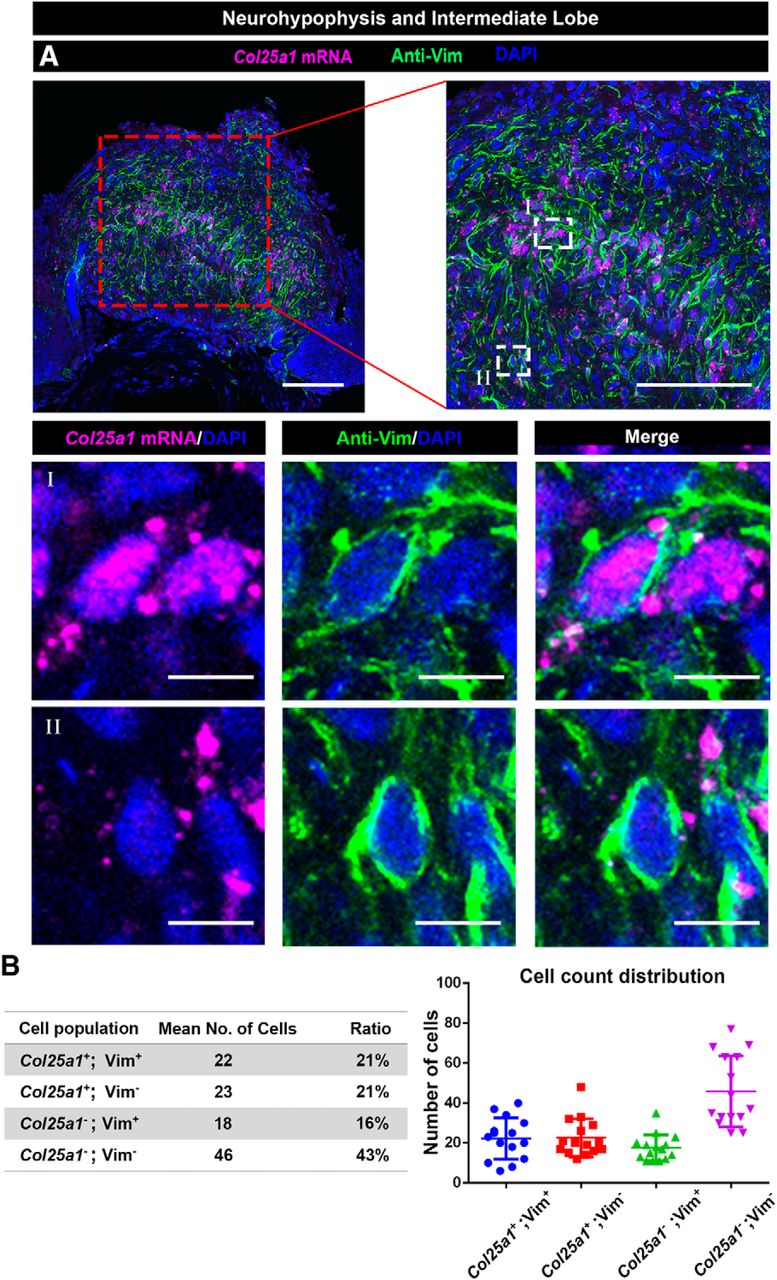
Expression of the novel pituicyte marker Col25a1, in the NH. A, Validation of the scRNA-Seq results using wholemount staining of dissected NH derived from a C57/BL6 adult mouse. Dissected NH was subjected to fluorescent mRNA in situ hybridization with an antisense Col25a1 probe, followed by immunostaining with an antibody directed to the Vim protein and visualized by confocal microscopy. The top panels display different magnifications (scale bars, 100 µm) a single confocal optical plane of Col25a1, Vim, and the nuclei dye, DAPI. Highly magnified field (scale bars, 10 µm) of views showing a representative Col25a1 +; Vim + pituicyte (I) and another Col25a1 -; Vim + neurohypophyseal cell (II). B, Numbers of different subpopulation of cell expressing Col25a1 and/or Vim were analyzed in 15 randomly chosen areas of interest (between 18,133 and 40,429 µm2). The average cell numbers and ratios, as well as the individual counting in each region of interest, are presented.
- Figure 6.
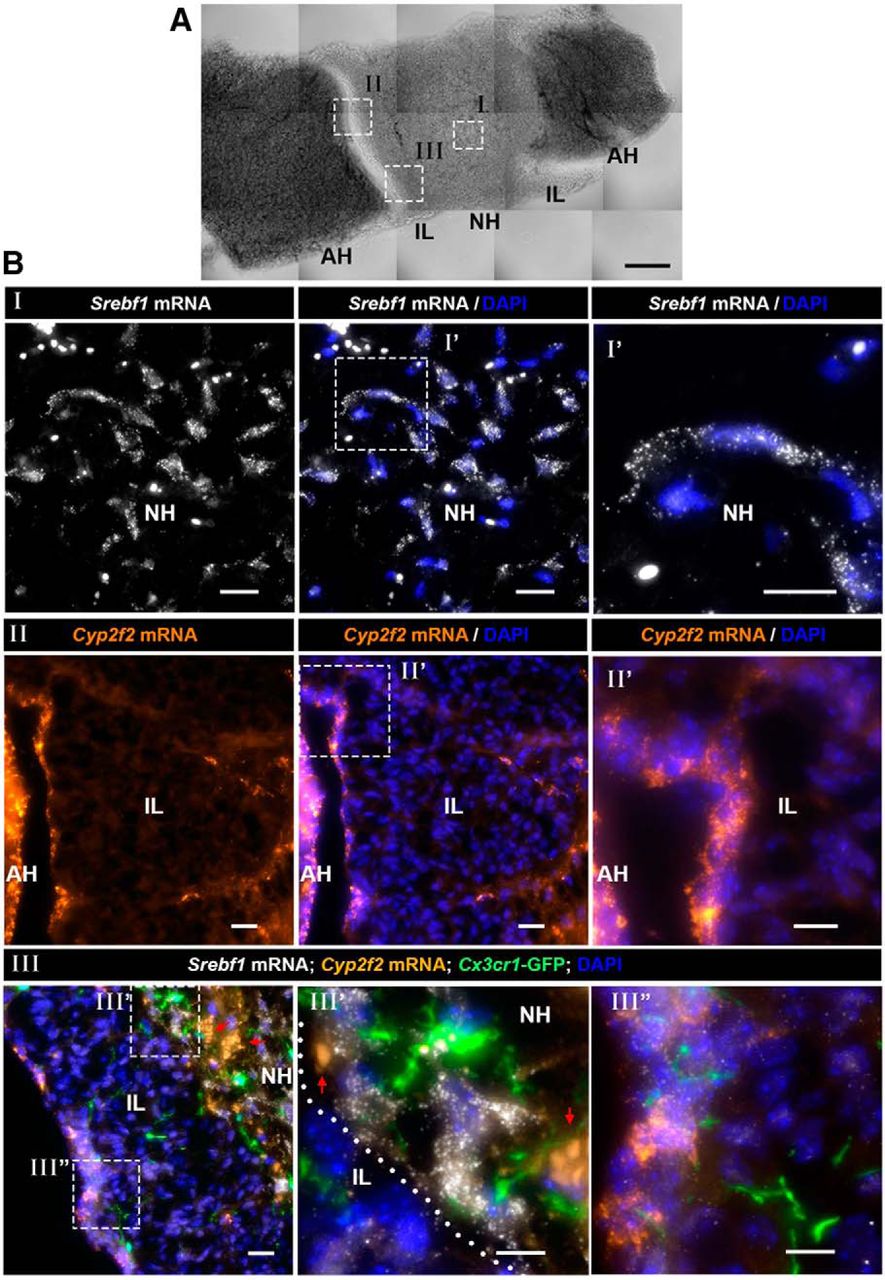
Spatial distribution of pituicyte, macrophage/microglia and epithelial-like cells in the NH and IL. A, A brightfield image of a horizontal section of adult mouse pituitary showing the locations of the NH, IL, and AH. The white boxes in the brightfield image mark the locations of specific pituitary subdomains shown in the fluorescent images below (scale bar, 100 µm). B, Different fields of views (marked by roman numbers) of horizontal section (7 µm) of pituitaries derived from three-month-old Cx3cr1-GFP macrophage/microglia transgenic reporter mouse, which were subjected to smFISH with antisense probes directed to Srebf1 (I), Cyp2f2 (II), or multiplexed smFISH of Srebf1 and Cyp2f2 on Cx3cr1:GFP mouse (III) to observe the relative location of selected cell types. A high-magnification image of the region delineated with the white dashed box is shown. White dotted line in III’ marks the boundary between IL and NH. Note that the smFISH probe of epithelial-like cell marker, Cyp2f2, labels the border between the IL and the AH, as well as IL cells. Arrows indicate background autofluorescent signals of circulating erythrocytes. Scale bars, 20 µm (I, II) and 10 µm (III).
- Figure 7.
Neurohypophyseal VLMCs are associated with fenestrated vascular endothelia. Confocal Z-stack (maximum intensity projection) of dissected NH, which was subjected to wholemount FISH with an antisense RNA probe directed to the VLMC marker, Lum, followed by immunostaining with an antibody directed to Plvap protein, which is a marker of fenestrated endothelia (scale bars, 100 µm). The bottom panels (labeled I–III) display high-magnification single plane confocal images of the respective regions delineated in white boxes in the top right panel (scale bars, 20 µm).


Movies
- Movie 1.
WISH of col25a1 co-stained with Vim antibody and DAPI on dissected NH of three-month-old C57/BL6.
Extended Data Figure 1-1
Adult mouse NH dissection and scRNA-Seq tSNE plot. A, Images showing a dorsal view of the adult male mouse pituitary after the brain has been surgically removed. The left and right images show the pituitary before and after the NH have been dissected. The dashed line indicates the approximate boundary of the NH (scar bars, 50 µm). B, A tSNE plot showing the distribution of individual cells derived from two independent pools of dissected NH in which the cell is colored according to pool origin. Download Figure 1-1, TIF file.
Extended Data Figure 1-2
Complete list of normalized differentially expressed genes. A complete list of normalized differentially expressed genes that were expressed in at least 25% of the cells within between the two groups of cells. Download Figure 1-2, XLSX file.
Extended Data Figure 1-3
The filtered list of normalized differentially expressed genes. List of normalized differentially expressed genes in each cell type displaying an average log2 fold change ≥ 1 and adjusted p ≤ 0.05. Download Figure 1-3, XLSX file.
Extended Data Figure 1-4
ORA of pituicyte transcriptome to PanglaoDB. A comparison of the pituicyte transcriptome to the PanglaoDB database of mouse scRNA-Seq. The list was ranked by adjusted p value (FDR) smallest to largest. Download Figure 1-4, XLSX file.
Extended Data Figure 1-5
Presence of pituicyte markers in astrocyte and tanycyte cells. A comparison between selected pituicyte markers (Ave LogFC > 1, padj < 0.05) revealed in this study with previously published markers of astrocyte and tanycyte. The presence (green) or absence (magenta) of pituicyte markers in astrocyte and tanycyte databases are indicated. The list of all markers used for this comparison is shown in the respective sheets together with their respective references. Download Figure 1-5, XLSX file.
Extended Data Figure 5-1
Expression of Col25a1 and Vim in neurohypophyseal cells. High-resolution image showing co-localization Col25a1 mRNA and Vim protein in neurohypophyseal cells, whose nuclei were labeled by DAPI. The cytoskeletal protein Vim is expressed in the cell circumference, while Col25a1 mRNA is localized in the cytoplasm (scale bars, 10 µm). Download Figure 5-1, TIF file.
Extended Data Figure 6-1
Separate channels for multiplex smFISH images in Figure 6III’,III”. High-magnification images of the horizontal pituitary section (7 µm) shown in Figure 6BIII’,III”. The different panels show separate fluorescent emission channels derived from an adult Cx3cr1-GFP microglia/macrophage transgenic reporter mouse, which was subjected to smFISH with antisense probes directed to pituicyte epithelial-like cells markers Srebf1 and Cyp2f2, respectively. White dotted lines indicate the boundary between IL and NH. Arrows pointing at co-localization of Cyp2f2 mRNA and Srebf1 mRNA in the cells at the boundary between IL and AH (scale bars, 10 µm). Download Figure 6-1, TIF file.
Extended Data Figure 6-2
Gene expression of the neurohypophyseal and IL. A, A brightfield image of a horizontal section of adult mouse pituitary showing the locations of the NH, IL, and AH. The white boxes in the brightfield image mark the locations of specific pituitary subdomains shown in the fluorescent images below (scale bar, 100 µm). B, Different fields of view (marked by roman numbers) of horizontal section (7 µm) of pituitaries derived from three-month-old Cx3cr1-GFP macrophage/microglia transgenic reporter mouse, which were subjected to smFISH. The separate image panels show the expression of the pituicyte marker Srebf1 and epithelial-like marker Cyp2f2 in the NH (I) and the epithelial-like marker Lcn2 at the boundary of IL and AH (II), also marked by the white dotted line (scale bars, 20 µm). C, Confocal Z-stack (maximum intensity projection) of horizontal vibratome pituitary section (50 µm) from a three-month-old male mouse harboring the transgenic macrophage/microglia reporter Cx3cr1-GFP (scale bar, 200 µm). D, Immunostaining of the T-cell marker, Cd3, showing a lone T-cell inside the NH horizontal pituitary cryosection (7 µm) of a three-month-old C57/BL6 male mouse (scale bars, 20 µm). Download Figure 6-2, TIF file.
In this issue


