

Article Figures & Data
Figures
- Figure 1.
Illustration of sample collection and sectioning. Representative slide with three coronal sections (left, sections A–C) that correspond to three regions along the rostral-caudal axis depicted on the sagittal diagram of the mouse brain (right, regions A–C). A color-coded key indicates which structures on the coronal and sagittal sections are corresponding. The slide on the left also shows three small boxes on each section that correspond to regions imaged and used for analysis. Right and left sides were counterbalanced as shown.
- Figure 2.
NG2 and PDGFRβ immunofluorescence identifies different perivascular cell populations and OPCs. A, Immunofluorescence for NG2 (magenta) and PDGFRβ (green) in control CC (the area enclosed in the white dashed line) at P2. Co-localization in mural cells is seen in white. NG2+PDGFRβ- cells are OPCs (arrowheads). B, In addition to mural cells (white, chevrons) and OPCs (magenta, arrowhead), NG2 and PDGFRβ staining reveals NG2-PDGFRβ+ cells (green, thin arrow). C, Schematic illustrating the location of these three populations based on our observations. The three black arrows between the NSC and bipolar OPC, the bipolar and multipolar OPC, and the multipolar OPC and highly branched oligodendrocyte represent specification, maturation and differentiation, respectively, in the oligodendrocyte lineage. Scale bars: 50 μm (A) and 25 μm (B). Mn, meninges; CC, corpus callosum; ChP, choroid plexus; SVZ, subventricular zone; NSC, neural stem cell.
- Figure 3.
RALDH2 expression in the postnatal forebrain of control and cKO mice. A, Coronal section illustrating regions imaged in panels C–E. B, RALDH2 (magenta) co-localizes with PDGFRβ (green) in the dorsal meninges and blood vessels, with a close up of RALDH2 staining in a PDGFRβ+ cell (arrowhead) and a PDGFRβ+ cell that does not express RALDH2 (chevron) in the cortex. C–E, RALDH2 co-localizes with PDGFRβ+ cells (arrowheads) in the midline meninges (C), CC (D), choroid plexus stroma (E). F, Coronal section illustrating the region imaged in G. G, Image indicating the midline meninges, CC (dotted line), SVZ (dense DAPI below dotted lines), and the regions seen in H, I. H, I, Raldh2 mRNA puncta are located in the midline meninges, blood vessels entering the brain parenchyma (arrowheads), and a large blood vessel (bright white vertically oriented ellipse in the lower portion of H). J, Coronal section illustrating regions imaged in panels L–N. K, RALDH2 (magenta) is undetectable in the dorsal meninges and parenchymal blood vessels of cKO mice, while PDGFRβ+ cells (green) are still present; inset shows close up of a PDGFRβ+RALDH2- cell in the cortex. L–N, RALDH2 staining is not present in the midline meninges (L), CC (M), or choroid plexus (N). O, Image indicating the midline meninges, CC, SVZ, and the regions seen in P, Q. P, Q, Raldh2 mRNA puncta (white) in the meninges, penetrating blood vessels (arrowhead), and a large blood vessel (thin arrow) are reduced by 76% compared to controls. R, Quantification of Raldh2 mRNA puncta per millimeter squared. Ctx, cortex; dMn, dorsal meninges; CC, corpus callosum; ChP, choroid plexus; SVZ, subventricular zone; LV, lateral ventricle; mMn, midline meninges; cKO, conditional knock-out. Scale bars: 200 μm (G, O), 100 μm (B, C, E, K, L, N), 25 μm (D, M), and 10 μm (H, I, P, Q). Floating bar plot, box: minimum to maximum value, line at median. ****p < 0.0001.
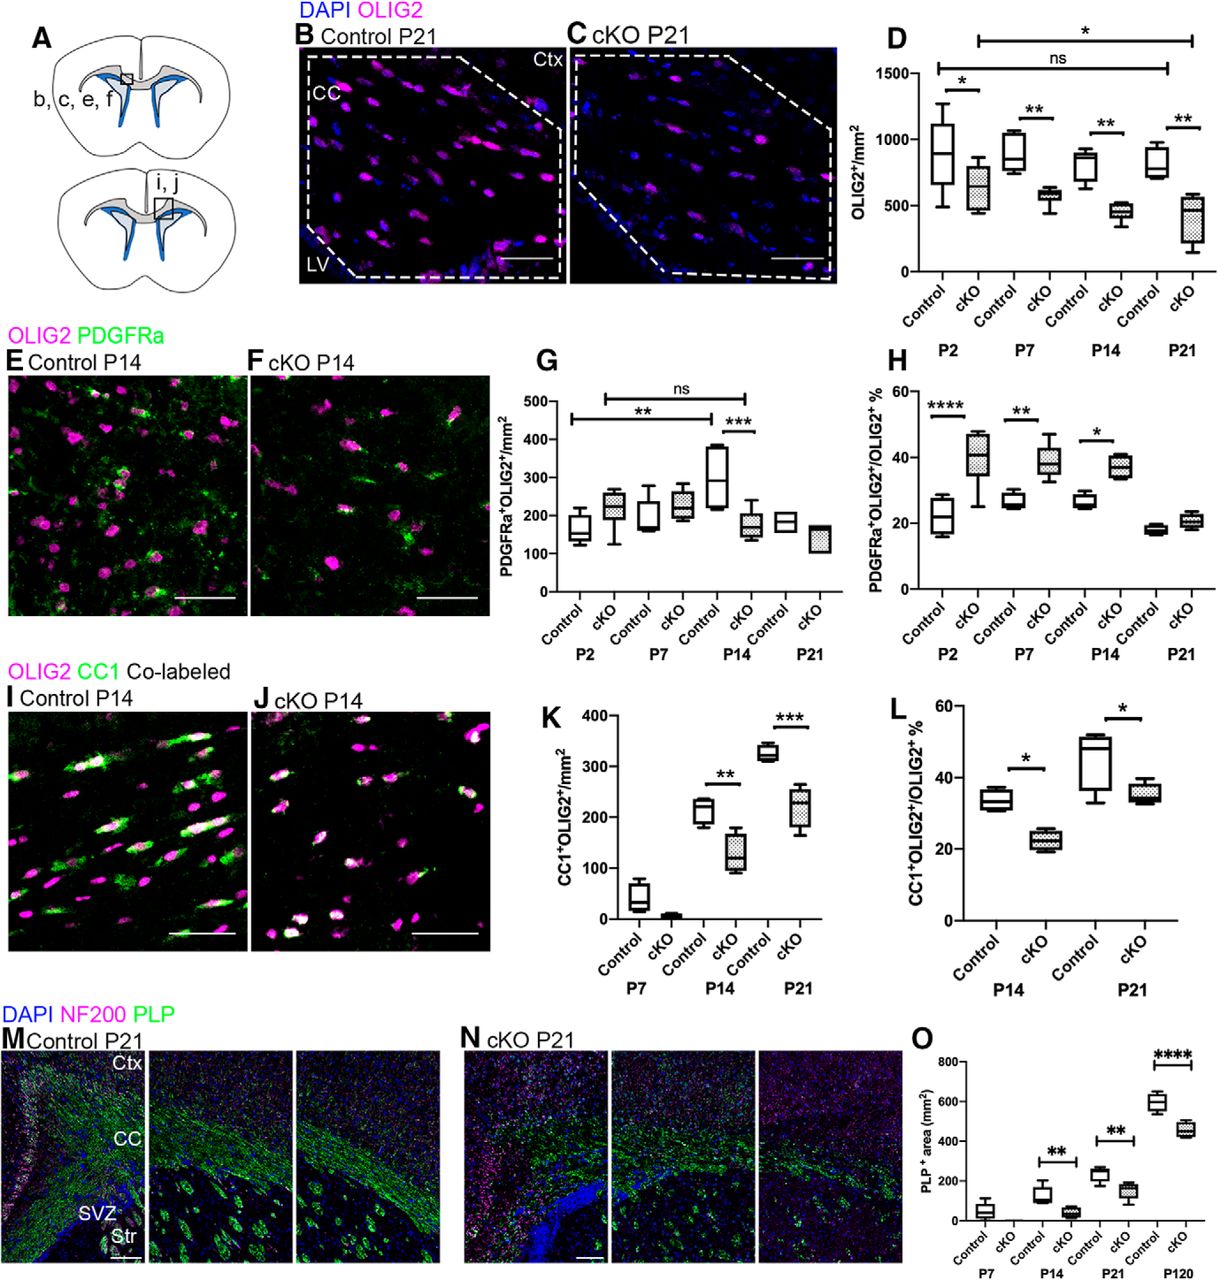
- Figure 5.
Raldh2 cKO results in reduced numbers of OPCs and OLs. A, Coronal section illustrating the regions imaged in B, C, E, F, and M, N (top) and I, J (bottom). B, Control mice have abundant OL lineage cells (OLIG2, magenta; CC, dotted line) and OLIG2+ cell numbers remain stable throughout the first three weeks of postnatal life. C, cKO mice have significantly fewer OLIG2+ cells at all time points examined. D, Quantification of OLIG2+ cell number in control versus cKO mice at each time point. E, F, Control and cKO mice both have OPCs [co-labeled by PDGFRα (green) and OLIG2 (magenta)]. G, control and cKO mice have comparable total PDGFRα+OLIG2+ cell numbers at all time points except P14, when cKO mice have fewer, and while controls displayed at least a two-fold increase in OPCs between P2 and P14, the pool of OPCs in cKO mice did not expand over the same time period. H, More OLIG2+ cells are co-labeled with PDGFRα in cKO mice than controls. I, J, Control and cKO mice both have mature OLs [co-labeled by CC1 (green) and OLIG2 (magenta)]. K, cKO mice have reduced CC1+OLIG2+ cell numbers at P14 and P21. L, In cKO mice, fewer OLIG2+ cells are co-labeled with CC1 than in controls. M, N, Control mice have more PLP+ labeled area (green) than cKO mice at P14, P21, and P120; NF200 (magenta) labels axons. O, Quantification of reduced PLP labeling. CC, corpus callosum; Ctx, cortex; LV, lateral ventricle; SVZ, subventricular zone; Str, striatum; cKO, conditional knock-out. Scale bars: 100 μm (M, N) and 50 μm (B, C, E, F, I, J). Box and whisker plot, box: 25th and 75th percentile, whiskers: minimum to maximum value, line at median. Floating bar plot, box: minimum to maximum value, line at median. *p < 0.05, **p < 0.01, ***p < 0.001, ****p < 0.0001. ns = not significant.
- Figure 6.
NSC survival is reduced in the Raldh2 cKO. A, Coronal section illustrating the regions imaged in the other panels. B, C, Control and cKO mice both have proliferating PDGFRα+ cells (green) identified by co-labeling (white) with KI67 (magenta), and non-proliferating PDGFRα+ cells. D, E, Control and cKO mice have comparable numbers of total KI67+ cells and KI67+PDGFRα+ cells at all time points. F, Between P2 and P7 in control animals, the number of TUNEL+ cells dropped significantly. Between P2 and P7 in cKO mice, TUNEL+ cell numbers were unchanged. At P7 and P14, cKO mice had significantly more TUNEL+ cells than controls. G, H, Dying cells identified by labeling with TUNEL (green, thin arrow) were present in the CC and SVZ (delineated by dotted lines) of both controls and cKO, though no OLIG2+ cells were co-labeled with TUNEL. I, In the cKO SVZ, 76% of all TUNEL+ cells were co-labeled by Nestin [magenta, co-labeled cells are white (thin arrow)]. J, K, Immunofluorescence for IBA1+ in the CC of control and cKO mice. L, Quantification of the number of IBA1+ cells shows no significant difference between groups; a transient increase in IBA1+ cells appears at P7 in cKO mice but does not reach significance. CC, corpus callosum; SVZ, subventricular zone; LV, lateral ventricle; cKO, conditional knock-out. Scale bars: 50 μm (B, C, G, H, J, K) and 25 μm (I). Box and whisker plot, box: 25th and 75th percentile, whiskers: minimum to maximum value, line at median. **p < 0.01, ***p < 0.001, ****p < 0.0001. ns = not significant.
- Figure 7.
Gli1 expression is reduced in the SVZ in Raldh2 cKO mice. A, Coronal section illustrating the region imaged in B, C. B, C, In controls and cKO mice, Gli1 mRNA puncta (white) are found in the SVZ (delineated by dotted lines) and the transition from the SVZ into the CC (area flanking the top dotted line in B, C). D, The total number of Gli1 puncta in the SVZ and its border with the CC is reduced in cKO at P2 relative to controls. E, The number of Gli1 mRNA puncta per cell is reduced in cKO mice. F, G, Gli1+Olig2+-co-labeled cells (white and magenta) cells are found at the border between the SVZ and CC in controls and cKO. H, The number of Gli1+Olig2+ cells is reduced in cKO mice. CC, corpus callosum; SVZ, subventricular zone; LV, lateral ventricle; cKO, conditional knock-out. Scale bars: 50 μm (B, C) and 5 μm (F, G). Box and whisker plot, box: 25th and 75th percentile, whiskers: minimum to maximum value, line at median. Floating bar plot, box: minimum to maximum value, line at median. **p < 0.01, ***p < 0.001, ****p < 0.0001.
- Figure 8.
Other NSC-derived cell types are reduced by loss of RALDH2. A, B, Control and cKO mice both have GFAP+ expression in the CC (dotted lines). OLIG2 marks OL lineage cells and is included to provide contrast. C, The area of CC that is labeled by GFAP is significantly reduced in cKO mice relative to controls at all time points examined. D, Coronal section illustrating the regions imaged in E, F, H, I, L, M. E–G, cKO mice have significantly more SATB2+ neurons (green) than controls. H, I, cKO mice have significantly fewer layer 6 (TBR1, magenta) and layer 5 (CTIP2, green) neurons than control mice at P2. J, Quantification of CTIP2+ cell reduction in cKO mice. K, Quantification of TBR1+ cell reduction in cKO mice. L, M, Cortical thickness is reduced in cKO mice. N, Quantification of cortical thickness. CC, corpus callosum; LV, lateral ventricle; Ctx, cortex (with layers 1–6 in roman numerals); SVZ, subventricular zone; Mn, meninges; cKO, conditional knock-out. Scale bars: 200 μm (L, M), 100 μm (A, B), 50 μm (H, I), and 25 μm (E, F). Box and whisker plot, box: 25th and 75th percentile, whiskers: minimum to maximum value, line at median. Floating bar plot, box: minimum to maximum value, line at median. *p < 0.05, **p < 0.01, ***p < 0.001, ****p < 0.0001.


Tables
Identifier Shapiro–Wilk
(α = 0.05)Test 95% CI a Normal Raldh2 mRNA puncta/mm; unpaired t test between genotypes at P2, one-tailed –2521 to –1732 b Normal PDGFRβ+ structures/mm2; unpaired t test between genotypes at P14, two-tailed –42.62 to 16.82 c Normal Laminin+ structures/mm2; unpaired t test between genotypes at P14, two-tailed –94.79 to 21.25 d Normal PDGFRβ+Laminin+/Laminin+ structures %, unpaired t test between genotypes at P14, two-tailed –2.765 to 21.69 e Normal OLIG2+ cells/mm2; one-way ANOVA with Sidak’s test between genotypes at individual time points P2 4.080 to 494.0 P7 80.47 to 547.6 P14 126.6 to 593.7 P21 108.9 to 681.0 f Normal OLIG2+ cells/mm2; unpaired t test within control genotype between individual time points P2 vs P21, one-tailed –441.0 to 282.2 g Normal OLIG2+ cells/mm2; unpaired t test within cKO genotype between individual time points P2 vs P21, one-tailed –490.0 to 39.44 h Normal PDGFRα+OLIG2+ cells/mm2; one-way ANOVA with Sidak’s test for multiple comparisons between genotypes at individual time points i Normal PDGFRα+OLIG2+ cells/mm2; one-way ANOVA with Sidak’s test for multiple comparisons within control genotype at individual time points P2 vs P7 –121.2 to 55.21 P7 vs P14 –184.2 to –16.61 P14 vs P21 8.089 to 221.1 P2 vs P21 –224.6 to –42.19 j Normal PDGFRα+OLIG2+/OLIG2+ cells/mm2; one-way ANOVA with Sidak’s test for multiple comparisons between genotypes at individual time points P2 –26.25 to –9.080 P7 –21.13 to –3.288 P14 –20.19 to –1.376 P21 –12.09 to 6.720 k Normal CC1+OLIG2+ cells/mm2; one-way ANOVA with Sidak’s test for multiple comparisons between genotypes at individual time points P7 –21.38 to 87.30 P14 32.72 to 141.4 P21 49.38 to 158.1 l Normal CC1+OLIG2+ cells/OLIG2+ cells %; one-way ANOVA with Sidak’s test for multiple comparisons between genotypes at individual time points P14 2.156 to 20.30 P21 1.024 to 19.16 m Normal PLP+ area (mm2); one-way ANOVA with Sidak’s test for multiple comparisons between genotypes at individual time points P7 –18.20 to 107.8 P14 30.06 to 138.5 P21 25.44 to 139.2 P120 69.15 to 211.4 n Normal TUNEL+ cells/mm2; unpaired t test within control genotype between individual time points P2 vs P7, one-tailed –41.86 to –15.94 o Normal TUNEL+ cells/mm2; unpaired t test within cKO genotype between individual time points P2 vs P7, one-tailed –18.13 to 4.871 p Normal TUNEL+ cells/mm2; one-way ANOVA with Sidak’s test for multiple comparisons between genotypes at individual time points P2 –9.109 to 16.03 P7 –30.05 to –7.565 P14 0.9951 to 10.17 q Normal IBA1+ cells/mm2 one-way ANOVA with Sidak’s test for multiple comparisons between genotypes at individual time points P7 –46.17 to 51.34 P14 –92.57 to 4.941 P21 –37.76 to 67.56 r Normal Gli1 mRNA puncta/mm2; unpaired t test between genotypes at P2, one-tailed –15,405 to –2876 s Normal Gli1 mRNA puncta/cell; n= number of cells, unpaired t test between genotypes at P2, one-tailed –3.692 to –1.703 t Normal Gli1+Olig2+ cells/mm2; unpaired t test between genotypes at P2, one-tailed –53.01 to –33.57 u Normal ÄGFAP+ area (mm2); one-way ANOVA with Sidak’s test for multiple comparisons between genotypes at individual time points P2 0.8137 to 7.880 P7 4.695 to 12.44 P14 6.558 to 14.30 P21 3.638 to 11.38 v Normal SATB2+ cells/mm2; unpaired t test between genotypes at P2, one-tailed 159.9 to 1991 w Normal CTIP2+ cells/mm2; unpaired t test between genotypes at P2, two-tailed –172.6 to –68.02 x Normal TBR1+ cells/mm2; unpaired t test between genotypes at P2, two-tailed –1407 to –439.5 y Normal Cortical thickness (um); unpaired t test between genotypes at P2, two-tailed –234.6 to 26.12
In this issue


