

Article Figures & Data
Figures
- Figure 1.
Power spectra for each subject in each of the conditions. Each panel represents data from one subject averaged across electrodes. Points represent the peak frequency for each condition. The grand mean across subjects is shown on the right. Shaded regions represent the within-subject SE (Cousineau, 2005; Morey, 2008).
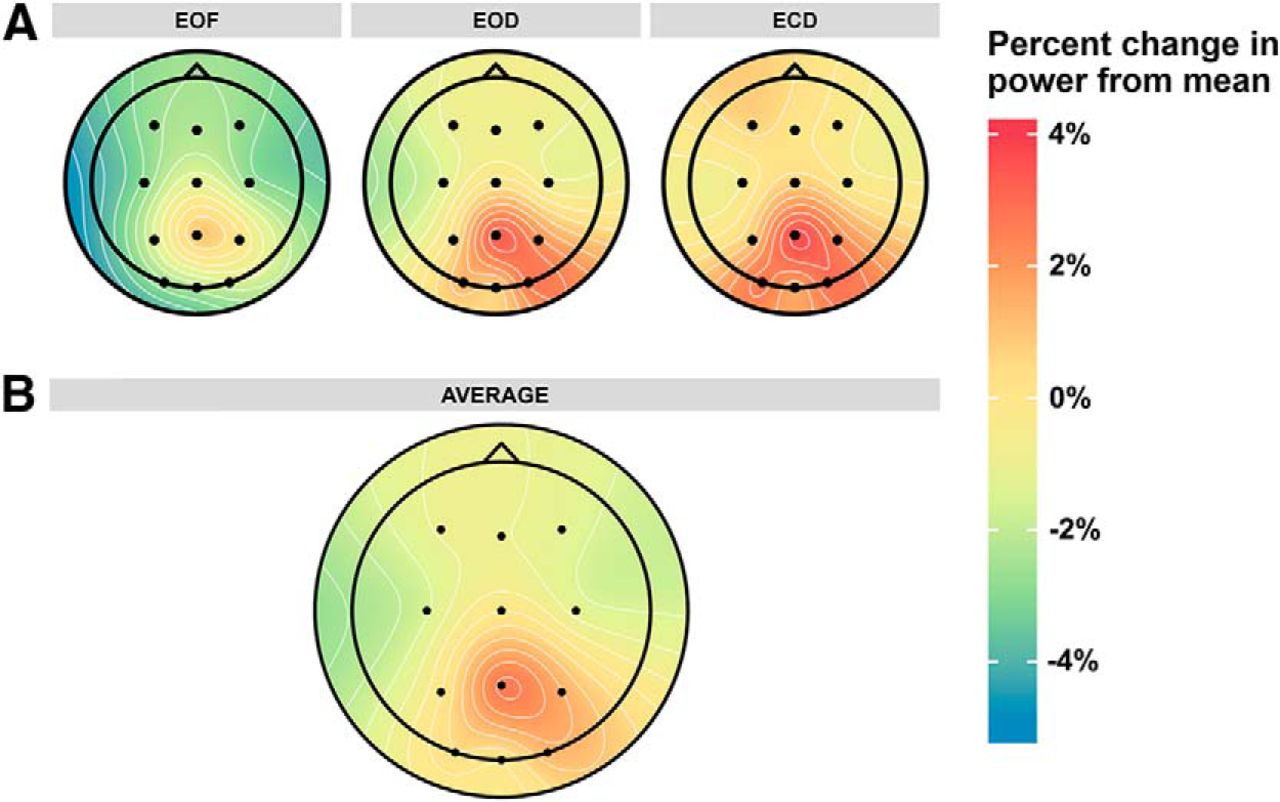
- Figure 2.
Distribution of α peak frequency across the scalp. A, α peak frequency in each resting state condition. B, α peak frequency averaged across resting state conditions.
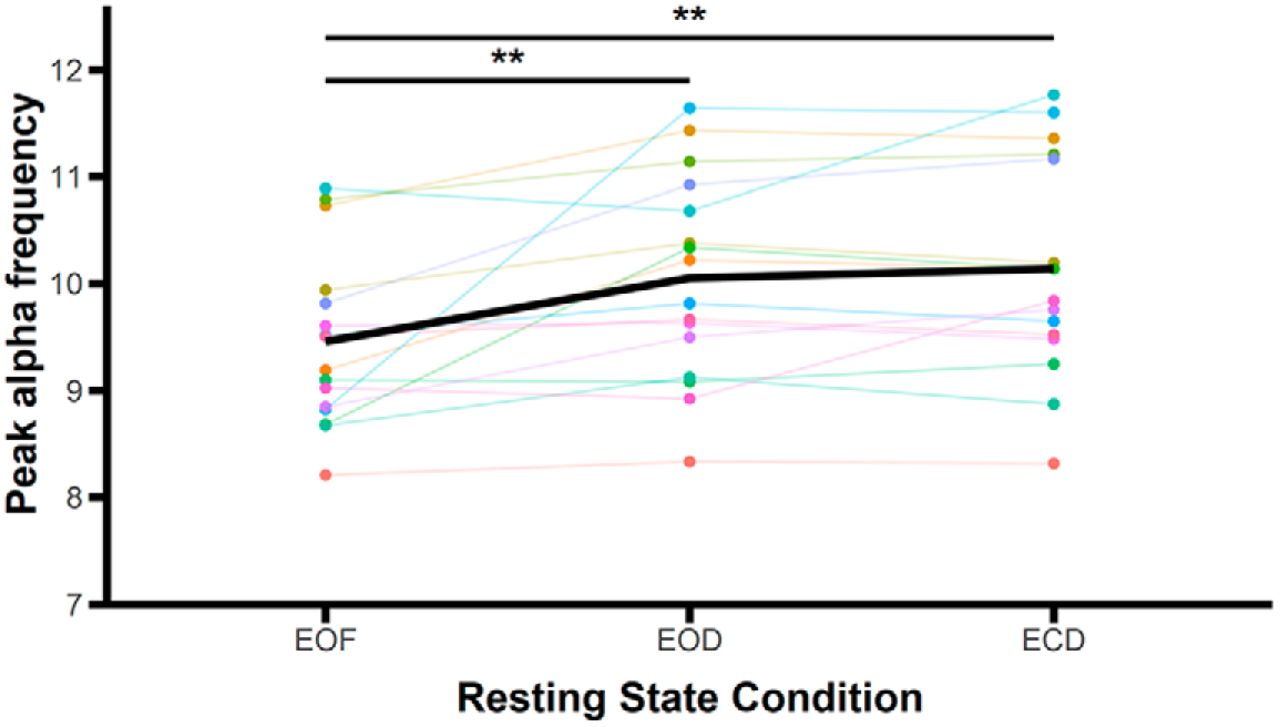
- Figure 3.
Mean α peak frequency across resting state conditions. Colored points and lines indicate data from individual subjects. The bold black line represents the mean averaged across subjects; **p < 0.01.
- Figure 4.
Distribution of normalized α power across the scalp. Power is plotted as percentage change from the mean across all resting state conditions, electrodes, and subjects to better illustrate the differences in power occurring across different resting state conditions. Power values that deviate strongly from the grand mean will be non-zero in the averaged data. A, Normalized α power in each resting state condition. B, Normalized α power averaged across resting state conditions.
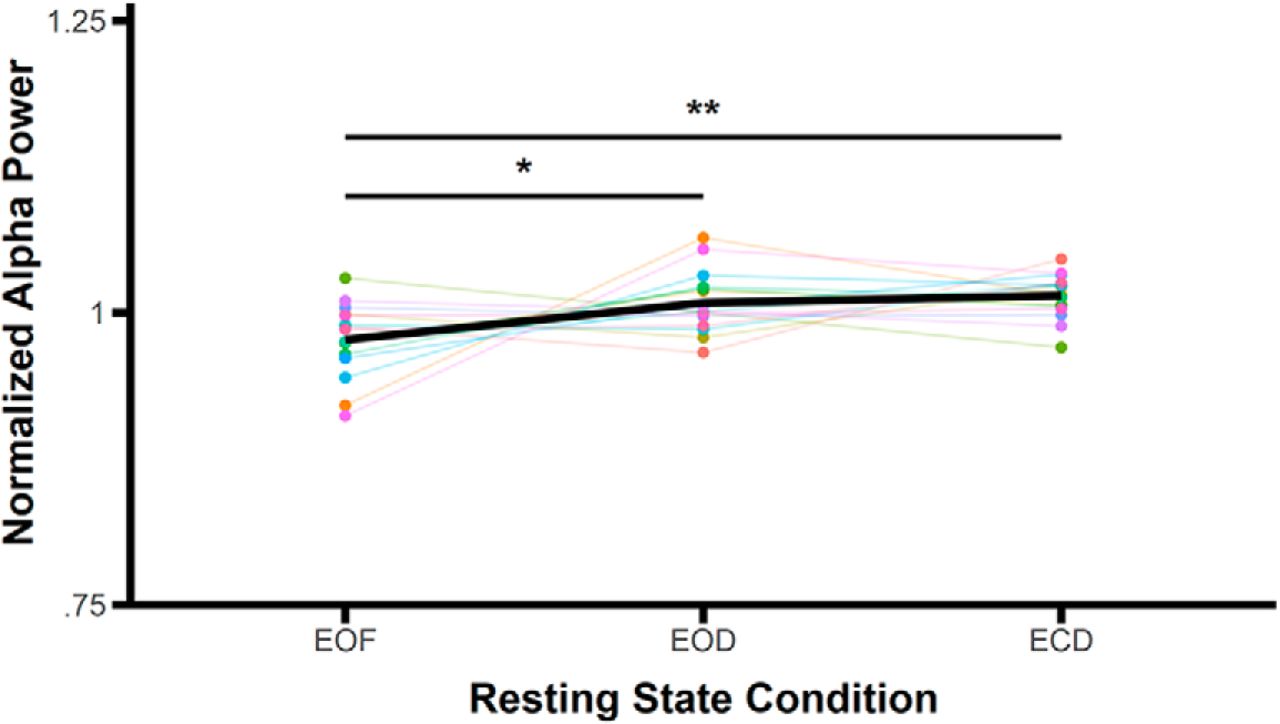
- Figure 5.
Mean normalized α power across resting state conditions. Colored points and lines indicate data from individual subjects; the same colors represent the same subjects as Figure 3. The bold black line represents the mean averaged across subjects; *p < 0.05, **p < 0.01.


Tables
Data structure Type of test Power/confidence interval a Normal distribution Two-way RM ANOVA ηp 2 = 0.50 b Normal distribution t test (post hoc test) ECD vs. EOD, mean = −31.44 (−51.38 to −11.50) ECD vs. EOF, mean = −66.31 (−94.07 to −38.56) EOD vs. EOF, mean = −34.88 (−64.18 to −5.57) c Normal distribution Two-way RM ANOVA ηp 2 = 0.02 d Normal distribution Three-way RM ANOVA ηp 2 = 0.41 e Normal distribution Three-way RM ANOVA ηp 2 = 0.35 f Normal distribution Three-way RM ANOVA ηp 2 = 0.07 g Normal distribution t test (post hoc test) EOF vs. EOD, mean = −.59 (−1.01 to −.17) EOF vs. ECD, mean = −.74 (−1.12 to −.37) EOD vs. ECD, mean = −.16 (−.30 to .12) h Normal distribution t test with FDR correction (post hoc test) P3 vs. F3, mean = .71 (.25 to 1.17) P3 vs. Fz, mean = .67 (.26 to 1.08) P3 vs. F4, mean = .63 (.24 to 1.03) P3 vs. C3, mean = .43 (.11 to .75) P3 vs. Cz, mean = .54 (.13 to .94) P3 vs. C4, mean = .63 (.28 to .99) Pz vs. F3, mean = .76 (.26 to 1.26) Pz vs. Fz, mean = .72 (.33 to 1.11) Pz vs. F4, mean = .68 (.29 to 1.07) Pz vs. C3, mean = .48 (.13 to .83) Pz vs. Cz, mean = .59 (.20 to .97) Pz vs. C4, mean = .68 (.30 to 1.07) P4 vs. F3, mean = .66 (.16 to 1.17) P4 vs. Fz, mean = .62 (.21 to 1.04) P4 vs. F4, mean = .59 (.19 to .99) P4 vs. C3, mean = .39 (−.003 to .78) P4 vs. Cz, mean = .49 (.05 to .93) P4 vs. C4, mean = .59 (.27 to .90) O1 vs. F3, mean = .81 (.34 to 1.29) O1 vs. Fz, mean = .77 (.30 to 1.23) O1 vs. F4, mean = .73 (.27 to 1.19) O1 vs. C3, mean = .53 (.14 to .91) O1 vs. Cz, mean = .63 (.17 to 1.09) O1 vs. C4, mean = .73 (.32 to 1.14) Oz vs. F3, mean = .73 (.28 to 1.17) Oz vs. Fz, mean = .69 (.24 to 1.13) Oz vs. F4, mean = .65 (.19 to 1.10) Oz vs. C3, mean = .45 (.07 to .82) Oz vs. Cz, mean = .55 (.08 to 1.02) Oz vs. C4, mean = .65 (.24 to 1.06) O2 vs. F3, mean = .74 (.25 to 1.24) O2 vs. Fz, mean = .70 (.24 to 1.16) O2 vs. F4, mean = .66 (.19 to 1.14) O2 vs. C3, mean = .46 (.08 to .85) O2 vs. Cz, mean = .57 (.09 to 1.04) O2 vs. C4, mean = .66 (.24 to 1.09) F3 vs. Fz, mean = −.04 (−.29 to .21) F3 vs. F4, mean = −.08 (−.39 to .23) F3 vs. C3, mean = −.28 (−.58 to .03) F3 vs. Cz, mean = −.17 (−.47 to .12) F3 vs. C4, mean = −.08 (−.52 to .37) Fz vs. F4, mean = −.04 (−.19 to .11) Fz vs. C3, mean = −.24 (−.54 to .07) Fz vs. Cz, mean = −.14 (−.29 to .02) Fz vs. C4, mean = −.04 (−.41 to .34) F4 vs. C3, mean = −.20 (−.53 to .13) F4 vs. Cz, mean = −.10 (−.27 to .07) F4 vs. C4, mean = 0.00 (−.29 to .29) C3 vs. Cz, mean = .10 (−.14 to .34) C3 vs. C4, mean = .20 (−.18 to .58) Cz vs. C4, mean = .10 (−.29 to .48) P3 vs. Pz, mean = −.05 (−.17 to 07) P3 vs. P4, mean = .05 (−.11 to .20) P3 vs. O1, mean = −.10 (−.24 to .04) P3 vs. Oz, mean = −.01 (−.18 to .15) P3 vs. O2, mean = −.03 (−.18 to .12) Pz vs. P4, mean = .10 (−.07 to .26) Pz vs. O1, mean = −.05 (−.26 to .17) Pz vs. Oz mean = .04 (−.21 to .28) Pz vs. O2, mean = .02 (−.19 to .23) P4 vs. O1, mean = −.14 (−.37 to .09) P4 vs. Oz, mean = −.06 (−.28 to .16) P4 vs. O2, mean = −.08 (−.27 to .11) O1 vs. Oz, mean = .08 (−.05 to .21) O1 vs. O2, mean = .06 (−.08 to .21) Oz vs. O2, mean = −.01 (−.12 to .09) i Normal distribution Three-way RM ANOVA ηp 2 = 0.30 j Normal distribution Three-way RM ANOVA ηp 2 = 0.37 k Normal distribution Three-way RM ANOVA ηp 2 = 0.10 l Normal distribution t test (post hoc test) EOF vs. EOD, mean = −.02 (−.05 to .00) EOF vs. ECD, mean = −.03 (−.05 to −.01) EOD vs. ECD, mean = −.01 (−.02 to .01) m Normal distribution t test with FDR correction (post hoc test) Pz vs. F3, mean = .04 (.02 to .06) Pz vs. Fz, mean = .04 (.02 to .06) Pz vs. F4, mean = .04 (.03 to .06) Pz vs. C3, mean = .04 (.03 to .06) Pz vs. Cz, mean = .03 (.02 to .04) Pz vs. C4, mean = .04 (.03 to .05) Pz vs. P3, mean = .03 (.02 to .04) Pz vs. P4, mean = .01 (.01 to .02) Pz vs. O1, mean = .02 (.01 to .04) Pz vs. Oz, mean = .02 (.01 to .04) Pz vs. O2, mean = .01 (.00 to .03) P4 vs. F3, mean = .03 (.01 to .05) P4 vs. Fz, mean = .03 (.01 to .05) P4 vs. F4, mean = .03 (.01 to .05) P4 vs. C3, mean = .03 (.02 to .05) P4 vs. Cz, mean = .02 (.00 to .03) P4 vs. C4, mean = .03 (.02 to .04) P4 vs. O1, mean = .01 (−.01 to .03) P4 vs. Oz, mean = .01 (.00 to .03) P4 vs. O2, mean = .00 (−.01 to .02) O2 vs. F3, mean = .03 (.01 to .04) O2 vs. Fz, mean = .01 (.00 to .03) O2 vs. F4, mean = .03 (.01 to .04) O2 vs. C3, mean = .03 (.01 to .05) O2 vs. Cz, mean = .01 (.00 to .03) O2 vs. C4, mean = .03 (.01 to .04) O2 vs. P3, mean = .01 (.00 to .03) O2 vs. O1, mean = .01 (.00 to .02) O2 vs. Oz, mean = .01 (.00 to .02) F3 vs. Fz, mean = .00 (.00 to .00) F3 vs. F4, mean = .00 (.00 to .01) F3 vs. C3, mean = .01 (−.01 to .02) F3 vs. Cz, mean = −.01 (−.02 to .00) F3 vs. C4, mean = .00 (−.01 to .01) F3 vs. P3, mean = −.01 (−.03 to .00) F3 vs. O1, mean = −.02 (−.04 to .00) F3 vs. Oz, mean = −.01 (−.03 to .00) Fz vs. F4, mean = .00 (.00 to .01) Fz vs. C3, mean = .01 (−.01 to .02) Fz vs. Cz, mean = −.01 (−.02 to .00) Fz vs. C4, mean = .00 (−.01 to .01) Fz vs. P3, mean = −.01 (−.03 to .00) Fz vs. O1, mean = −.02 (−.04 to .02) Fz vs. Oz, mean = −.01 (−.03 to .00) F4 vs. C3, mean = .00 (−.01 to .02) F4 vs. Cz, mean = −.01 (−.02 to .00) F4 vs. C4, mean = .00 (−.01 to .01) F4 vs. P3, mean = −.01 (−.03 to .00) F4 vs. O1, mean = −.02 (−.04 to .00) F4 vs. Oz, mean = −.02 (−.03 to .00) C3 vs. Cz, mean = −.02 (−.02 to −.01) C3 vs. C4, mean = .00 (−.01 to .00) C3 vs. P3, mean = −.02 (−.03 to −.01) C3 vs. O1, mean = −.02 (−.04 to −.01) C3 vs. Oz, mean = −.02 (−.04 to .00) Cz vs. C4, mean = .01 (.00 to .02) Cz vs. P3, mean = .00 (−.01 to .01) Cz vs. O1, mean = −.01 (−.02 to .01) Cz vs. Oz, mean = .00 (−.02 to .01) C4 vs. P3, mean = −.01 (−.02 to .00) C4 vs. O1, mean = −.02 (−.04 to .00) C4 vs. Oz, mean = −.02 (−.03 to .00) P3 vs. O1, mean = −.01 (−.02 to .01) P3 vs. Oz, mean = .00 (−.02 to .01) O1 vs. Oz, mean = .00 (.00 to .01) n Normal distribution t test (post hoc test) Changes in sensory input over occipital electrodes versus all other electrodes, x̄ = 0.03 (0.01 to 0.04) Table summarizes the distribution, statistical test, and power or confidence interval for each statistical test in the present study. Identifiers refer to superscript identifiers in the main text.
Electrode EOD-EOF ECD-EOF ECD-EOD F3 2.62% 3.65% 1.05% Fz 2.30% 3.28% 1.00% F4 2.78% 3.49% 0.72% C3 2.28% 2.95% 0.69% Cz 1.98% 2.79% 0.83% C4 2.43% 3.19% 0.78% P3 2.77% 3.25% 0.50% Pz 3.20% 3.57% 0.39% P4 2.88% 3.26% 0.39% O1 4.96% 5.58% 0.66% Oz 4.15% 4.56% 0.43% O2 5.17% 5.07% −0.10%
In this issue


