

Article Figures & Data
Figures
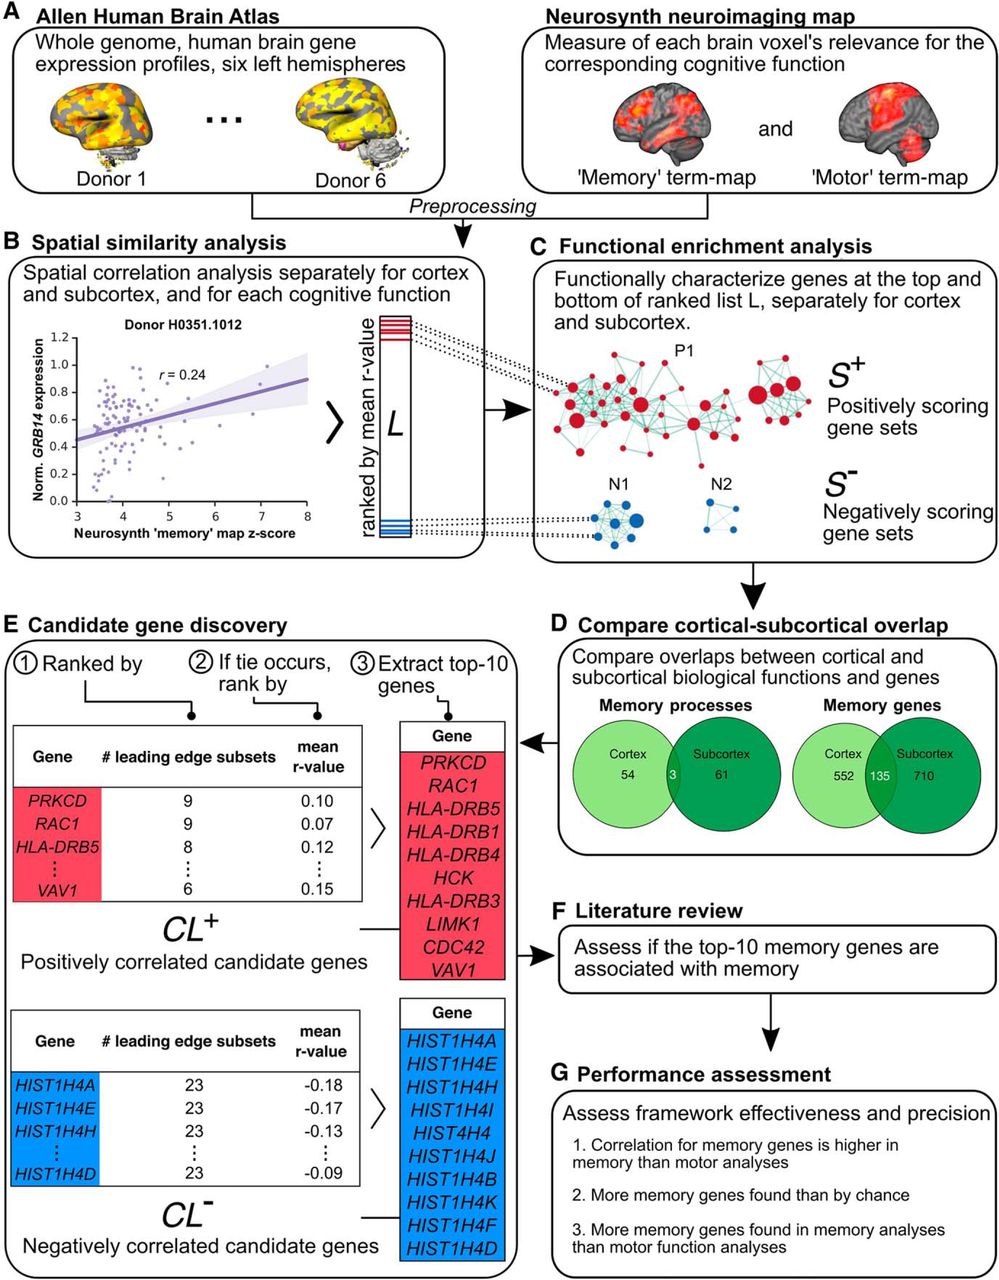
- Figure 1.
Overview of genetic signature discovery framework. A, The AHBA and Neurosynth neuroimaging maps, and their preprocessing and integration into a common neuroimaging template space. B, Calculation of spatial similarity between the maps separately for the cortical and subcortical regions, and for memory and motor functions, deriving a ranked gene list L per analysis (contains genes and mean r value). C, Functional characterization of each L with biologically meaningful gene sets with GSEA Pre-ranked analysis (dotted lines connecting L and gene sets represent the clustering of genes into enriched gene sets), yielding positively and negatively scoring gene sets S + and S −. D, Assessing differences and the overlap between cortical and subcortical memory genes. E, Identification of candidate genes associated with the cognitive function and brain region, operationalized as the subset of genes driving the enrichment score of the significantly enriched gene sets found using GSEA Pre-ranked analysis. This produced two candidate gene lists, CL + and CL −, containing highly positively and negatively correlated genes from S + and S −, respectively. F, Literature review of each CL quantifying the genes associated with the target or control cognitive function. G, Assessing framework validity and precision with each of eight CLs. See Extended Data Figure 1-1 for a visualization of GRB14 gene expression in the AHBA, Extended Data Figure 1-2 for a visualization of the Neurosynth maps, and Extended Data Figure 1-3 for the cortical and subcortical regions used in the spatial correlation analysis.
- Figure 2.
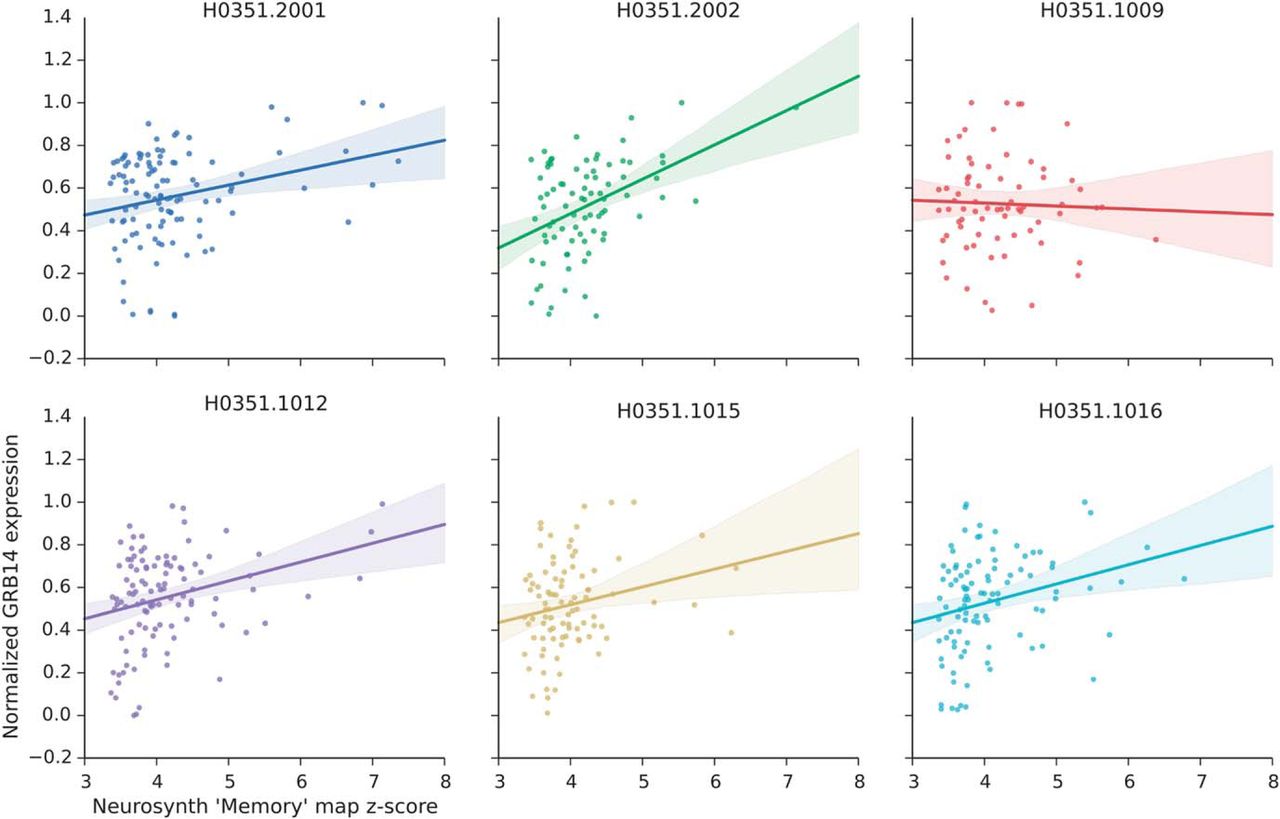
An example of spatial similarity analysis output. The expression levels of the top-correlated cortical gene, GRB14, is visualized as a function of the Neurosynth map’s voxel-wise relevance to memory function (z score). Normalized gene expression (y-axis) plotted against neuroimaging map z scores (x-axis). Each colored regression line represents the best-fit line for each of six donors (colors); the translucent band around each line represents the 95% confidence interval estimate.
- Figure 3.
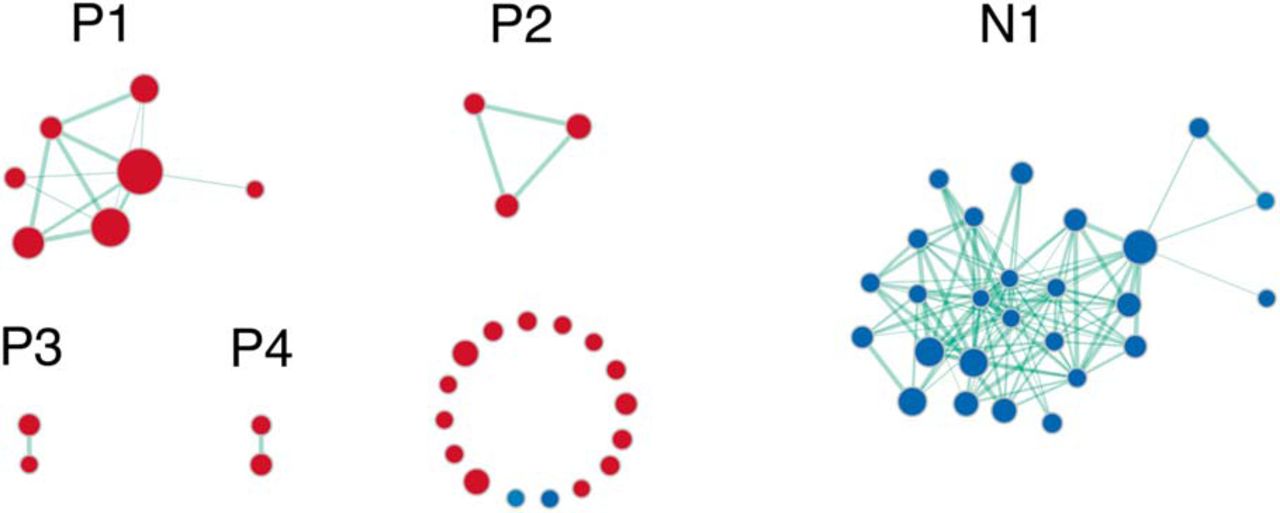
Enrichment map visualization for cortical memory. Clusters are labeled with P for positive, N for negative. Gene set clusters were found to be related to memory. Positive clusters were associated with immune signaling, calcium transport and actin filament assembly. The negative cluster contained gene sets involved in chromatin dynamics and epigenetic regulation. See Extended Data Figure 3-1 for the full output from GSEA Pre-ranked.
- Figure 4.
Enrichment map visualization for subcortical memory. Clusters are labeled with P for positive, N for negative. Gene set clusters were found to be associated with memory. Positive clusters were associated with synaptic transmission, long-term plasticity, glutamate signaling, and neurite morphogenesis. Negative clusters included gene sets involved in transcription and translation, and glial cell differentiation. See Extended Data Figure 4-1 for the full output from GSEA Pre-ranked.
- Figure 5.
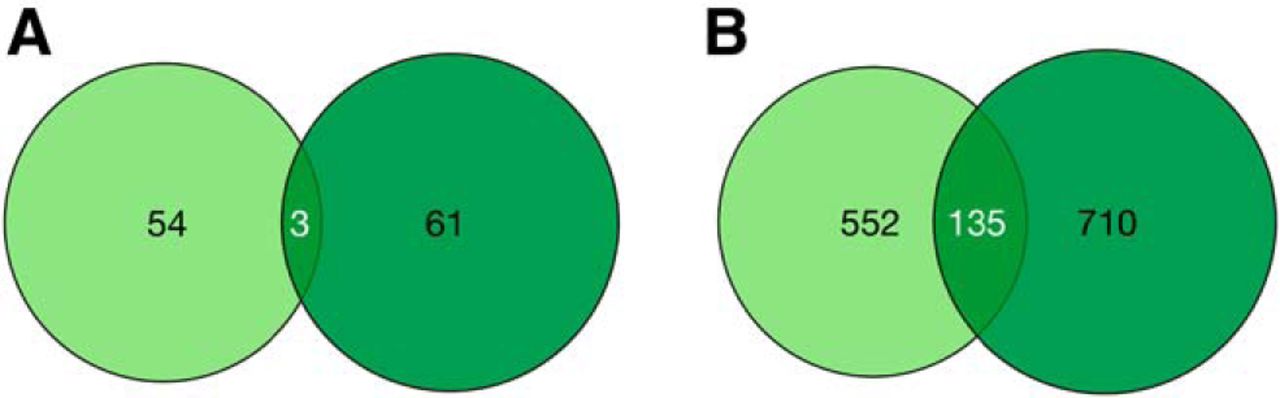
Overlap between cortical and subcortical memory gene sets and genes. A, Number of overlapping cortical and subcortical memory gene sets derived from GSEA. B, Number of overlapping cortical and subcortical memory genes derived from GSEA. Light green denotes cortical genes, dark green denotes subcortical genes. See Extended Data Figure 5-1 for the list of gene sets and genes that are shared or distinct across cortex and subcortex.
- Figure 6.
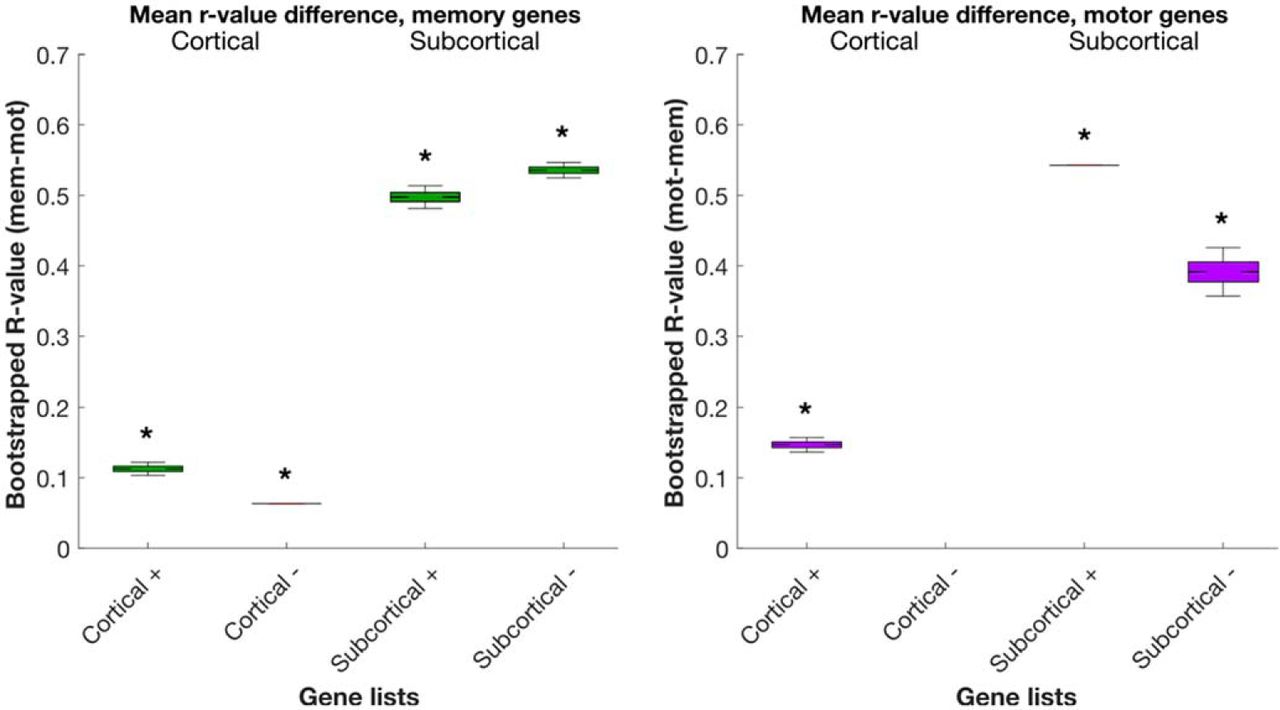
Bootstrapped correlation value differences for all cortical and subcortical candidate genes of memory and motor analysis. For a given memory gene, we calculated the difference between memory and motor analysis r values by subtracting motor r from memory r. If the memory r was negative, we took the negative of the difference (to get a positive value). Vice versa for the motor genes. For each cognitive function, we subsampled the number of genes used to the lowest number for calculating the bootstrapped mean difference (231 memory genes and 146 motor genes, respectively, 10,000 iterations). If the 95th percentile did not overlap with the baseline of zero, the bootstrapped difference is considered significant (p < 0.05). Note that for the motor cortical analysis, no negatively correlated genes survived the threshold and thus no motor cortical (–) gene list is shown here. See Extended Data Figure 6-1 for the complete list of correlation value differences for genes used in the bootstrap analysis. *denotes p < 0.05.
- Figure 7.
Precision scores for top-10 cortical and subcortical candidate genes of memory and motor analysis. For a given memory gene list, we calculated the memory and motor precision scores with Equations 1, 2 and their difference. Ideally, memory gene lists should obtain a memory score above 0.5, and a motor score below 0.5, and vice versa for the motor genes. Note that for the motor cortical analysis, no negatively correlated genes survived the threshold and thus no motor cortical (–) gene list is shown. See Extended Data Figure 7-1 for the candidate genes of each analysis and the derived method precision score for each gene list.


Tables
Correlation polarity Cortical analysis Subcortical analysis Gene Mean r Gene Mean r + GRB14 0.24 NEUROD6 0.66 DYRK3 0.21 NEUROD1 0.66 FILIP1 0.21 NPTXR 0.65 SPHKAP 0.21 PLEKHG5 0.65 TMTC1 0.21 NNMT 0.64 TSPAN2 0.21 LRRC2 0.64 S100A10 0.21 C9orf16 0.64 HEYL 0.20 MICAL2 0.64 FZD7 0.20 SLC17A7 0.64 KCTD12 0.20 DUSP4 0.64 − NRAP –0.25 CRNDE –0.64 DLGAP1-AS4 –0.22 FAM222A –0.63 CTNNAL1 –0.21 CRABP1 –0.62 FGF18 –0.20 NTM-AS1 –0.62 MIR124-2HG –0.19 SELENOP –0.62 HIST1H1D –0.19 KIF19 –0.61 TDRD1 –0.19 LOC100506725 –0.61 SLC24A4 –0.18 CA14 –0.61 CCDC144B –0.18 ZFHX4 –0.61 LINC00476 –0.18 LINC00844 –0.61 Top-10 positively and negatively correlated genes from the memory analysis, ranked by the mean correlation magnitude across six donor brains. The positively and negatively correlated genes are listed separately for cortical and subcortical areas. See Extended Data Table 1-1 for the complete list of genes and respective r values.
GO term p q Common across cortex and subcortex Protein targeting to ER 8.2 × 10–67 1.9 × 10–63 mRNA catabolic process 3.5 × 10–41 8.5 × 10–39 Regulation of synaptic plasticity 4.3 × 10⁻⁹ 1.1 × 10⁻⁷ Glutamate receptor signaling pathway 4.1 × 10⁻⁹ 1.1 × 10⁻⁷ Cortex only DNA repair 6.2 × 10⁻²⁹ 7.3 × 10⁻²⁷ Regulation of gene expression, epigenetic 3.7 × 10⁻²⁷ 3.8 × 10⁻²⁵ Interferon-gamma-mediated signaling pathway 3.4 × 10⁻²³ 2.4 × 10⁻²¹ Regulation of neurogenesis 8.9 × 10⁻¹⁶ 4.1 × 10⁻¹² Subcortex only Neurogenesis 3.6 × 10–117 5.6 × 10–114 Neuron projection morphogenesis 5.4 × 10–96 2.4 × 10–93 Glial cell differentiation 6.0 × 10–42 7.5 × 10–40 Myelination 2.1 × 10⁻³⁰ 1.6 × 10⁻²⁸ We identified biological processes linked to memory genes shared or distinct across cortex and subcortex. GO = gene ontology biological process library; p and q refer to p value and FDR q value, respectively. See Extended Data Table 2-1 for the complete list of enriched gene sets and genes from ToppGene.
CL Gene # leading
edge subsetsmean
rAssociated cognitive function Mems Memw Mots Motw Memory
Cortical
+PRKCD 9 0.10 Y RAC1 9 0.07 Y HLA-DRB5 8 0.12 Y HLA-DRB1 8 0.09 Y HLA-DRB4 8 0.09 Y HCK 8 0.09 Y HLA-DRB3 8 0.08 LIMK1 7 0.13 Y Y CDC42 7 0.11 Y VAV1 6 0.15 Y Memory
Cortical
−HIST1H4A 23 –0.18 Y Y HIST1H4E 23 –0.17 Y Y HIST1H4H 23 –0.13 Y Y HIST1H4I 23 –0.12 Y Y HIST4H4 23 –0.11 Y Y HIST1H4J 23 –0.11 Y Y HIST1H4B 23 –0.10 Y Y HIST1H4K 23 –0.10 Y Y HIST1H4F 23 –0.09 Y Y HIST1H4D 23 –0.09 Y Y Candidate gene lists for the memory analysis of cortical regions, from positively and negatively correlated gene lists. Genes are ranked by the number of leading-edge subsets they appear in, and subsequently by mean r value. CL: candidate gene list; # leading-edge subsets: number of leading-edge subsets that the gene was found in; Mems: strong evidence for memory function; Memw: weak evidence for memory function; Mots: strong evidence for motor function; Motw: weak evidence for motor function; +: positively correlated candidate gene list; −: negatively correlated candidate gene list. See Extended Data Table 3-1 for the literature review supporting the cortical gene-cognition associations and Extended Data Table 3-2 for the complete LEA output for cortical analyses.
CL Gene # leading
edge subsetsmean
rAssociated cognitive function Mems Memw Mots Motw Memory
subcortical
+CDK5 27 0.26 Y Y NLGN1 26 0.51 Y UNC13B 26 0.38 Y RAB3A 25 0.40 Y Y STX1A 24 0.57 Y SYT12 23 0.44 Y STX1B 22 0.45 Y SNCA 21 0.44 Y Y SYT1 21 0.39 Y Y UNC13A 20 0.46 Y Y Memory
subcortical
–RPL34 8 –0.54 Y RPS12 8 –0.49 RPS13 8 –0.47 Y RPS15A 8 –0.44 Y RPS29 8 –0.44 RPL11 8 –0.44 Y RPL37A 8 –0.44 RPL10 8 –0.44 Y RPS25 8 –0.44 Y RPS27 8 –0.43 Y See Table 2 for notation, Extended Data Table 4-1 for the literature review supporting the subcortical gene-cognition associations, and Extended Data Table 4-2 for the complete LEA output for subcortical analyses.
Cognitive function Brain region Gene list # cognitive function genes (of 10) p Memory Cortical + 9 3.3 × 10⁻¹³ – 10 1.3 × 10⁻¹⁴ Subcortical + 10 1.3 × 10⁻¹⁴ – 7 2.0 × 10⁻¹⁰ Motor Cortical + 6 7.5 × 10⁻¹⁴ – n/a n/a Subcortical + 8 2.9 × 10⁻¹⁸ – 10 1.1 × 10⁻²² We calculated the chance probability of obtaining N memory genes per gene list (without replacement), by using the proportion of known memory genes out of the 15,625 genes analyzed. Vice versa for motor genes. Note that for the motor cortical (–) analysis, no genes survived the threshold, and thus, no gene list is shown here. See Extended Data Table 5-1 for the known memory and motor function genes and derived effectiveness scores across all gene lists.
Results section Data structure Type of test Power Figs. 3, 4 Gene set enrichment analysis Kolmogorov–Smirnov test FDR < 0.05 Figs. 5, 6 Distribution of bootstrapped correlation r value difference Overlap of 95th percentiles with baseline of zero p < 0.05 Table 4 Distribution of known memory and motor genes out of 15,625 genes Probability of obtaining n memory/motor genes out of 10 without replacement p < 0.001 Statistical tests for the gene set enrichment analysis, bootstrapped correlation r value differences between the memory and motor analyses and the probability of obtaining n memory/motor genes by chance from a known pool of memory and motor genes.
Extended Data Figure 1-1
Visualization of the GRB14 gene expression from the AHBA. Visualized Allen human brain transcriptome atlas on a single donor showing the gene expression z score of regions involved in memory and motor function. Created with the planar viewer at http://human.brain-map.org/. Download Extended Data Figure 1-1, TIF file.
Extended Data Figure 1-2
Visualization of Neurosynth memory and motor neuroimaging maps. Visualized Neurosynth maps using MRIcro showing the z score intensity of regions involved in memory and motor function. Only positive z scores are used. Download Extended Data Figure 1-2, TIF file.
Extended Data Figure 1-3
Cortical and subcortical regions analyzed. Regions used in the cortical and subcortical analyses, as used in Arnatkevic̆iūtė et al. (2019). The ontology follows AHBA naming convention; however, the hippocampus has been relabeled a subcortical structure in line with neuroimaging convention. Download Extended Data Figure 1-3, XLSX file.
Extended Data Table 1-1
Spatial similarity values for 15,625 genes. Spatial correlation values for all genes used in the memory and motor spatial similarity analysis. Download Table 1-1, XLSX file.
Extended Data 1
Code, input and output data for the correlation analysis, containing preprocessed data for input into the spatial similarity analysis script, and output data for usage with GSEA Pre-ranked. Download Extended Data 1, ZIP file.
Extended Data Figure 3-1
GSEA output for the memory cortical analysis, containing all gene sets tested and their respective enrichment scores, p values, and FDR values for the memory cortical analysis in GSEA Pre-ranked. Download Figure 3-1, XLS file.
Extended Data Figure 4-1
GSEA output for the memory subcortical analysis, containing all gene sets tested and their respective enrichment scores, p values, and FDR values for the memory subcortical analysis in GSEA Pre-ranked. The motor cortical and subcortical analyses are also included here. Download Figure 4-1, XLS file.
Extended Data Table 2-1
ToppGene output for the distinct and overlapping genes between cortex and subcortex. Enriched gene sets of the cortex-specific genes, subcortex-specific genes, and overlapping genes, including genes in the gene sets. Download Table 2-1, XLSX file.
Extended Data Figure 5-1
List of distinct and overlapping memory genes between cortex and subcortex. All memory genes derived from the prior GSEA step that are cortex specific, subcortex specific, or shared between cortex and subcortex. It includes motor genes as well. Download Figure 5-1, XLSX file.
Extended Data Table 3-1
Candidate genes for the cortical memory analysis. Literature review for the candidate genes derived from the LEA of cortical memory gene sets, ranked by the number of gene sets it is found in. Download Table 3-1, XLSX file.
Extended Data Table 3-2
LEA output for the memory cortical analysis, containing genes and the significant gene sets it is shared across (FDR < 0.05) from the LEA of memory cortical analysis gene sets. Download Table 3-2, XLSX file.
Extended Data Table 4-1
Candidate genes for the subcortical memory analysis. Literature review for the candidate genes derived from the LEA of subcortical memory gene sets, ranked by the number of gene sets it is found in. Download Table 4-1, XLSX file.
Extended Data Table 4-2
LEA output for the memory subcortical analysis, containing genes and the significant gene sets it is shared across (FDR < 0.05) from the LEA of memory subcortical analysis gene sets. The motor cortical and subcortical analyses are also included here. Download Table 4-2, XLSX file.
Extended Data Figure 6-1
Correlation value differences for memory and motor function genes. For each gene derived from the LEA of memory and motor function gene sets (FDR < 0.05), we extracted the memory and motor correlation analysis r values and calculated the difference. This was used in the bootstrapped correlation values. Download Figure 6-1, XLSX file.
Extended Data Table 5-1
Method effectiveness score for all gene lists, containing known memory and motor function genes, and the probabilities of obtaining n memory and n motor genes from this pool without replacement, respectively. Download Table 5-1, XLSX file.
Extended Data Figure 7-1
Method precision score for all gene lists. Method precision score calculated for memory and motor gene lists, according to Equations 1, 2. Download Figure 7-1, XLSX file.
In this issue


