

Article Figures & Data
Figures
- Figure 1.
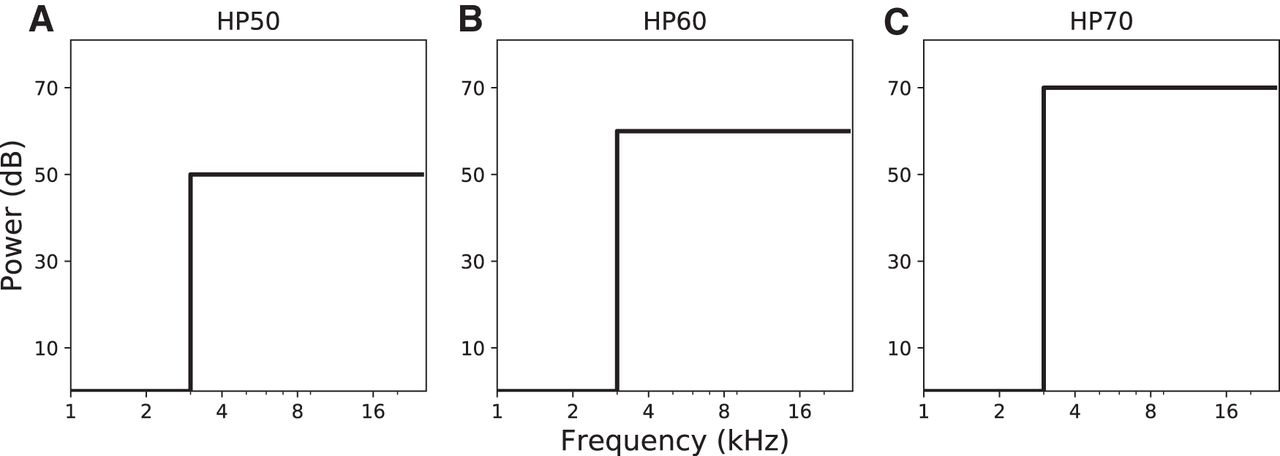
Schematized power spectra of the sound stimuli used in the pre-adaptation/post-adaptation experiment. Stimuli were derived from a GWN control stimulus by removing all frequencies below 3 kHz (HP), at (A) 50-dB SPL (A-weighted), (B) 60 dBA, or (C) 70 dBA.
- Figure 2.
Distribution of sound-source locations, as used in the different experimental paradigms, projected in a flattened Cartesian azimuth-elevation coordinate grid. Note that speakers were attached to a spherical frame, and that in the double-pole azimuth-elevation coordinate system the sum of azimuth and elevation angles can never exceed 90° (outer diamond-shaped boundary). The training targets were located on the azimuth plane, and are indicated in red. They were presented with visual feedback (green dot) at the end of each trial. The pre-adaptation and post-adaptation test targets (red and dark gray) were distributed across the frontal hemifield, and were pseudo-randomly selected for azimuth in [–60,60]°, and for elevation in [–40,+50]°, not including the training targets. In the control experiment of day 1, selected speaker locations were confined to [–80,+80]° for azimuth, and [–40,+50]° for elevation. LL, lateral left; LR, lateral right. The central speaker at (0,0)° and the speaker at the zenith were not used.
- Figure 3.
(A–E) Control results for normal hearing: data from listener S3 in azimuth for the ten control stimuli (LP, HP, and BB at different intensities). Linear regressions (Eq. 1) were performed on the azimuth components of the stimulus–response relations (each point corresponds to a single trial). Responses were highly accurate, as gains and biases were very close to their optimal values of 1.0 and 0.0, respectively.
- Figure 4.
(A–E) Control responses, right-ear plugged (results for S3). Same format as Figure 3. Responses were highly inaccurate, as the gains and biases deviated substantially from their optimal values of 1.0 and 0.0, respectively. Note that low-frequency ITDs could still be used with the plug/muff, as the response gain is still quite high; yet, variability in the responses is considerably higher than for normal hearing.
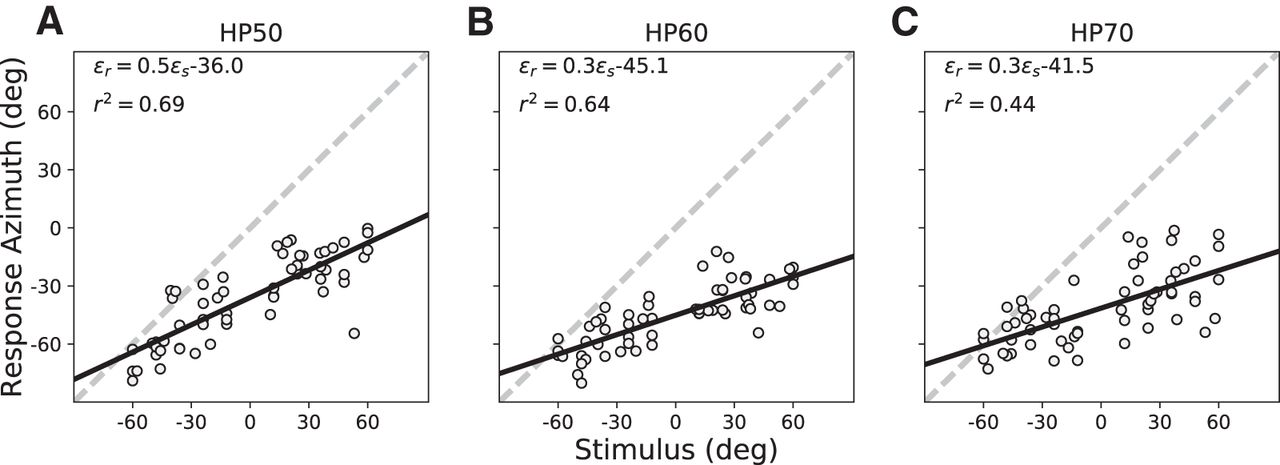
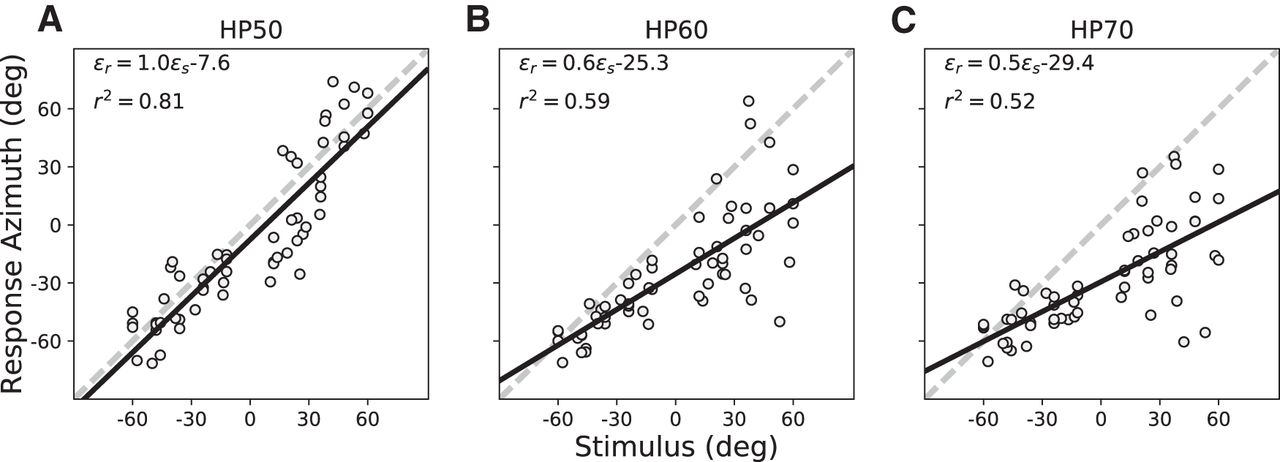
- Figure 5.
(A–C) Pre-adaptation localization results for subject S3 in azimuth for the three test HP stimuli with the right ear plugged. Responses were highly inaccurate, as the gains and biases deviated substantially from their optimal values of 1.0 and 0.0, respectively. However, the slopes of the regression lines differed significantly from zero, indicating that the stimuli contained some azimuth-dependent localization cues.
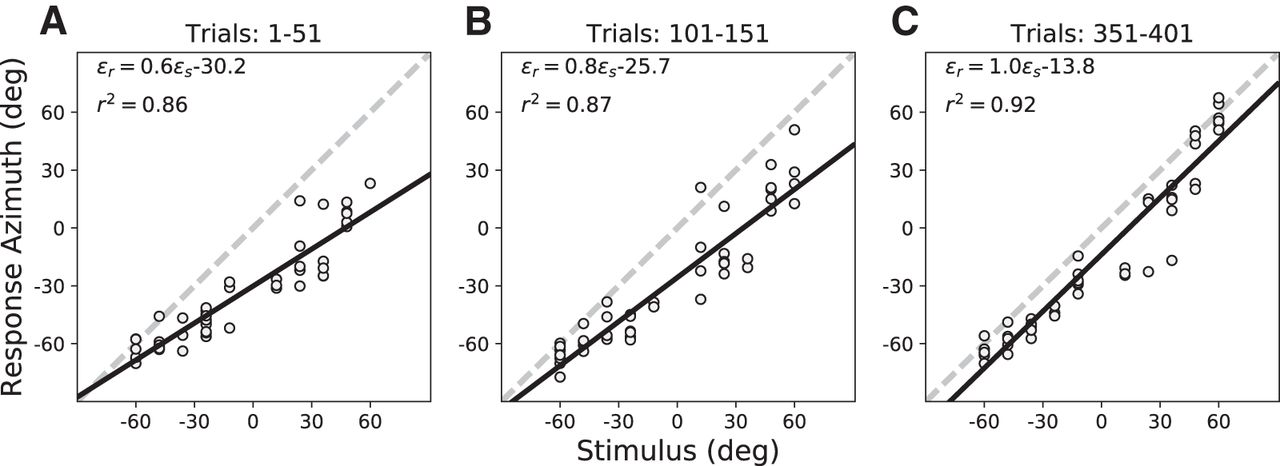
- Figure 6.
(A–C) Training phase localization data for the ten training targets (HP60 stimuli) presented in randomized order with visual feedback in the azimuth plane (elevation zero; Fig. 2) at the start of the session (trials 1–51), after 100 training trials (trials 101–151), and toward the end of the session (trials 351–401). Note the systematic increase of the response gain, and the reduction in response variability (increased r 2) and bias during the session. Data from S3.
- Figure 7.
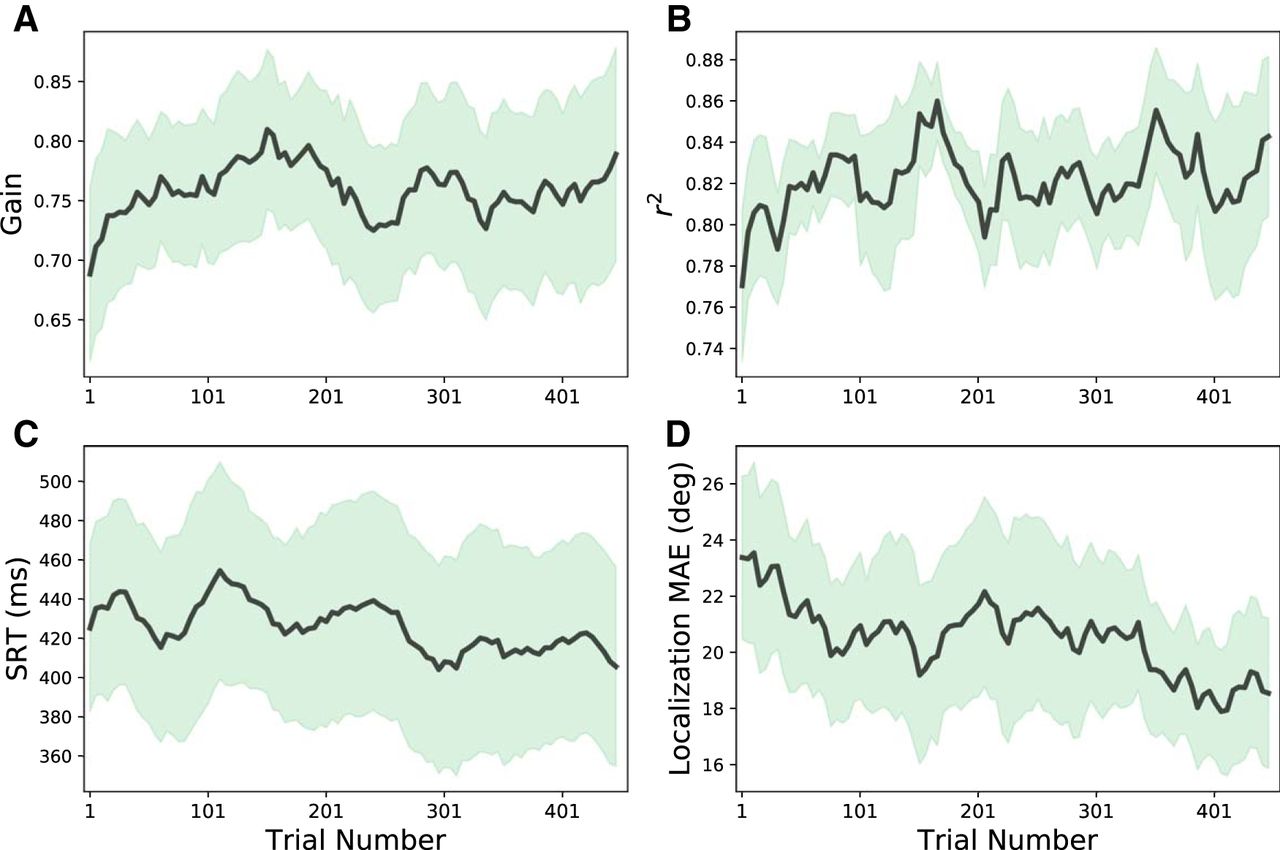
Running averages across participants (bold lines) and SD (shaded areas) of the response azimuth gain (A), response precision, r 2 (B), head-saccade reaction time (in ms; C), and mean absolute localization error (in degrees; D) as function of trial number during the training session. Averages of the parameters were calculated from a running-average window of 50 trials that shifted in five-trial steps through the data. Note that the response gains and r 2 values gradually increased, whereas the reaction times and localization errors to the ten stimuli decreased, which is indicative for gradually improving, and more certain response behavior during the training.
- Figure 8.
(A–C) Post-adaptation localization results for S3. Comparison of these data with Figure 5 shows that azimuth performance had improved for the non-trained azimuth-elevation locations and stimulus levels as well. Note that the leftward bias increases more systematically with increasing sound level than in the pre-adaptation tests (compare Figs. 4, 5).
- Figure 9.
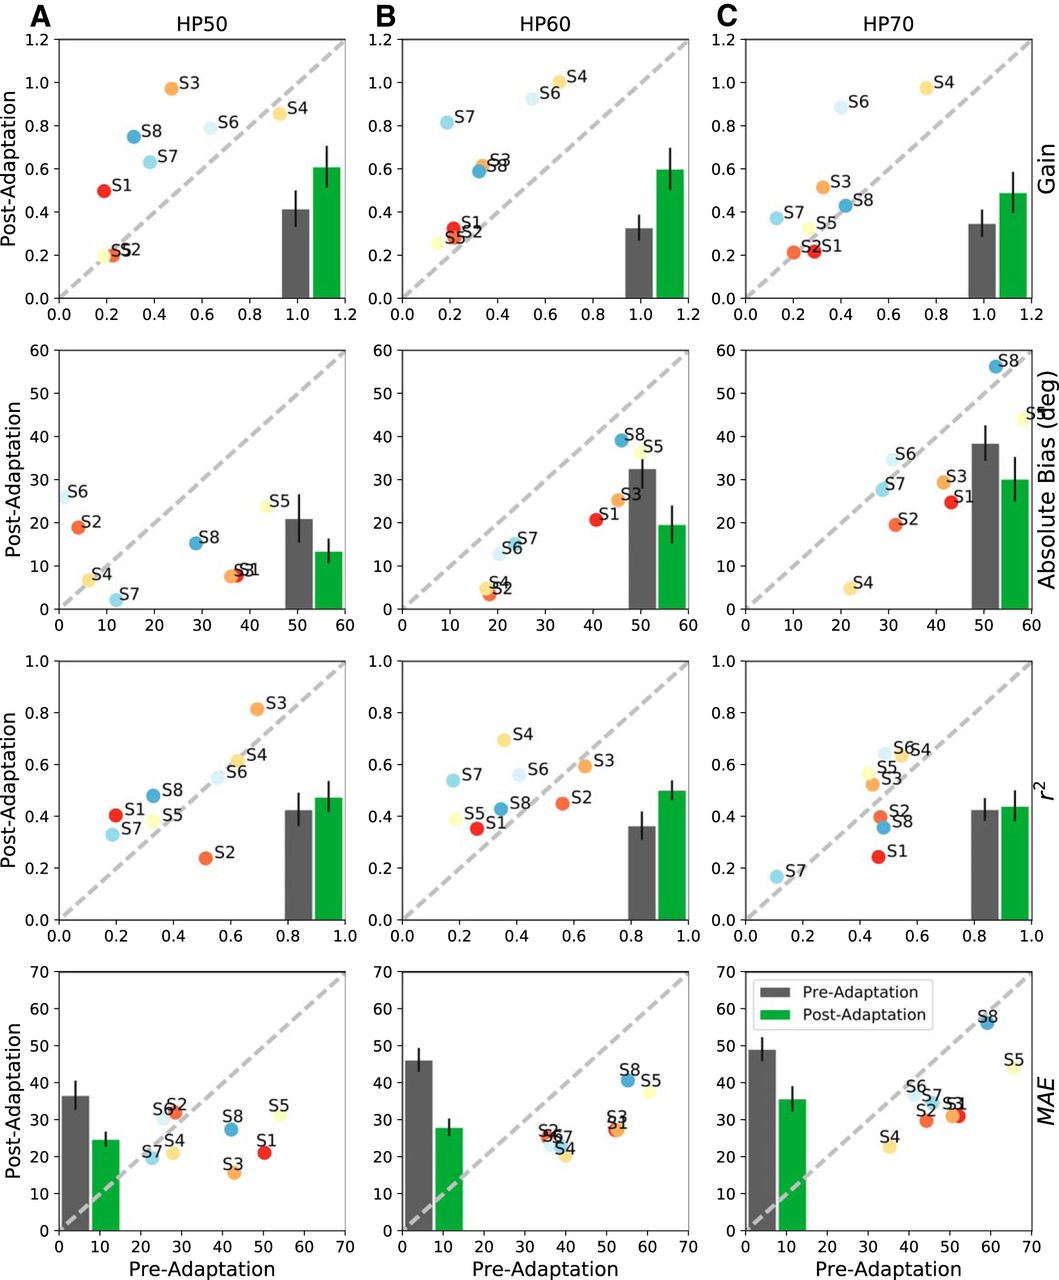
Summarized statistics of the regression analyses for all subjects for the pre-adaptation and post-adaptation tests to HP50 (A), HP60 (B), and HP70 (C) sounds. Columns, The three test stimuli. Top row, Response gain. 2nd row, Response bias (in degrees). 3rd row, Coefficient of determination. Bottom row, MAE (in degrees). Averages across listeners are shown as insets: gray = pre-adaptation, mean with SE, green = post-adaptation data. For nearly all four parameters and stimuli, the post-adaptation results are more accurate (higher gains, smaller bias, smaller MAE) and more precise (less variability, higher r 2).
- Figure 10.
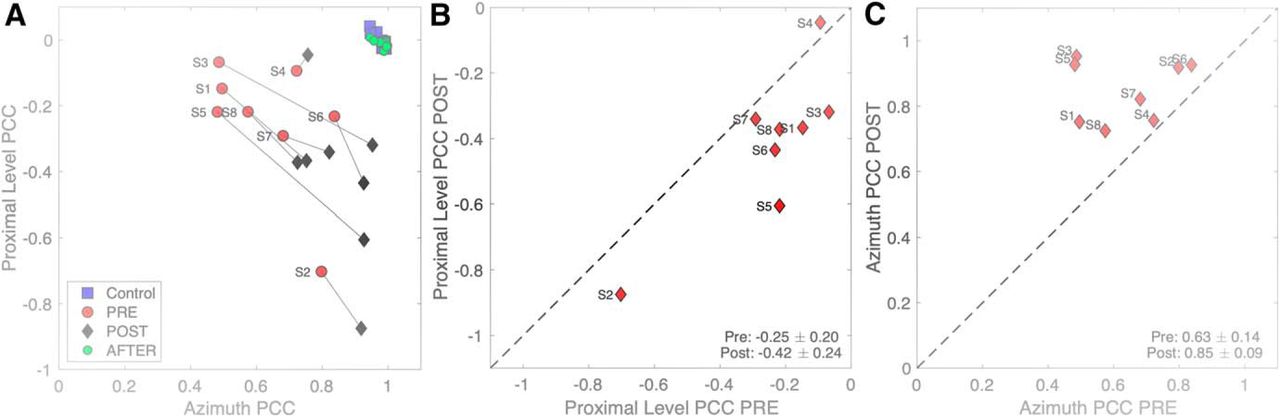
A, Multiple linear regression results of Equation 2 for binaural and acute monaural azimuth localization performance of each listener to sounds presented in the pre-adaptation experiments (red dots; data pooled with the plugged control data) and the post-adaptation experiment (black diamonds); p and q are the partial correlation coefficients for proximal sound intensity and target azimuth, respectively. For comparison, the normal-hearing pre-control data are also included (blue squares), as well as the results immediately after removing the plug (green dots). In these latter conditions, listeners did not rely on the HSE, as their responses were fully accounted for by the true target azimuth. Also, there was no aftereffect, as the green dots fully coincide with the blue squares. In the post-adaptation phase, the azimuth coefficient increased, while the sound-level coefficient decreased. B, The change in the proximal level coefficients indicates that they decreased for nearly all listeners. C, The azimuth coefficient increased for all eight listeners.
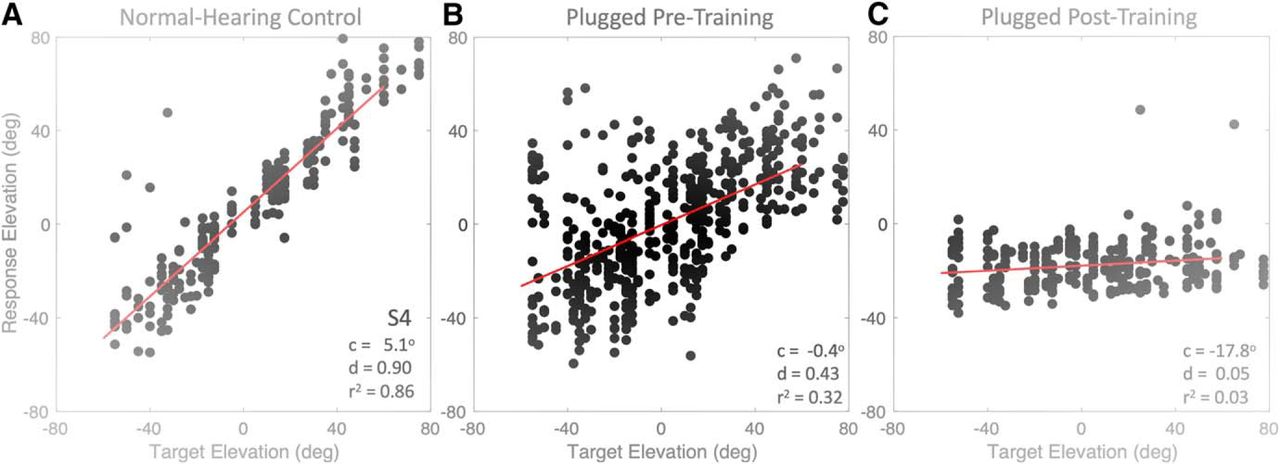
- Figure 11.
Stimulus-response relationships (Eq. 1) for elevation of listener S4 under (A) normal hearing, (B) after inserting the plug, before the training (pooled data from the control session and the HP targets), and (C) immediately after the training, with plugged hearing. Note the detrimental effect of the training on the listener’s elevation performance with the right-ear plug. After plug removal, the stimulus-response relation was very similar to the data in A (data not shown; but see Fig. 12A), indicating absence of an aftereffect.
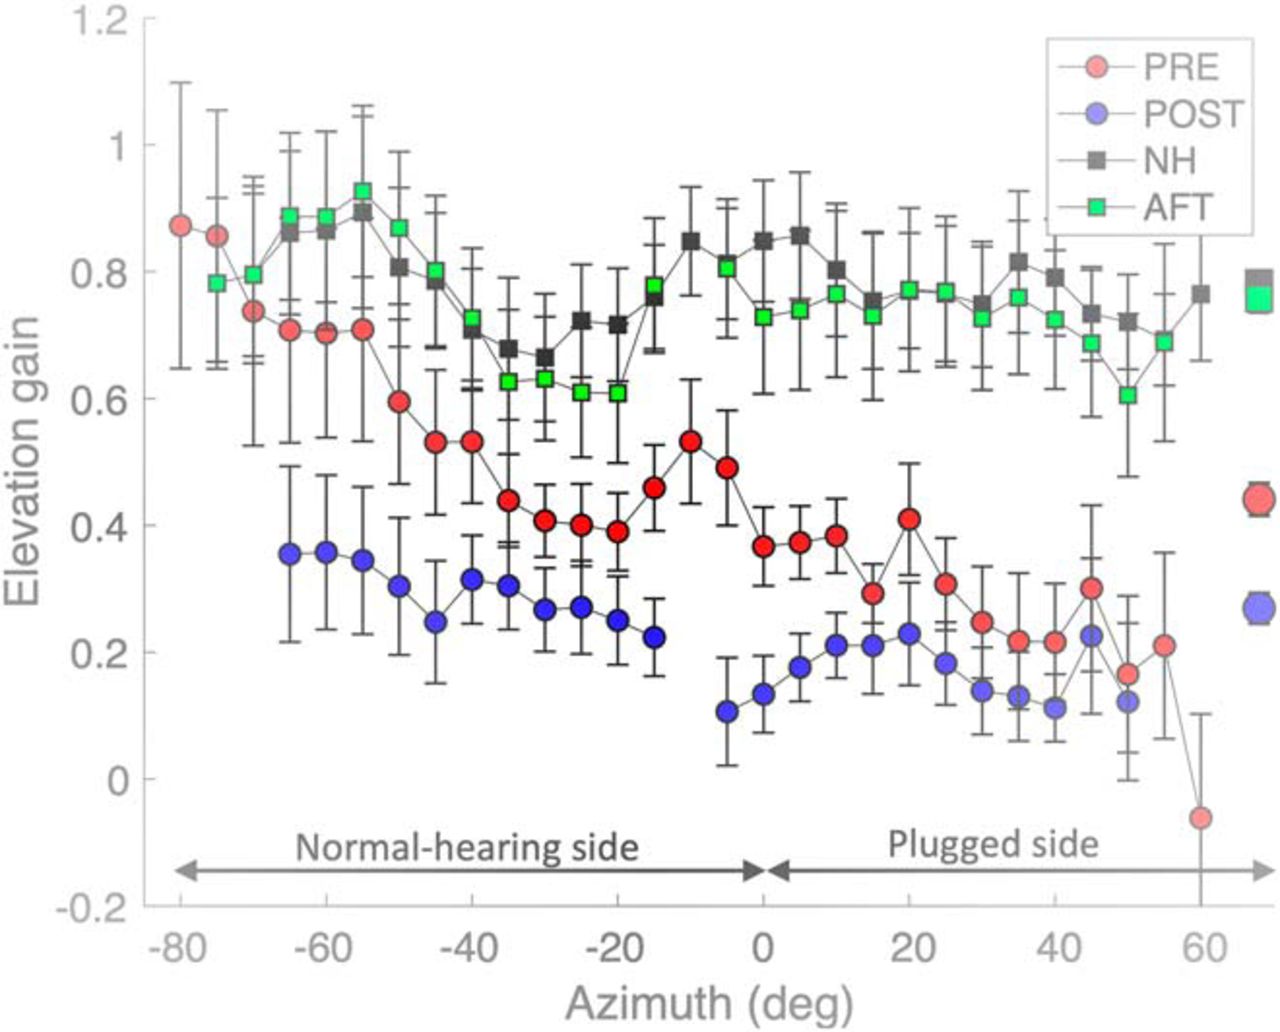
- Figure 12.
Mean local elevation gains (Eq. 1; averaged across all eight listeners, with SEs) as function of target azimuth. The local gains were determined for data selected within 20° wide azimuth bins, which were shifted in 5° steps from –80° to +60°. Note that the pre-adaptation and post-training normal-hearing control gains (black and green squares) were indistinguishable, and remained high throughout the azimuth range. The acute pre-adaptation gains (plug in right ear) show a gradual decrease of the elevation gain from normal values on the far-left hearing side to nearly zero on the far-right plugged side (red dots). After training, the mean elevation gains became very low also on the hearing side (blue dots). Symbols on the right, Overall means across azimuths and subjects.
- Figure 13.
Results of multiple linear regression on the elevation response components for all listeners (Eq. 4). A, D, After adaptation, the contribution of the target’s elevation to the elevation response tended to decrease, whereas the contributions to the elevation percept of proximal sound level slightly decreased (B), but for source azimuth (C) did not change systematically. Note that localization performance after plug removal (green dots) was indistinguishable from the normal-hearing pre-adaptation control data (blue squares). Listener S2 had poor elevation performance in the normal-hearing and pre-plugged control, and shows up as an outlier in panels A, B, D.
- Figure 14.
Results of multiple linear regression on the elevation responses from listener S6 for (A) normal-hearing, (B) right-ear plugged pre-training (all control data and test data pooled), (C) post-training data plugged. Data have been sorted for the left (hearing ear; blue) and right (plugged ear; red) side. Note the separation of upward (positive response) versus downward (negative response) perceived elevations after training for leftward versus rightward targets, respectively.
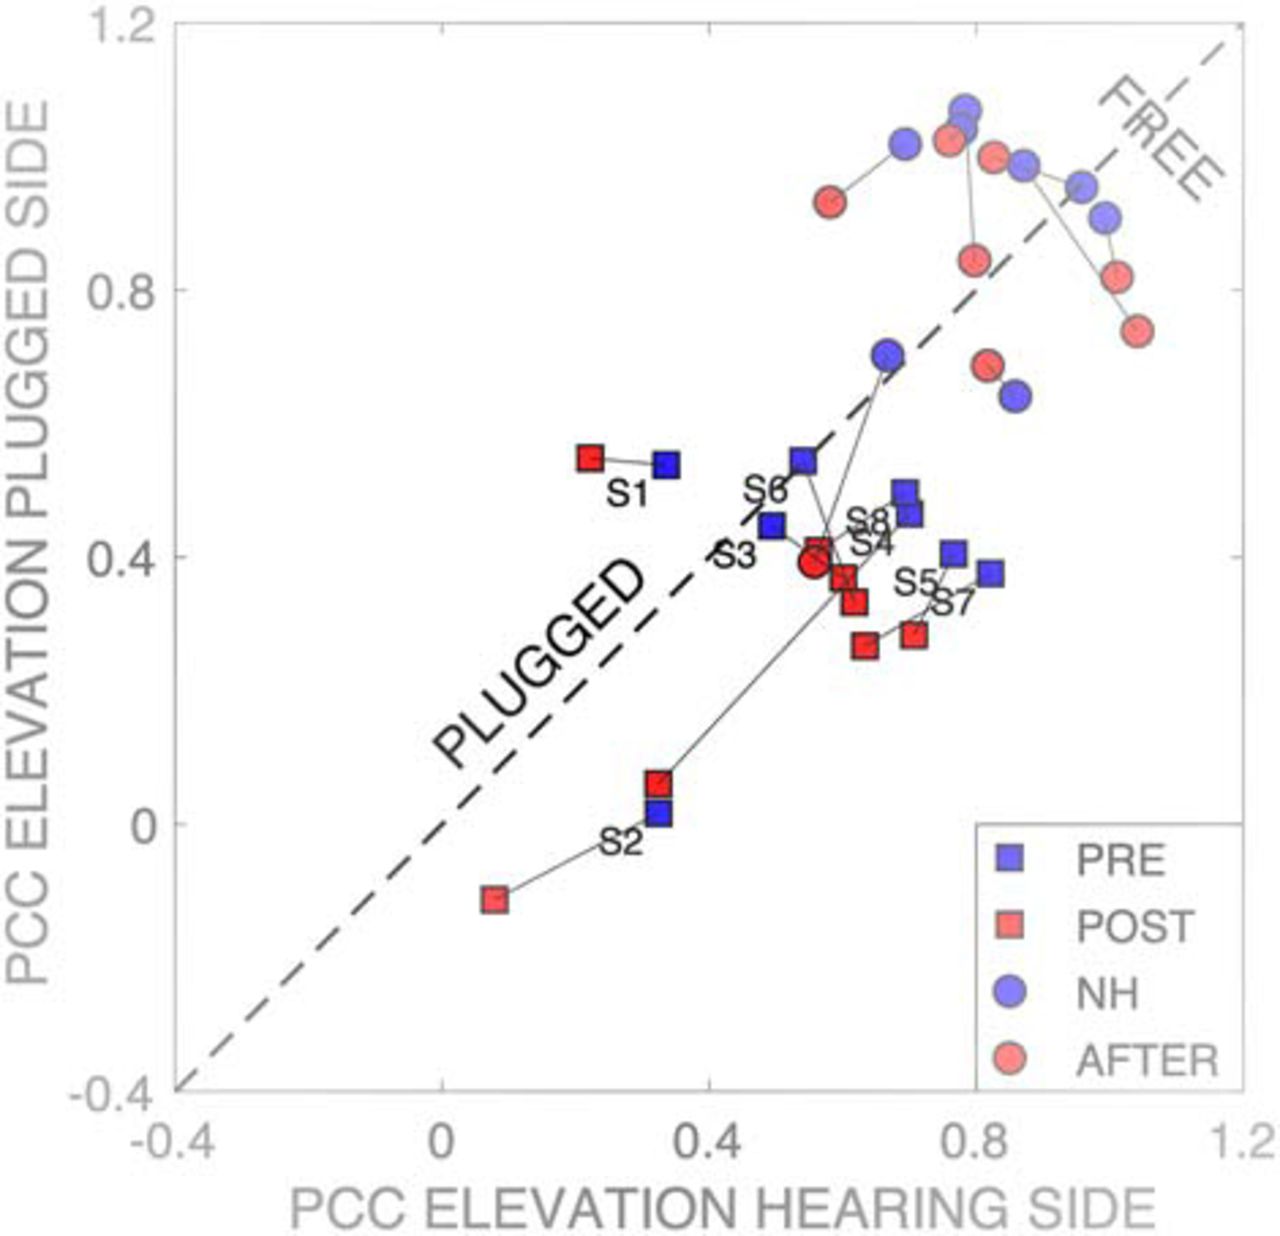
- Figure 15.
Multiple linear regression results (Eq. 4) on the elevation data for the left (hearing) versus right (plugged) hemifields for all listeners and hearing conditions. Squares correspond to the plugged conditions (blue: pre-training; red: post-training), dots indicate the normal-hearing conditions before (blue) and after (red) the training. The normal-hearing results remain unchanged, and close to the ideal value of 1.0. In the pre-training plugged condition, target elevation on the hearing side had a stronger contribution to the elevation responses than on the plugged side, as most data points lie below the diagonal. After training, responses on both sides show a decrease of the spectral cue-contributions to elevation (red squares).
- Figure 16.
Six acoustic cues can contribute to the perceived azimuth, whereas the left- and right HRTFs determine the elevation percept, modulated by an azimuth-dependent binaural weighting and internal priors. The strength (reliability) of a cue is indicated by line thickness. p,q,s are the partial correlations, obtained from Equations 2, 4. A, Under normal-hearing, the azimuth percept is fully determined by robust ITD and ILD cues, and the elevation percept mainly by the veridical HRTFs and azimuth. B, After acute monaural plugging (in the contra ear, c), azimuth is determined by low-frequency ITDs, and the monaural intensity and filter cues from the HSE. The resulting azimuth percept modulates the elevation percept, thereby decreasing the weight of the plugged ear. C, After training, the elevation percept is more strongly influenced by the prior (at the horizon), and less by the sensory spectral and azimuth cues.


Tables
- Table 1.
One-sided sign tests on the regression parameters across stimulus types (n/24 values) and for the three stimulus types across the regression parameters (n/32 values; see Fig. 9).
Component Gain Absolute bias r 2 MAE Azimuth 20/24 p < 10–3 20/24 p < 10–3 17/24 p < 0.025 22/24 p < 10–4 Component HP50 HP60 HP70 All Azimuth 25/32 p < 10–3 26/32 p < 10–3 23/32 p < 10–2 74/96 p < 10–7 n/24 signifies that n parameter values out of 24 fell above (gain, r 2) or below (bias, MAE) the main diagonal, indicative for a localization improvement. Bottom-right: all measures (n/96 values).
In this issue


