

Article Figures & Data
Figures
- Figure 1.
Evoked response paradigm. A, Immediately after the retention trial, the conditioned and no-shock rats were anesthetized and underwent surgery for the evoked potential experiments. Home-cage rats were never handled before the evoked response recordings. B, A 16-site linear electrode array was placed in the dorsal hippocampus, spanning the somatodendritic axis of CA1 and the DG. A bundle of stimulating electrodes was placed in the perforant path to stimulate EC inputs. C, The recording probes were localized by performing CSD analysis, which identifies sinks and sources of the stereotypical response to perforant path stimulation at each layer. CA1: so = stratum oriens, pyr = pyramidal cell layer, strat. rad. = stratum radiatum, DG: mol = molecular layer, grc = granule cell layer, hif = hillar fissure. D, Quantification of the synaptic and evoked activity from the CSD was performed either by calculating the AUCs for sinks and sources before or after the PS activity and was performed for each layer of CA1 and DG. The other approach quantified the fEPSP of the molecular and granule cell layers and population spiking activity of the granule cell layer. E, Recording sites were verified histologically. Red lines indicate positions of the recording probes for the experiments performed. Anteroposterior coordinates relative to bregma are indicated next to the coronal sections.
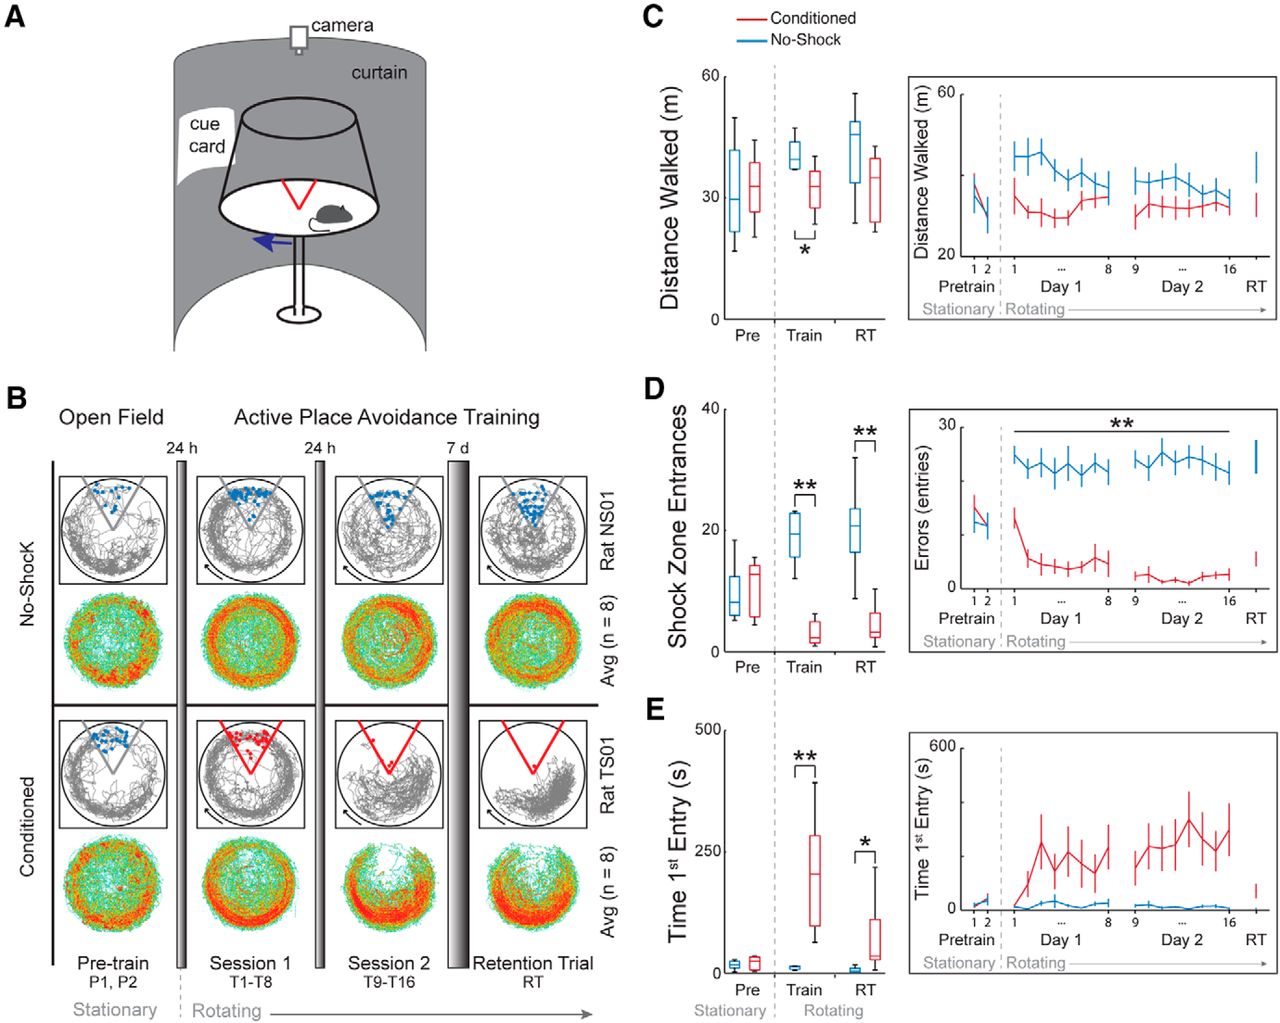
- Figure 2.
Memory-related behavior is different between conditioned and no-shock rats. A, Rats were placed on a rotating arena and conditioned to avoid a mild foot shock within a 60° sector that was stationary within the room. The no-shock group was exposed to the same conditions, but without foot shock. B, The rats were given two pretraining trials on a stationary arena without shock. The next day the rats started 2 d of conditioning (sessions 1 and 2). Each day a conditioning session consisted of eight training trials. One week after the end of conditioning, the rats were given a retention trial to test memory. For the conditioned group, the retention trial was conducted with the shock on. All trials were 10 min with at least 10 min intertrial intervals. Example paths (in gray) of one no-shock rat and one conditioned rat are shown over the course of training. The red dots represent where the animal received shocks and blue dots indicate where the animal would have received shock if the shock had been present. The heat maps show average time spent for all rats in each 0.3 × 0.3-cm region for each group. Red represents an average dwell of >0.017 s. By the end of the training period, the conditioned rats avoid the 60° sector (bottom) while the no-shock rats do not exhibit a place bias. C–E, Box plots of behavioral measures for the pre-training session, the training sessions (trials 1–16), and the retention trial show there are differences between no-shock and conditioned rats. Asterisks in the box plots (C–E, left) indicate a main effect of group, while asterisks in the line graph (C–E, right) indicate group differences. no-shock, n = 8; conditioned, n = 8. Plots to the right of the boxplots represent mean ± SEM on a trial-by-trial basis; *p < 0.05, **p < 0.01.
- Figure 3.
Behavior-induced alterations to DG circuit function assessed by response to perforant path stimulation. A, The CSD (black traces) was computed from the recorded voltage traces (gray) to remove volume conducted signals. The sites determined to be located in slm, molecular layer and granule cell compartments (orange arrows) were used for further evaluation. The average ± SEM (shading) sl-CSD are shown. B, Average CSD heatmaps were generated for each group. Cooler colors are sinks (inward current) and warmer colors are sources (outward current). The sink in the molecular layer appears to increase with experience and cognitive demand. C, The AUC of the pre-spike response (1.5 ms after the stimulation was delivered until the spike occurred) and the post-spike response (from the spiking activity until 20 ms after stimulation) were quantified at the maximum stimulation given to all animals (800 μA) for each layer of the somatodendritic axis of the dorsal hippocampus. The pre-spike sink at the molecular layer is not changed by experience whereas the post-spike sink in the molecular layer is significantly altered by experience. CA1: so = stratum oriens, pyr = pyramidal cell layer, strat. rad. = stratum radiatum, DG: mol = molecular layer, grc = granule cell layer. D, top, The I-O curve that characterizes the pre-spike sink, synaptic population response to the full range of stimulus intensities, is significantly increased in conditioned rats compared to both no-shock and home-cage groups. Bottom, The post-spike response to increasing stimulation intensity is significantly increased in conditioned rats compared to the no-shock response, which is also significantly increased compared to home-cage rats. E, The sl-fEPSP characterizing the population synaptic response at the molecular layer is significantly increased by conditioning, confirming the findings based on the sl-AUC. F, The sl-fEPSP at the granule cell layer is significantly different between conditioned and home-cage groups. G, The PS response at the granule cell layer is significantly increased by experience. Example CSD waveforms are plotted in E–G in black for illustration with schematization of the measurement corresponding to the figure. The voltage trace is underlaid in gray. Home-cage, n = 6; no-shock, n = 6; conditioned, n = 7. Data are mean ± SEM. *p < 0.05. Colored asterisks indicate which group is different from the other two.
- Figure 4.
Coupling between the field synaptic potentials and population spiking is not different between groups. A, The sl-fEPSP measured at the molecular layer is plotted against the sl-PS measured at the granule cell layer for each stimulation response, with intensity varying from 100 to 1000 μA. The Boltzmann fit to each animal’s E-S coupling is overlaid. B, Average parameters of the Boltzmann fit per group show no difference due to experience in the sl-PSmax (left), the sl-fEPSP50 (middle), and the slope (right). C, The sl-fEPSP measured at the granule cell layer is plotted against the sl-PS measured at the granule cell layer. D, Average parameters of the Boltzmann fit per group also show no difference due to experience in the sl-PSmax (left), the sl-fEPSP50 (middle), and the slope (right). The inset in C schematizes the role of the parameters of the Boltzmann fit. The example CSD waveforms in B, D are plotted for illustration.


In this issue


