

Article Figures & Data
Figures
- Figure 1.
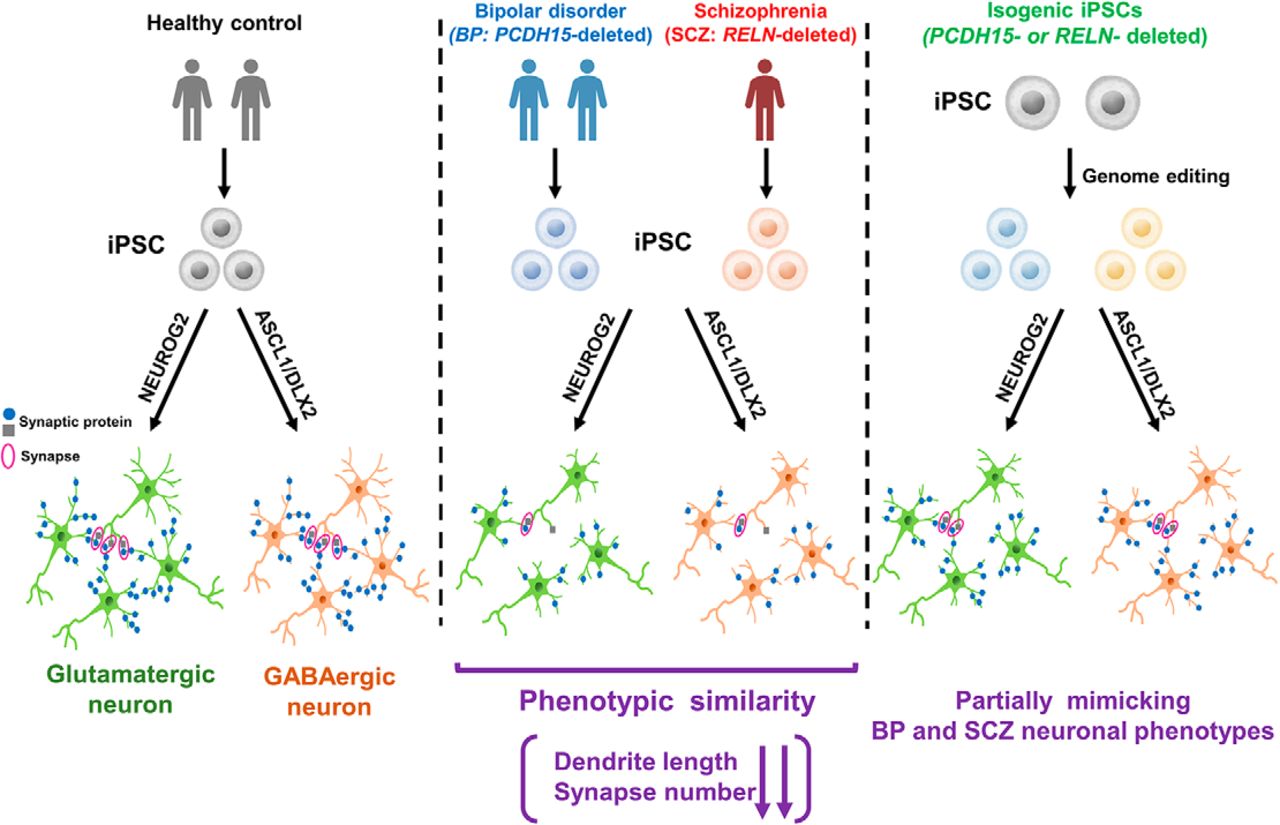
Generation and characterization of iPSCs derived from a BP patient. A, Schematic diagram of the strategy to explore the phenotypes of BP and SCZ in vitro. B, Subjects list containing basic information. C, CNVs in chromosome 10 were detected in blood and iPSCs derived from two BP patients by aCGH. D, The exonic deletions of PCDH15 identified in this study were validated by the TaqMan copy number assays. Bars indicate copy numbers predicted by the TaqMan copy number assays. Capped bars indicated the minimum and maximum copy number calculated for the sample replicate group (n = 4). Controls carried no aCGH-detected CNVs of PCDH15 (copy number = 2) and were used to calibrate the assays. E, The generated iPSCs expressed the pluripotent markers Oct4, Nanog, SSEA4, and Tra1-60. Scale bar, 100 μm. F, Representative images of immunocytochemical analysis for in vitro three-germ layer differentiation. βIII-Tubulin, αSMA, and AFP are pluripotent markers of the ectoderm, mesoderm, and endoderm, respectively. Blue indicates Ho, and green indicates the pluripotent marker. Scale bar, 100 μm.
- Figure 2.
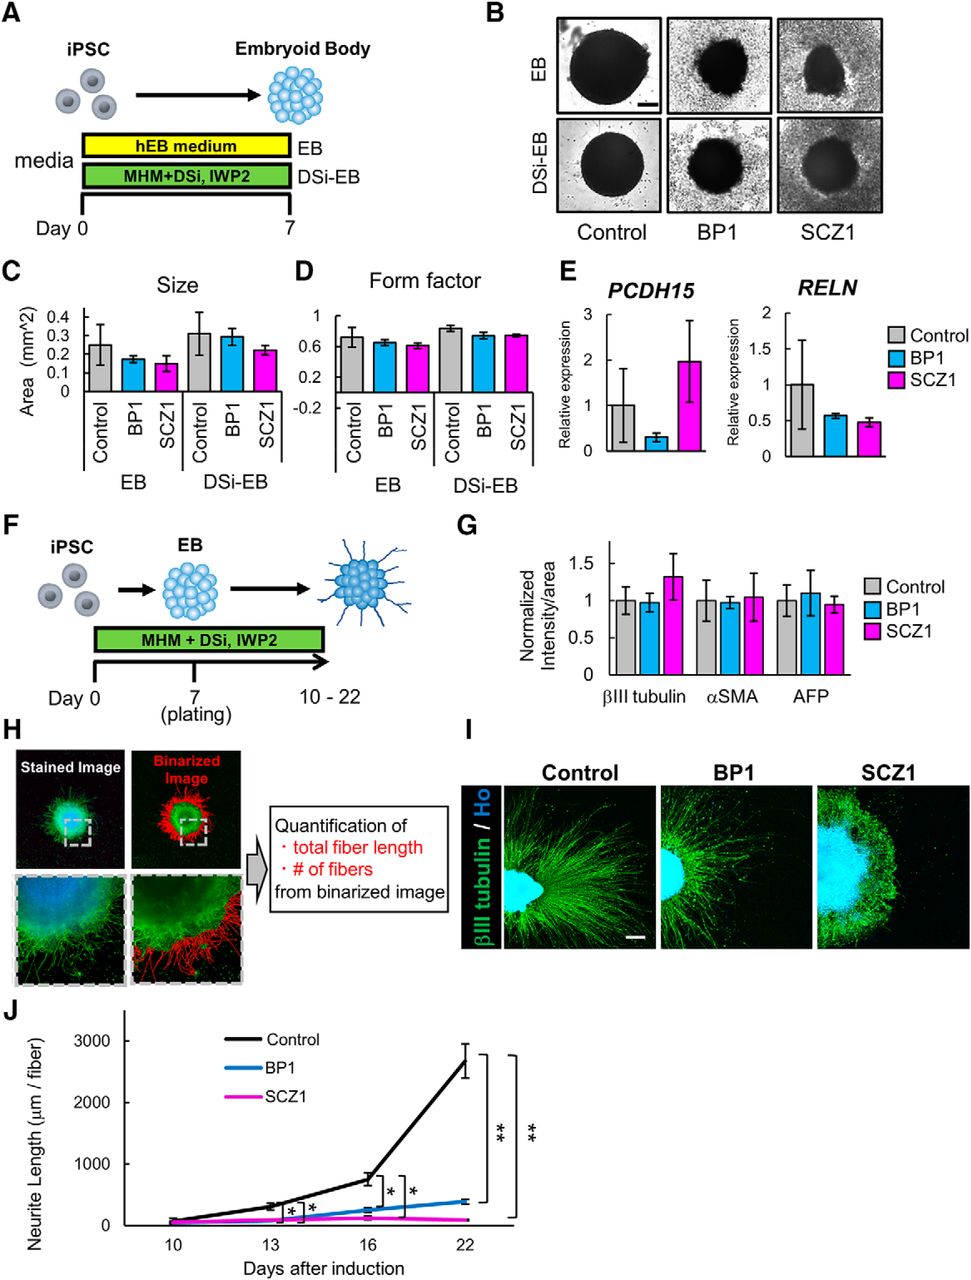
Neuron differentiation via EB formation. A, Overview of the protocol for EB formation. DSi represents SB431542 and LDN193189. B, Representative images of EBs on day 7. Scale bar, 200 μm. C, Quantification of EB sizes (n = 3 independent experiments; mean ± SD; Dunnett’s test, no significant differences were observed). D, The form factor of the EBs was calculated as an indicator of roundness. E, Gene expression of iPSCs and DSi-EBs. E, Relative gene expression levels of PCDH15 and RELN in DSi-EBs derived from six control lines, two BP lines (BP1-1 and BP1-2), and two SCZ lines (SCZ1-1 and SCZ1-2; n = 3 independent experiments; mean ± SD; Dunnett’s test). Values were normalized to that of the control, which was considered to be 1.0. One sample of 1210B2-derived DSi-EBs, in which PCDH15 expression was under the detection limit, was removed from the analysis. F, Overview of the protocol for neuron differentiation via EB formation. DSi represents SB431542 and LDN193189. G, Intensity levels of three germ layer markers, namely, βIII-tubulin, αSMA, and AFP. Intensity levels were normalized to that of the control, which was considered to be 1.0 (n = 3 independent experiments; mean ± SD; Dunnett’s test among each group, no significant differences were observed). H, Schematic diagram of the analysis protocol. Fiber length and number of βIII tubulin+ cells were quantified from binarized image data obtained from stained images. I, Representative images of βIII-tubulin+ neurons. Scale bar, 300 μm. J, Time-dependent changes of βIII-tubulin+ mean neurite length per neurite fiber (n = 3 independent experiments; mean ± SD; *p < 0.05, **p < 0.01; Dunnett’s test among each group). Mean neurite length is shown as the mean length of βIII-tubulin+ neurite fiber.
- Figure 3.
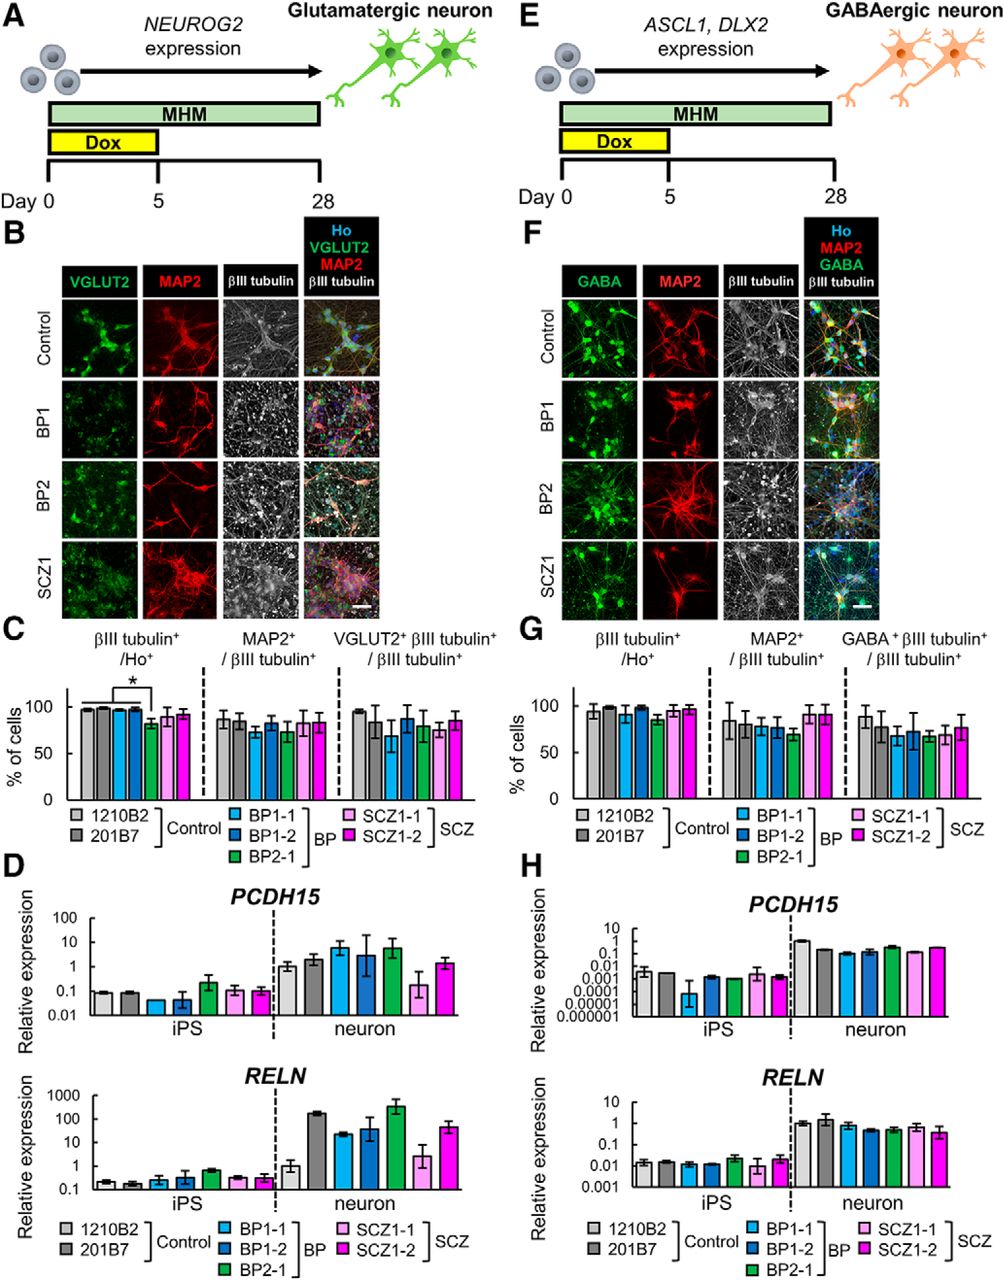
Neuron differentiation by transcription factor overexpression. A, Overview of the protocol for differentiation into glutamatergic neurons. B, Immunocytochemical analysis of neuronal markers (VGluT2, MAP2, and βIII tubulin). Scale bar, 40 μm. C, Ratio of positive cells for each marker; βIII tubulin+ cells/all cells (βIII tubulin+/Ho+), MAP2+ cells/βIII tubulin+ cells (MAP2+/ βIII-tubulin+), and VGluT2 and βIII tubulin double+ cells/βIII tubulin+ cells (VGLUT2+βIII tubulin+/βIII tubulin+). (n = 3-6 independent experiments; mean ± SD; *p < 0.05; Tukey’s test, the population of βIII tubulin+ cells in BP2-1-derived neurons was significantly lower than those in 1210B2-, 201B7-, BP1-1-, and BP1-2-derived neurons). D, Relative gene expression levels of PCDH15 (primer set1) and RELN in NEUROG2-transduced iPSCs and induced neurons (n = 3 independent experiments; mean ± SD; Dunnett’s test among iPSCs and among neurons, no significant differences were observed). Values were normalized to that for 1210B2-derived neurons, which was considered to be 1.0. Some iPSC samples, in which PCDH15 expression was under the detection limit, were removed from the analysis. Specifically, two samples of BP1-1, and one sample of 1210B2, 201B7, BP2-1, and SCZ1-1 were excluded from the analysis. E, Overview of the protocol for differentiation into GABAergic neurons. F, Immunocytochemical analysis of neuronal markers (MAP2, GABA, and βIII tubulin). Scale bar, 40 μm. G, Ratio of positive cells for each marker; βIII tubulin+ cells/all cells (βIII tubulin+/Ho+), MAP2+ cells/βIII tubulin+ cells (MAP2+/βIII tubulin+), and GABA and βIII-tubulin double-positive cells/βIII tubulin+ cells (GABA+βIII tubulin+/βIII tubulin+). (n = 3-6 independent experiments; mean ± SD; Tukey’s test; no significant differences were observed). H, Relative gene expression levels of PCDH15 and RELN in ASCL1- and DLX2-transduced iPSCs and induced neurons. (n = 3 independent experiments; mean ± SD; Dunnett’s test among iPSCs and among neurons; no significant differences were observed). Values were normalized to that for 1210B2-derived neurons, which was considered to be 1.0. Some iPSC samples, in which PCDH15 expression was under the detection limit, were removed from the analysis. Specifically, each one sample of 1210B2 and BP2-1 was excluded from the analysis.
- Figure 4.
Comparison of the global gene expression profiles. A, PCA of the gene expression data of glutamatergic neurons. B, Hierarchical clustering analysis of DEGs in glutamatergic neurons. C, Venn diagram of DEGs of BP or SCZ glutamatergic neurons compared with control neurons (fold change, >2.0). A total of 498 genes were common between the two groups compared. D, Featured GO and pathway terms for the 498 common DEGs among the control vs BP and control vs SCZ. Adhesion- and neuron-associated terms were extracted. E, PCA plot of the gene expression data of GABAergic neurons. Green, control (1210B2, 201B7); blue, BP; red, SCZ. F, Hierarchical clustering analysis of DEGs in GABAergic neurons. G, Venn diagram of DEGs of BP or SCZ GABAergic neurons in comparison with control neurons (fold change, >2.0). A total of 522 genes were common among the two comparisons. H, Featured GO and pathway terms for 522 common DEGs among the control vs BP and control vs SCZ. Adhesion- and neuron-associated terms were extracted.
- Figure 5.
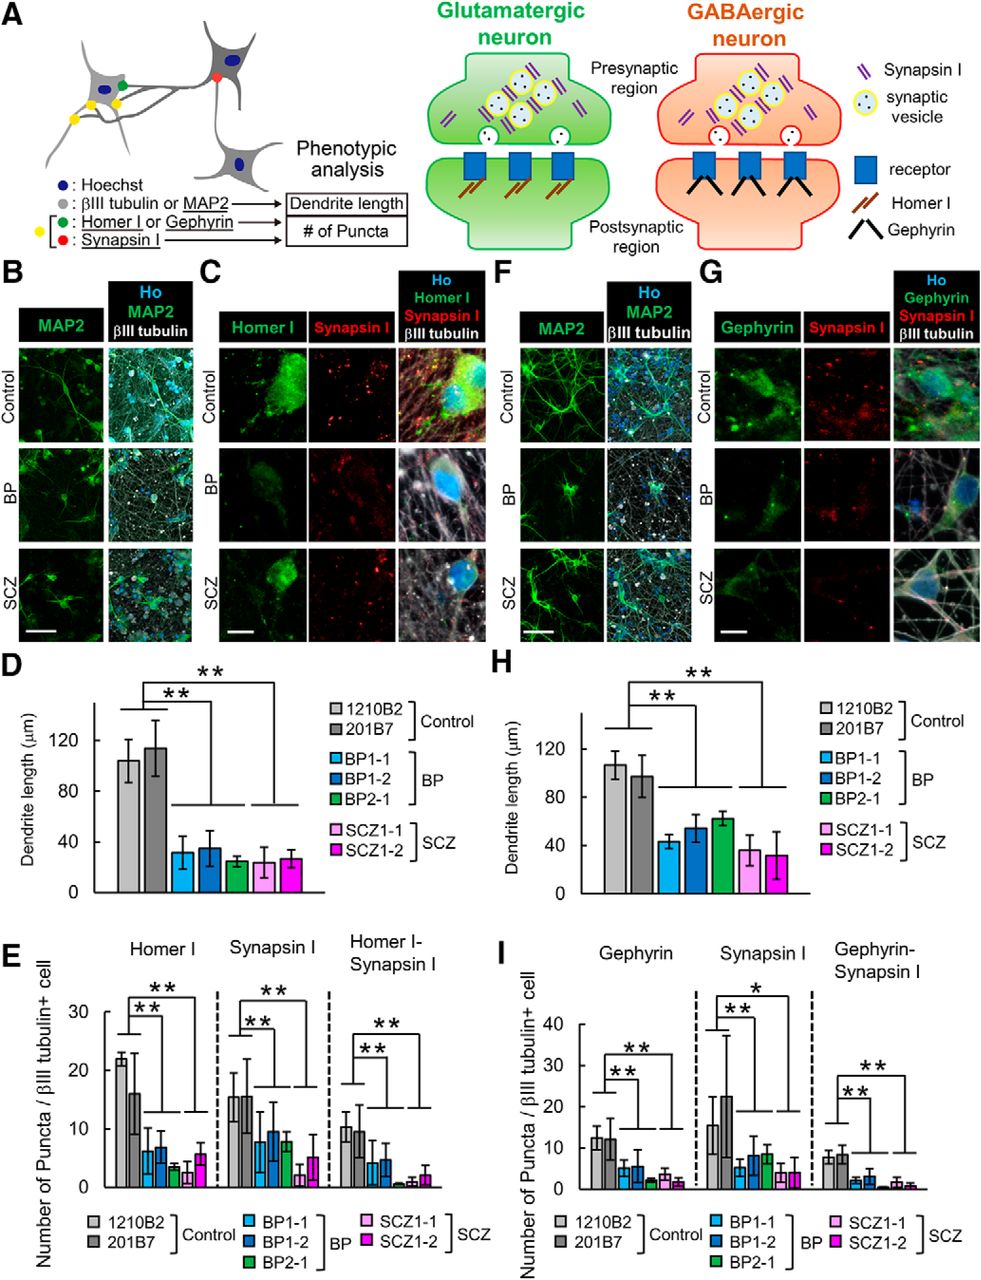
Neurons induced from patient-derived iPSCs exhibit abnormal phenotypes of dendrite length and synapse formation. A, Schematic diagram of the protocol for phenotypic analysis of dendrite lengths and number of synaptic markers of the neurons. B, C, Representative images of immunocytochemical analysis of a dendrite marker (MAP2; scale bar, 60 μm; B) and synaptic markers (Homer I, Synapsin I; scale bar, 10 μm; C) in glutamatergic neurons. D, Quantitative analysis of dendrite length in glutamatergic neurons (n = 3-6 independent experiments; mean ± SD; **p < 0.01; Dunnett’s test). E, Quantitative analysis of the number of synaptic marker puncta in glutamatergic neurons (n = 3-6 independent experiments; mean ± SD; *p < 0.05, **p < 0.01; Dunnett’s test). Homer I puncta, Synapsin I puncta and Homer-Synapsin I colocalized puncta on βIII-tubulin+ cells were counted. F, G, Representative images of immunocytochemical analysis of a dendrite marker (MAP2; scale bar, 60 μm; F) and synaptic markers (Gephyrin, Synapsin I; scale bar, 10 μm; G) in GABAergic neurons. H, Quantitative analysis of dendrite length in GABAergic neurons (n = 3-6 independent experiments; mean ± SD; **p < 0.01, Dunnett’s test). I, Quantitative analysis of the number of synaptic marker puncta in glutamatergic neurons (n = 3-6 independent experiments; mean ± SD; *p < 0.05, **p < 0.01, Dunnett’s test). Gephyrin puncta, Synapsin I puncta, and Gephyrin-Synapsin I colocalized puncta on βIII tubulin+ cells were counted.
- Figure 6.
Generation of isogenic PCDH15 deletion iPSCs by targeted genome editing. A, The target sites of CRISPR-sgRNAs in exon 9 of the PCDH15 gene (NM_001142763). Red bars represent PAM (protospacer adjacent motif) sequences. B, Analysis of CRISPR-sgRNA activity by the T7E1 assay using HEK293FT. NTC, No transfection. Among the constructed sgRNAs, sgRNA#3 showed the strongest cleavage activity. C, Indel pattern of the isogenic line using CRISPR-sgRNA#3. Blue letters represent stop codon. D, Representative images of immunocytochemical analysis for in vitro three-germ layer differentiation. Blue indicates Ho and green indicates the pluripotent marker (βIII-tubulin, αSMA, and AFP). Scale bar, 100 μm. E, Relative gene expression levels of PCDH15 (primer set2) in glutamatergic or GABAergic neurons on day 28 (n = 3 independent experiments; mean ± SD; *p < 0.05, Student’s t test). F, Information of isogenic RELN-deleted iPSCs generated in the previous study (Arioka et al., 2018). G, Relative gene expression levels of RELN in induced glutamatergic or GABAergic neurons on day 28 (n = 3 independent experiments; mean ± SD; **p < 0.01, Student’s t test).
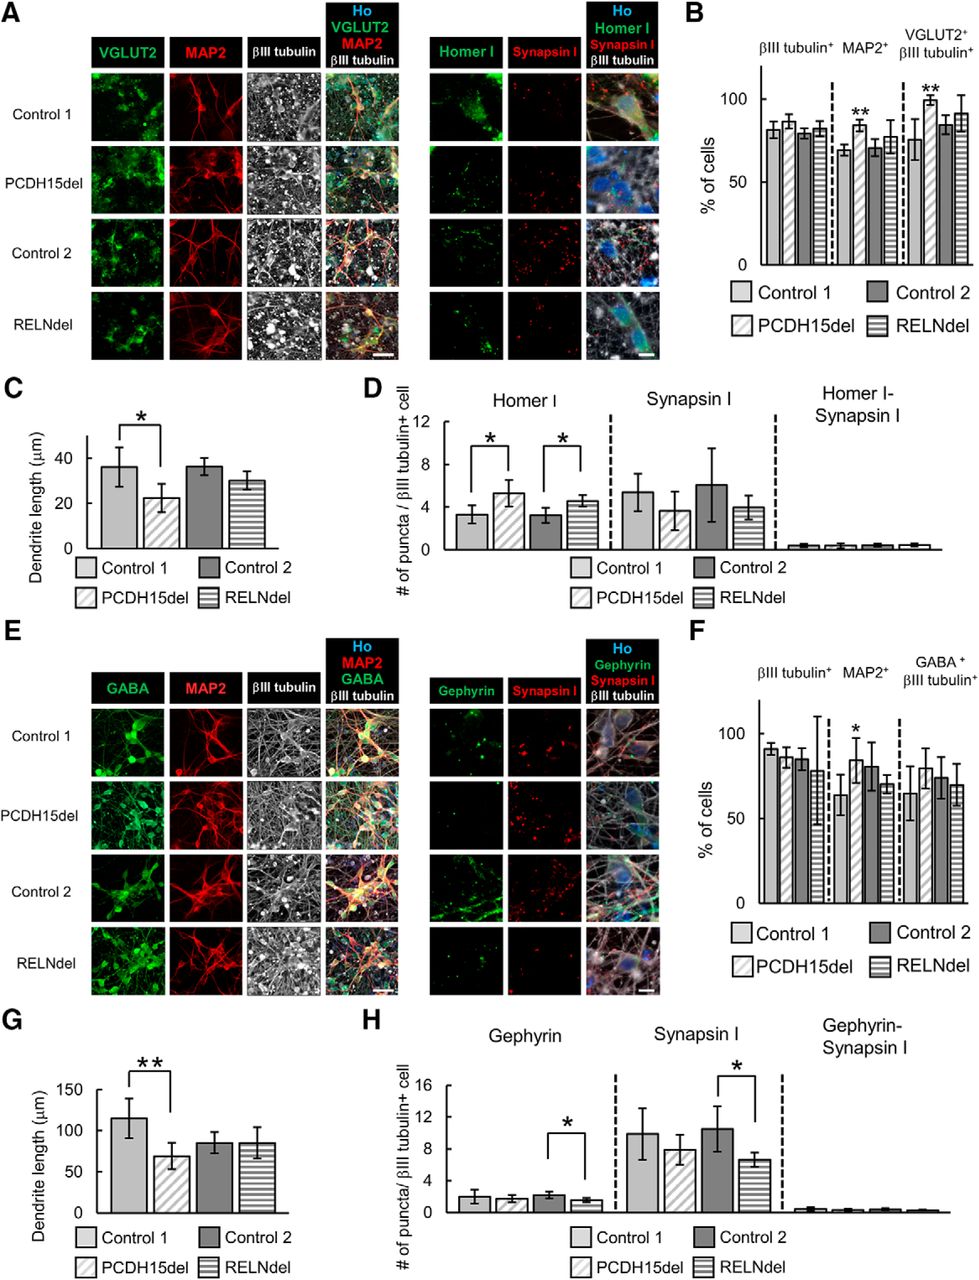
- Figure 7.
Isogenic PCDH15 or RELN deleted neurons showed partial phenotypes of dendrite and synapse formation. A, Representative images of immunocytochemical analysis of neuronal markers (scale bar, 40 μm) and synaptic markers (scale bar, 10 μm) in glutamatergic neurons. B, Ratio of positive cells for each marker; βIII tubulin+ cells/all cells (βIII tubulin+), MAP2+ cells/βIII tubulin+ cells (MAP2+), and VGLUT2 and βIII tubulin double-positive cells/βIII tubulin+ cells (VGluT2+βIII tubulin+). (n = 4–6 independent experiments; mean ± SD; **p < 0.01, Student’s t test between each pair of control and isogenic lines). C, Quantitative analysis of dendrite length in glutamatergic neurons (n = 4–6 independent experiments; mean ± SD; *p < 0.05, Student’s t test). D, Quantitative analysis of the number of synaptic marker puncta in glutamatergic neurons (n = 3–6 independent experiments; mean ± SD; *p < 0.05, Student’s t test). E, Representative images of immunocytochemical analysis of neuronal markers (scale bar, 40 μm) and synaptic markers (scale bar, 10 μm) in GABAergic neurons. F, Ratio of positive cells for each marker; βIII tubulin+, MAP2+, and GABA and βIII tubulin double-positive cells/βIII tubulin+ neuronal cells (GABA+βIII tubulin+). (n = 4–6 independent experiments; mean ± SD; *p < 0.05, Student’s t test between Control 1 and PCDH15del or between Control 2 and RELNdel). G, Quantitative analysis of dendrite length in GABAergic neurons (n = 4–6 independent experiments; mean ± SD; **p < 0.01, Student’s t test). H, Quantitative analysis of the number of synaptic marker puncta in GABAergic neurons (n = 4–6 independent experiments; mean ± SD; *p < 0.05, Student’s t test).
- Figure 8.
Spontaneous activity of neurons induced from patient-derived or isogenic iPSCs. A, Overview of the protocol for neuronal differentiation for functional analysis. B, Quantitative analysis of dendrite length and synaptic markers puncta in neurons cultured in BrainPhys for differentiation on day 28 (n = 3–4 independent experiments; mean ± SD; **p < 0.01, Dunnett’s test among control, BP, and SCZ neurons; BP: BP1-2, SCZ: SCZ1-2). C, Overview of MEA plate and representative images of neurons induced from iPSCs on the 48-well MEA plates. Bright-field image and immunocytochemical images of neuron markers. Scale bar, 200 μm. D, Representative image of raster plot and definition of active electrodes. E, Spike frequency of control or patient-derived glutamatergic neurons on day 28 and day 42 (n = 4–6 independent experiments; mean ± SD; Dunnett’s test among Control, BP, and SCZ neurons, no significant differences were observed; paired t test between day 28 and day 42, *p < 0.05). F, Spike frequency of isogenic iPSC-derived glutamatergic neurons (n = 3–4 independent experiments; mean ± SD; Dunnett’s test among Control, BP, and SCZ neurons, no significant differences were observed; paired t test between day 28 and day 42, *p < 0.05). G, Relative change in the total number of spikes after drug treatment in glutamatergic neurons on day 42 (n = 3 independent experiments; mean ± SD; *p < 0.05, **p < 0.01, Dunnett’s test). H, Representative image of calcium spikes and display of parameters (ΔFmax and calcium spike numbers). I, ΔFmax and calcium spike frequency in control or patient-derived GABAergic neurons (n = 3–6 independent experiments; mean ± SD; Dunnett’s test among each line, no significant differences were observed). J, ΔFmax and calcium spike frequency in control or patient-derived GABAergic neurons (n = 4–6 independent experiments; mean ± SD; Student’s t test, no significant differences were observed).


Tables
Targets Primers Sequence (5´ → 3´) sgRNAs construction sgRNA#1-Fw GAGACCACTTGGATCCGGACGGCAATCACGAGTGTTGTTTTAGAGCTAGAAATAGCA sgRNA#2-Fw GAGACCACTTGGATCCGTCGCCTCTCATTCAGATTTGTTTTAGAGCTAGAAATAGCA sgRNA#3-Fw GAGACCACTTGGATCCGTGGCAGCTTGATAAGTGAGGTTTTAGAGCTAGAAATAGCA sgRNA#4-Fw GAGACCACTTGGATCCGCGCCTCTCATTCAGATTTTGTTTTAGAGCTAGAAATAGCA sgRNA#5-Fw GAGACCACTTGGATCCGCTCATTCAGATTTTGGGCAGTTTTAGAGCTAGAAATAGCA sgRNA#universal-Rv GCCCGGGTTTGAATTCAAAAAAAGCACCGACTCGGTGCCACTTTTTCAAGTTGATAACGGACTAGCCTTATTTTAACTTGCTATTTCTAGCTCTAA T7E1 assay Fw CTCAGTTTACATCCTGACTCAACCAC Rv CCTTCAAACGGCCAAACATAATCTCC Sequence information of the primers for sgRNAs construction and T7E1 assay. Fw, Forward primer; Rv, reverse primer. Also see Materials and Methods.
Figures Measurement Type of test comparison p Value Figure 2C EB size (EB) Dunnett’s test Control vs BP1 0.4406 Control vs SCZ1 0.5982 EB size (DSi-EB) Dunnett’s test Control vs BP1 0.5619 Control vs SCZ1 0.9784 Figure 2D EB form factor (EB) Dunnett’s test Control vs BP1 0.5015 Control vs SCZ1 0.7476 EB form factor (DSi-EB) Dunnett’s test Control vs BP1 0.0662 Control vs SCZ1 0.0562 Figure 2E PCDH15 gene expression Dunnett’s test Control vs BP1 0.3861 Control vs SCZ1 0.3897 Reln gene expression Control vs BP1 0.7288 Control vs SCZ1 0.5178 Figure 2G Intensity/area (βIII tubulin) Dunnett’s test Control vs BP1 0.9826 Control vs SCZ1 0.2543 Intensity/area (αSMA) Dunnett’s test Control vs BP1 0.9778 Control vs SCZ1 0.9238 Intensity/area (AFP) Dunnett’s test Control vs BP1 0.7731 Control vs SCZ1 0.9345 Figure 2J Neurite length (day 10) Dunnett’s test Control vs BP1 0.7746 Control vs SCZ1 0.8824 Neurite length (day13) Dunnett’s test Control vs BP1 0.0293 Control vs SCZ1 0.0324 Neurite length (day16) Dunnett’s test Control vs BP1 0.0192 Control vs SCZ1 0.01 Neurite length (day22) Dunnett’s test Control vs BP1 0.0036 Control vs SCZ1 0.0025 Figure 3C No. of cells (βIII tubulin+/HO+) Tukey’s test 1210B2 vs 201B7 0.9993 1210B2 vs BP1-1 1 1210B2 vs BP1-2 1 1210B2 vs BP2-1 0.0218 1210B2 vs SCZ1-1 0.5216 1210B2 vs SCZ1-2 0.875 201B7 vs BP1-1 0.9975 201B7 vs BP1-2 0.9989 201B7 vs BP2-1 0.0036 201B7 vs SCZ1-1 0.2079 201B7 vs SCZ1-2 0.5352 BP1-1 vs BP1-2 1 BP1-1 vs BP2-1 0.0077 BP1-1 vs SCZ1-1 0.4016 BP1-1 vs SCZ1-2 0.8143 BP1-2 vs BP2-1 0.0042 BP1-2 vs SCZ1-1 0.3116 BP1-2 vs SCZ1-2 0.7283 BP2-1 vs SCZ1-1 0.5238 BP2-1 vs SCZ1-2 0.1306 SCZ1-1 vs SCZ1-2 0.9847 No. of cells (MAP2+/βIII tubulin+) Tukey’s test 1210B2 vs 201B7 1 1210B2 vs BP1-1 0.6317 1210B2 vs BP1-2 0.9984 1210B2 vs BP2-1 0.6973 1210B2 vs SCZ1-1 0.9988 1210B2 vs SCZ1-2 0.9994 201B7 vs BP1-1 0.7153 201B7 vs BP1-2 1 201B7 vs BP2-1 0.7806 201B7 vs SCZ1-1 1 201B7 vs SCZ1-2 1 BP1-1 vs BP1-2 0.7807 BP1-1 vs BP2-1 1 BP1-1 vs SCZ1-1 0.8539 BP1-1 vs SCZ1-2 0.7703 BP1-2 vs BP2-1 0.8448 BP1-2 vs SCZ1-1 1 BP1-2 vs SCZ1-2 1 BP2-1 vs SCZ1-1 0.8955 BP2-1 vs SCZ1-2 0.8325 SCZ1-1 vs SCZ1-2 1 No. of cells (VGluT2+βIII tubulin+/βIII tubulin+) Tukey’s test 1210B2 vs 201B7 0.9629 1210B2 vs BP1-1 0.2892 1210B2 vs BP1-2 0.9885 1210B2 vs BP2-1 0.8416 1210B2 vs SCZ1-1 0.6553 1210B2 vs SCZ1-2 0.9756 201B7 vs BP1-1 0.7818 201B7 vs BP1-2 0.9999 201B7 vs BP2-1 0.9996 201B7 vs SCZ1-1 0.9859 201B7 vs SCZ1-2 1 BP1-1 vs BP1-2 0.5003 BP1-1 vs BP2-1 0.9484 BP1-1 vs SCZ1-1 0.9956 BP1-1 vs SCZ1-2 0.6512 BP1-2 vs BP2-1 0.9885 BP1-2 vs SCZ1-1 0.9093 BP1-2 vs SCZ1-2 1 BP2-1 vs SCZ1-1 0.9998 BP2-1 vs SCZ1-2 0.9975 SCZ1-1 vs SCZ1-2 0.9616 Figure 3D PCDH15 gene expression (iPS) Dunnett’s test Control vs BP 0.9527 Control vs SCZ 0.9354 PCDH15 gene expression (neuron) Dunnett’s test Control vs BP 0.2862 Control vs SCZ 0.4102 RELN gene expression (iPS) Dunnett’s test Control vs BP 0.1826 Control vs SCZ 0.3746 RELN gene expression (neuron) Dunnett’s test Control vs BP 0.6918 Control vs SCZ 0.9941 Figure 3G No. of cells (βIII tubulin+/HO+) Tukey’s test 1210B2 vs 201B7 0.98 1210B2 vs BP1-1 0.9914 1210B2 vs BP1-2 0.9863 1210B2 vs BP2-1 0.4556 1210B2 vs SCZ1-1 1 1210B2 vs SCZ1-2 0.9992 201B7 vs BP1-1 0.7241 201B7 vs BP1-2 1 201B7 vs BP2-1 0.1395 201B7 vs SCZ1-1 0.9894 201B7 vs SCZ1-2 0.9993 BP1-1 vs BP1-2 0.7192 BP1-1 vs BP2-1 0.7873 BP1-1 vs SCZ1-1 0.9536 BP1-1 vs SCZ1-2 0.8677 BP1-2 vs BP2-1 0.1102 BP1-2 vs SCZ1-1 0.9937 BP1-2 vs SCZ1-2 0.9998 BP2-1 vs SCZ1-1 0.2366 BP2-1 vs SCZ1-2 0.1646 SCZ1-1 vs SCZ1-2 0.9999 No. of cells (MAP2+/βIII tubulin+) Tukey’s test 1210B2 vs 201B7 0.9997 1210B2 vs BP1-1 0.9897 1210B2 vs BP1-2 0.9829 1210B2 vs BP2-1 0.5806 1210B2 vs SCZ1-1 0.9812 1210B2 vs SCZ1-2 0.9842 201B7 vs BP1-1 1 201B7 vs BP1-2 0.9998 201B7 vs BP2-1 0.8884 201B7 vs SCZ1-1 0.9037 201B7 vs SCZ1-2 0.9149 BP1-1 vs BP1-2 1 BP1-1 vs BP2-1 0.902 BP1-1 vs SCZ1-1 0.6069 BP1-1 vs SCZ1-2 0.6541 BP1-2 vs BP2-1 0.9712 BP1-2 vs SCZ1-1 0.6265 BP1-2 vs SCZ1-2 0.6636 BP2-1 vs SCZ1-1 0.0941 BP2-1 vs SCZ1-2 01225 SCZ1-1 vs SCZ1-2 1 No. of cells (GABA+βIII tubulin+/βIII tubulin+) Tukey’s test 1210B2 vs 201B7 0.9415 1210B2 vs BP1-1 0.2961 1210B2 vs BP1-2 0.6938 1210B2 vs BP2-1 0.2707 1210B2 vs SCZ1-1 0.343 1210B2 vs SCZ1-2 0.8786 201B7 vs BP1-1 0.9599 201B7 vs BP1-2 0.9994 201B7 vs BP2-1 0.949 201B7 vs SCZ1-1 0.9747 201B7 vs SCZ1-2 1 BP1-1 vs BP1-2 0.9981 BP1-1 vs BP2-1 1 BP1-1 vs SCZ1-1 1 BP1-1 vs SCZ1-2 0.9345 BP1-2 vs BP2-1 0.9967 BP1-2 vs SCZ1-1 0.9994 BP1-2 vs SCZ1-2 0.9993 BP2-1 vs SCZ1-1 1 BP2-1 vs SCZ1-2 0.9169 SCZ1-1 vs SCZ1-2 0.9587 Figure 3H PCDH15 gene expression (iPS) Dunnett’s test Control vs BP 0.2334 Control vs SCZ1 0.8567 PCDH15 gene expression (neuron) Dunnett’s test Control vs BP 0.3458 Control vs SCZ 0.5146 RELN gene expression (iPS) Dunnett’s test Control vs BP 0.999 Control vs SCZ 0.9874 RELN gene expression (neuron) Dunnett’s test Control vs BP 0.081 Control vs SCZ 0.0663 Figure 5D Dendrite length Dunnett’s test Control vs BP 0.0001 Control vs SCZ 0.0002 Figure 5E Homer I puncta No. Dunnett’s test Control vs BP 0.0093 Control vs SCZ 0.009 Synapsin I puncta No. Dunnett’s test Control vs BP 0.0067 Control vs SCZ 0.0014 Homer I-Synapsin I puncta No. Dunnett’s test Control vs BP 0.0182 Control vs SCZ 0.0117 Figure 5H Dendrite length Dunnett’s test Control vs BP 0.004 Control vs SCZ 0.0016 Figure 5I Gephyrin puncta No. Dunnett’s test Control vs BP 0.0065 Control vs SCZ 0.0048 Synapsin I puncta No. Dunnett’s test Control vs BP 0.0173 Control vs SCZ 0.0099 Gephyrin-Synapsin I puncta No. Dunnett’s test Control vs BP 0.0044 Control vs SCZ 0.0042 Figure 6E Gene expression of PCDH15 Student’s t test Control 1 vs PCDH15del (glutamatergic neurons) 0.1757 Control 1 vs PCDH15del (GABAergic neurons) 0.01 Figure 6G Gene expression of RELN Student’s t test Control 2 vs RELNdel (glutamatergic neurons) <0.0001 Control 2 vs RELNdel (GABAergic neurons) 0.0014 Figure 7B No. of cells (βIII tubulin+/HO+) Student’s t test Control 1 vs PCDH15del 0.1781 Control 1 vs RELNdel 0.2969 No. of cells (MAP2+/βIII tubulin+) Student’s t test Control 1 vs PCDH15del 0.0003 Control 1 vs RELNdel 0.2568 No. of cells (VGluT2+βIII tubulin+/βIII tubulin+) Student’s t test Control 1 vs PCDH15del 0.0098 Control 1 vs RELNdel 0.2754 Figure 7C Dendrite length Student’s t test Control 1 vs PCDH15del 0.0418 Control 1 vs RELNdel 0.063 Figure 7D Homer I puncta No. Student’s t test Control 1 vs PCDH15del 0.0282 Control 1 vs RELNdel 0.0209 Synapsin I puncta No. Student’s t test Control 1 vs PCDH15del 0.2101 Control 1 vs RELNdel 0.3278 Homer I-Synapsin I puncta No. Student’s t test Control 1 vs PCDH15del 0.982 Control 1 vs RELNdel 0.7786 Figure 7F No. of cells (βIII tubulin+/HO+) Control 1 vs PCDH15del 0.1441 Control 1 vs RELNdel 0.1954 No. of cells (MAP2+/βIII tubulin+) Control 1 vs PCDH15del 0.0281 Control 1 vs RELNdel 0.4007 No. of cells (GABA+βIII tubulin+/βIII tubulin+) Control 1 vs PCDH15del 0.1269 Control 1 vs RELNdel 0.66 Figure 7G Dendrite length Student’s t test Control 1 vs PCDH15del 0.0055 Control 1 vs RELNdel 0.9907 Figure 7H Gephyrin puncta No. Student’s t test Control 1 vs PCDH15del 0.553 Control 1 vs RELNdel 0.0452 Synapsin I puncta No. Student’s t test Control 1 vs PCDH15del 0.2637 Control 1 vs RELNdel 0.0431 Gephyrin-Synapsin I puncta No. Student’s t test Control 1 vs PCDH15del 0.5136 Control 1 vs RELNdel 0.3123 Figure 8B Dendrite length (Glutamatergic neurons) Dunnett’s test Control vs BP 0.0001 Control vs SCZ 0.0002 Homer I puncta No. Dunnett’s test Control vs BP 0.0003 Control vs SCZ 0.001 Synapsin I puncta No. Dunnett’s test Control vs BP 0.0011 Control vs SCZ 0.0012 Homer I-Synapsin I puncta No. Dunnett’s test Control vs BP <0.0001 Control vs SCZ <0.0001 Dendrite length (GABAergic neurons) Dunnett’s test Control vs BP 0.0021 Control vs SCZ 0.0027 Gephyrin puncta No. Dunnett’s test Control vs BP 0.0002 Control vs SCZ 0.0011 Synapsin I puncta No. Dunnett’s test Control vs BP 0.1728 Control vs SCZ 0.1023 Gephyrin-Synapsin I puncta No. Dunnett’s test Control vs BP <0.0001 Control vs SCZ <0.0001 Figure 8E Spike frequency Dunnett’s test Control vs BP (day28) 0.8839 Control vs SCZ (day28) 0.924 Control vs BP (day42) 0.7486 Control vs SCZ (day42) 0.9812 Paired t test day28 vs day42 0.0104 Figure 8F Spike frequency Dunnett’s test Control 1 vs PCDH15del (day28) 0.6129 Control 2 vs RELNdel (day28) 0.7575 Control 1 vs PCDH15del (day42) 0.2678 Control 2 vs RELNdel (day42) 0.9187 Paired t test day28 vs day42 0.0483 Figure 8G Spike number ratio (CNQX) Dunnett’s test Control vs BP 0.0351 Control vs SCZ 0.0479 Spike number ratio (AP-5) Control vs BP 0.1922 Control vs SCZ 0.1165 Spike number ratio (GABA) Control vs BP 0.1204 Control vs SCZ 0.0071 Figure 8I ΔFmax Dunnett’s test 1210B2 vs BP1-1 0.9215 1210B2 vs BP1-2 0.9233 1210B2 vs BP2-1 1 1210B2 vs SCZ1-1 0.9999 1210B2 vs SCZ1-2 0.9997 Spike frequency Dunnett’s test 1210B2 vs BP1-1 0.2334 1210B2 vs BP1-2 0.7435 1210B2 vs BP2-1 0.9984 1210B2 vs SCZ1-1 0.9985 1210B2 vs SCZ1-2 1 Figure 8J ΔFmax Student’s t test Control 1 vs PCDH15del 0.7346 Control 1 vs RELNdel 0.5067 Spike frequency Student’s t test Control 1 vs PCDH15del 0.0795 Control 1 vs RELNdel 0.3771 p Values <0.05 were considered to be statistically significant in this study.
In this issue


