

Article Figures & Data
Figures
- Figure 1.
Calibration of dye diffusion and Ca2+ response. A, Recording arrangement for imaging presynaptic varicosities. CA1 pyramidal neurons were whole-cell patch-clamped with electrodes containing Fluo-4 (or 5F) and Alexa Fluor 594 hydrazide. Axons and varicosities were traced to the subiculum by imaging Alexa Fluor 594 hydrazide and Ca2+ was imaged using the Fluo dye. B, Calibration of the Ca2+-sensitive dyes. Fluo-4 (circles) and Fluo-5F (squares) were imaged on the confocal system used for all measurements. Fluorescence intensity was measured over a range of Ca2+ standard concentrations in fixed concentrations of EGTA. Log-log plots gave a slope (Hill coefficient) of 1. Ca2+ concentrations were applied to a patch-clamped cell by application of ionomycin. From saturated Ca2+ concentrations, zero Ca2+ and a fixed value of Ca2+ (0.78 µM in EGTA-buffered Ca2+ solution), the closed circle (Fluo-4) and closed square (Fluo-5F) values in the graphs were calculated. These values were used to correct the plots to values in the intracellular environment (solid lines) and to calculate values of Kd for the two dyes in the cells (0.44 and 1.49 µM). C, Dyes introduced from the patch pipette showed equal diffusion rates into axon varicosities. Intensities of Fluo-4 and Alexa Fluor 594 hydrazide measured by separate illumination at 488 and 568 nm, respectively, were normalized to the value of the fluorescence obtained following identification of a varicosity (20 min after whole-cell access) and plotted against one another for points measured over the next 20 min. The slope of a line fitted to this data (through 0,0, because both dye concentrations were zero at the experiment start) is close to unity. D, Fluorescence intensities of varicosities from all neurons in which Alexa Fluor 594 hydrazide was loaded with Fluo-4 (11 neurons; filled black circles). Overlaid on this data are results of simulations of diffusion of modeled Fluo-4 molecules (mol wt 736 g mol−1, thick gray line) and Alexa Fluor 594 (mol wt 737 g mol−1; thick black line). These were detected 250 µm from the somata. The thin gray lines indicate the Alexa Fluor 584 concentrations simulated closest to the soma (70 µm) and at the extreme range of distances (600 µm from the soma).
- Figure 2.
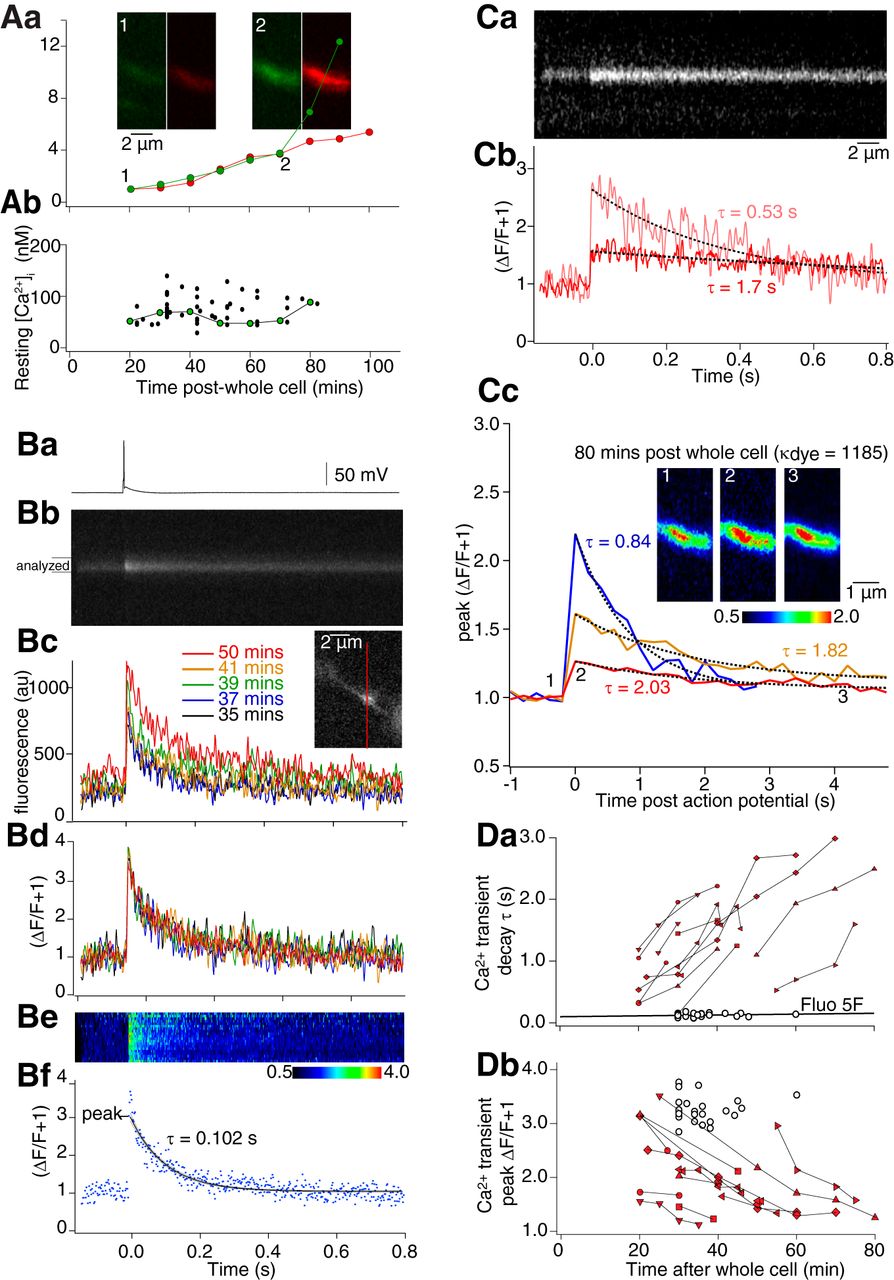
Effects of high- and low-affinity dyes on presynaptic Ca2+ transients. Aa, CA1 pyramidal neurons whole-cell recorded and filled with Alexa Fluor 594 hydrazide (red, 250 µM) and Fluo-4 (green, 1 mM) from pipettes. Dye intensities normalized to values 20 min after whole-cell was plotted against time in one varicosity. Insets: green, Fluo-4; red, Alexa Fluor 594 in the same varicosity 20 and 70 min later. Ab, Resting [Ca2+] for all cells calculated from Equations 1, 2 plotted over time after whole-cell access. Green circles from Aa. B, Ca2+ transients measured with low affinity dye. Ba, Whole-cell-evoked action potentials evoked Ca2+ transients measured by line scans (Bb) through varicosities filled with Alexa Fluor 594 hydrazide and Fluo-5F. Line scan through the red bar in inset (Bc) showing intensities of five sequential line scans from the analyzed region in Bb. Colors indicate time after whole-cell access. Bd, Responses as ΔF/F + 1 (F = pre-stimulus Fluo-5F fluorescence). Ca2+ transients are invariant. Be, Color-coded representation of line scan as ΔF/F + 1 from analyzed region in Bb after background subtraction. Bf, Single Ca2+ transient 37 min after whole cell. Data fit by a single exponential. From fits, decay rates and peak responses were calculated. Ca, In varicosities filled with Alexa Fluor 594 hydrazide and higher affinity Fluo-4 (1 mM), Ca2+ transients were evoked and Fluo-4 line scanned. The first recording (20 min after whole cell) was made as dye diffused into the varicosity (decay rate, τ= 0.53 s, Cb pink); 25 min later the amplitude was reduced and τ increased (τ = 1.7 s, red). Cc, In other varicosities, at higher dye concentrations reduced ROI imaging (5 Hz) minimized bleaching. Transient intensity was plotted versus time and fitted with single exponentials to calculate τ and peak amplitude. Inset – varicosity imaged 80 min after whole-cell access at time points indicated by numbers. Da, Comparison of effect of Fluo-4 and Fluo-5F on transients. Values of τ from fits to plotted versus time after whole-cell access. Data from each varicosity with Fluo-4 is linked with lines. The line through the Fluo-5F data are a least squares fit. Db, Similar comparison of peak amplitudes. Values of τ and peak in Fluo-5F are constant those with Fluo-4 are time dependent.
- Figure 3.
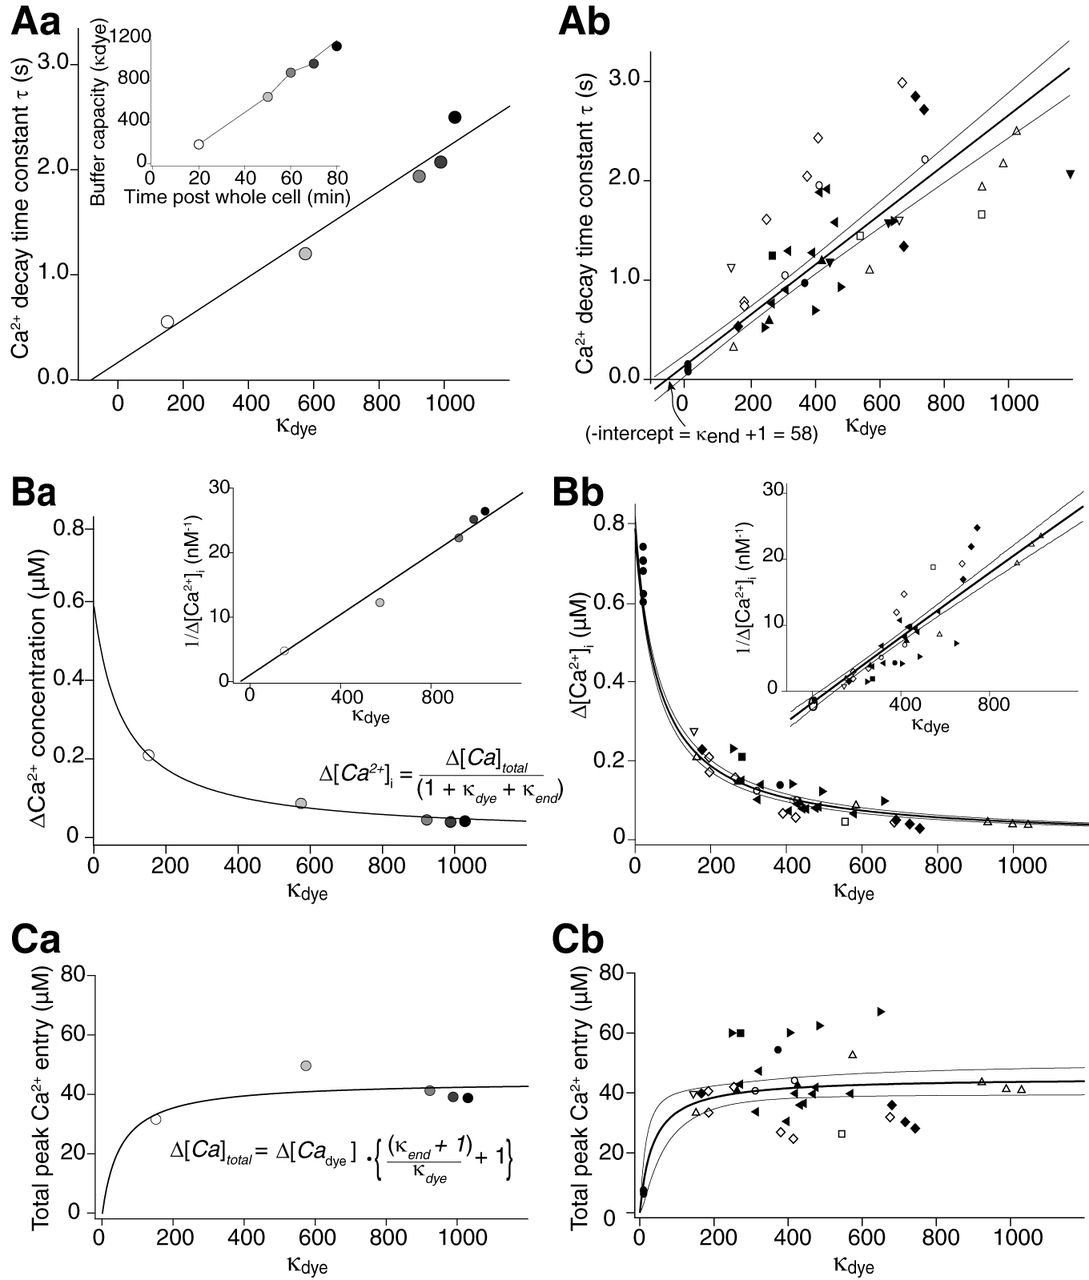
Analysis of Ca2+ transients and buffering using Ca2+-sensitive dyes. A, From the fits to Ca2+ transients obtained with Fluo-4 and Fluo-5F at various values of κdye, decay time constants (τ) were plotted against κdye. Aa, Example neuron. Inset, Increase in κdye over period of recording. Ab, Recordings from all neurons (each symbol used represents a different cell). The negative intercept on the abscissa is a measure of endogenous buffering capacity (κend) of the terminal (from Eq. 5). B, Evoked change in [Ca2+]i calculated from Equation 3 is plotted against dye buffering capacity (κdye) for the same data. The curved line represents a fit of Equation 9. The inset represents the equivalent linear fit to the inverse of Δ[Ca2+]i where the convergence of the fit with the abscissa represents κend and the slope is a function of Δ[Ca2+]total. The fits give values for the peak free Ca2+ concentration, the varicosity κend and total Ca2+ entering. Ba, Example neuron. Bb, Recordings from all neurons. C, Values of total peak [Ca2+] bound to dye calculated from the product of measured Δ[Ca2+] and the κdye were plotted against κdye. These data were fit to Equation 10. As the curve reaches an asymptote at high values of κdye, this allows calculation of the total molar quantity of Ca2+ entering the varicosity following one action potential. Ca, Example neuron. Cb, Recordings from all neurons. Error bands are for 90% confidence intervals.
- Figure 4.
The Ca2+ transient is unaffected by block of release of Ca2+ from internal stores, and its peak amplitude is correlated with the inverse of its decay. A, Repetitive stimulation evokes summating Ca2+ transients that are unaffected by ryanodine. Aa, Five action potentials at 20 Hz evokes a summating Ca2+ transient measured using Fluo-5F in a CA1 neuron varicosity (Ab), which was unaffected by a 30-min application of ryanodine (5 µM; Ac, gray). B, Inverse of the Ca2+ transient decay rate versus peak Δ[Ca2+]i for varicosities in which the value of κdye exceeded 150. From the slope, the extrusion rate of Ca2+ from the varicosity was determined (equal to slope × total molar Ca2+ entry). Each symbol used represent a different cell.
- Figure 5.
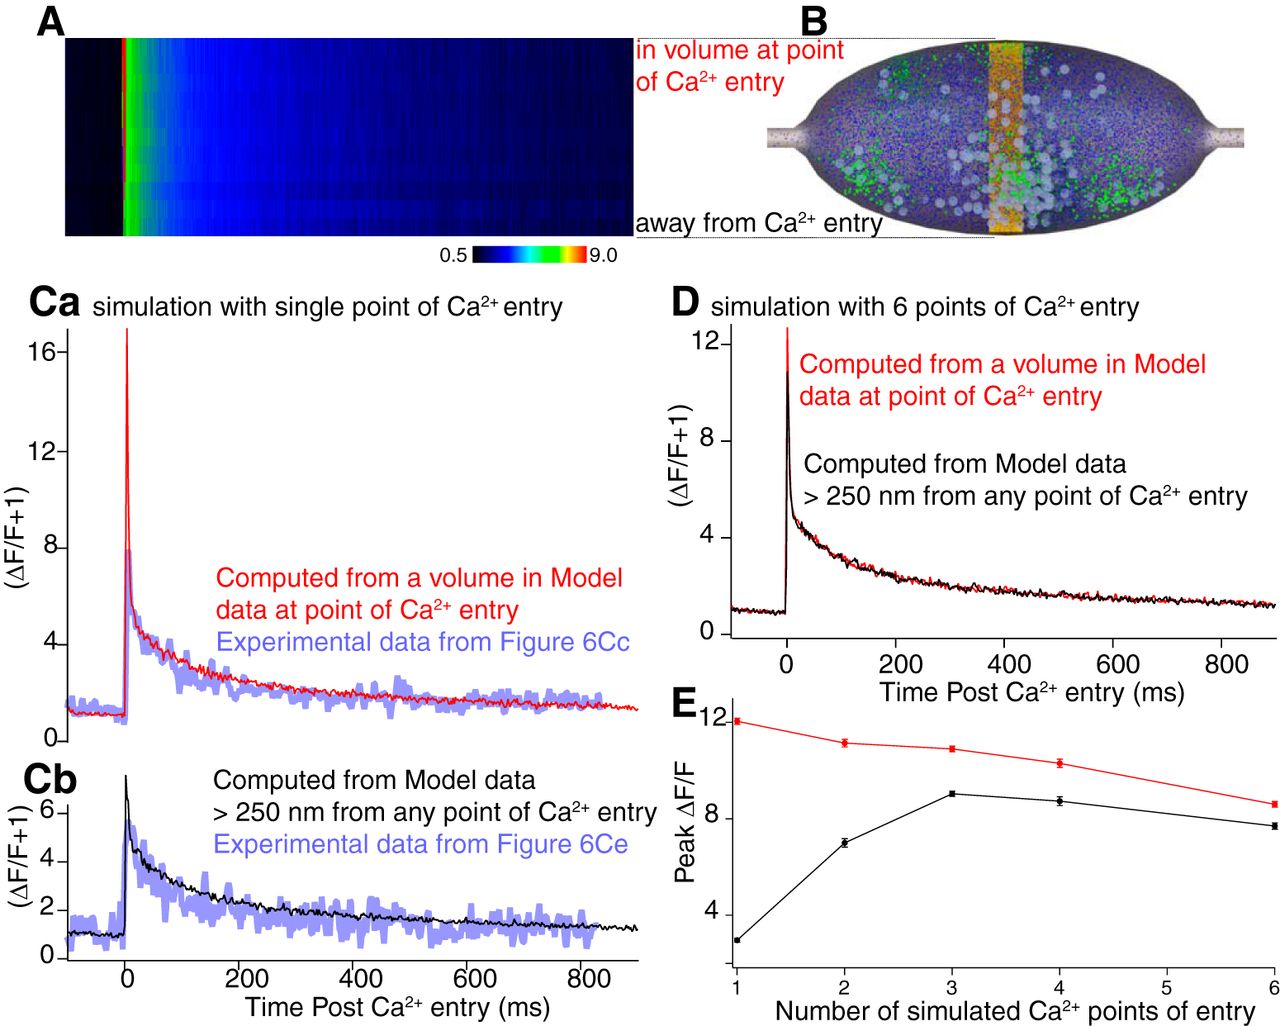
MCell simulation of Ca2+ transients and validation against experimental data. A, The varicosity was modeled as an ellipsoid 2 × 1 × 1 µm and contained 320 synaptic vesicles, and one large internal structure to provide sites for Ca2+ intrusion (i.e., ER/mitchondrion). A variable quantity of Ca2+ buffer was modeled. Images show free Ca2+ ions (green) and Ca2+-bound states of calbindin28K as per the color scheme in the kinetic model (B). Times indicated by letters in B. Parameter from Table 1 and from varying buffer concentrations. Pre-stimulus state (Aa) at peak of stimulus (Ab) at first time point resolveable with fluorescence imaging (Ac). B, Simulated total varicosity-free [Ca2+]i following stimuli at three calbindin28K concentrations (15 µM, pink; 40 µM, red; 60 µM, black). Single exponential fits (blue) were applied to these simulations and values of peak Δ[Ca2+]i and decay (τ) were obtained from these fits. Inset shows kinetic scheme for the calbindin28K 2:2 ratio. Parameters in Table 2. C, 3D plot of simulated τ, peak ΔCa2+ against varying buffer concentrations (15–60 µM) following simulated varicosity stimulation. Blue, 3:1 ratio model of calbindin28K; red, 2:2 model of calbindin28K; green, model of calmodulin. Parameters in Table 2. The vertical black line and gray shading represent experimentally obtained τ, peak ΔCa2+ and their standard errors. These data converge only with the 2:2 ratio of calbindin28K at a concentration of 39.7 µM. D, Varying Ca2+-sensitive dye concentrations (Fluo-4; Table 1) were simulated and resultant Ca2+ transients graphed. Da, Responses shown with dye concentrations of 50, 200, and 670 µM. Db–Dd, Decay time, peak ΔCa2+, and total Ca2+ entry from these simulated transients over values of κdye from 0 to 1121 (red circles and lines) is plotted as per Figure 3C and overlaid on the fits and 90% confidence intervals of that experimental data. E, Comparison to experimental data of simulation in axons. Action potentials (Ea) evoked varicosity Ca2+ transients (Eb) recorded with Fluo-5F that also allowed recording from axons. Such events were also simulated by calculating Ca2+ concentration along the axon and varicosity axis (Ec, yellow). Ed, Simulated line scan. Ee, top, Overlay of experimental ΔF/F + 1 from a varicosity (blue) and the simulated result (red). Bottom, Similar overlay but from adjacent axons. F, Comparison to experimental data of simulations of trains of stimuli. Fa, Five actions potentials at 50 Hz evoked Ca2+ transients recorded with Fluo-5F (Fb) quantified as Ca2+ concentrations (Fc, blue, gray lines 90% confidence interval from five varicosities). The same train was simulated (Fc, red). Simulation data fell within the 90% confidence interval of the data.
- Figure 6.
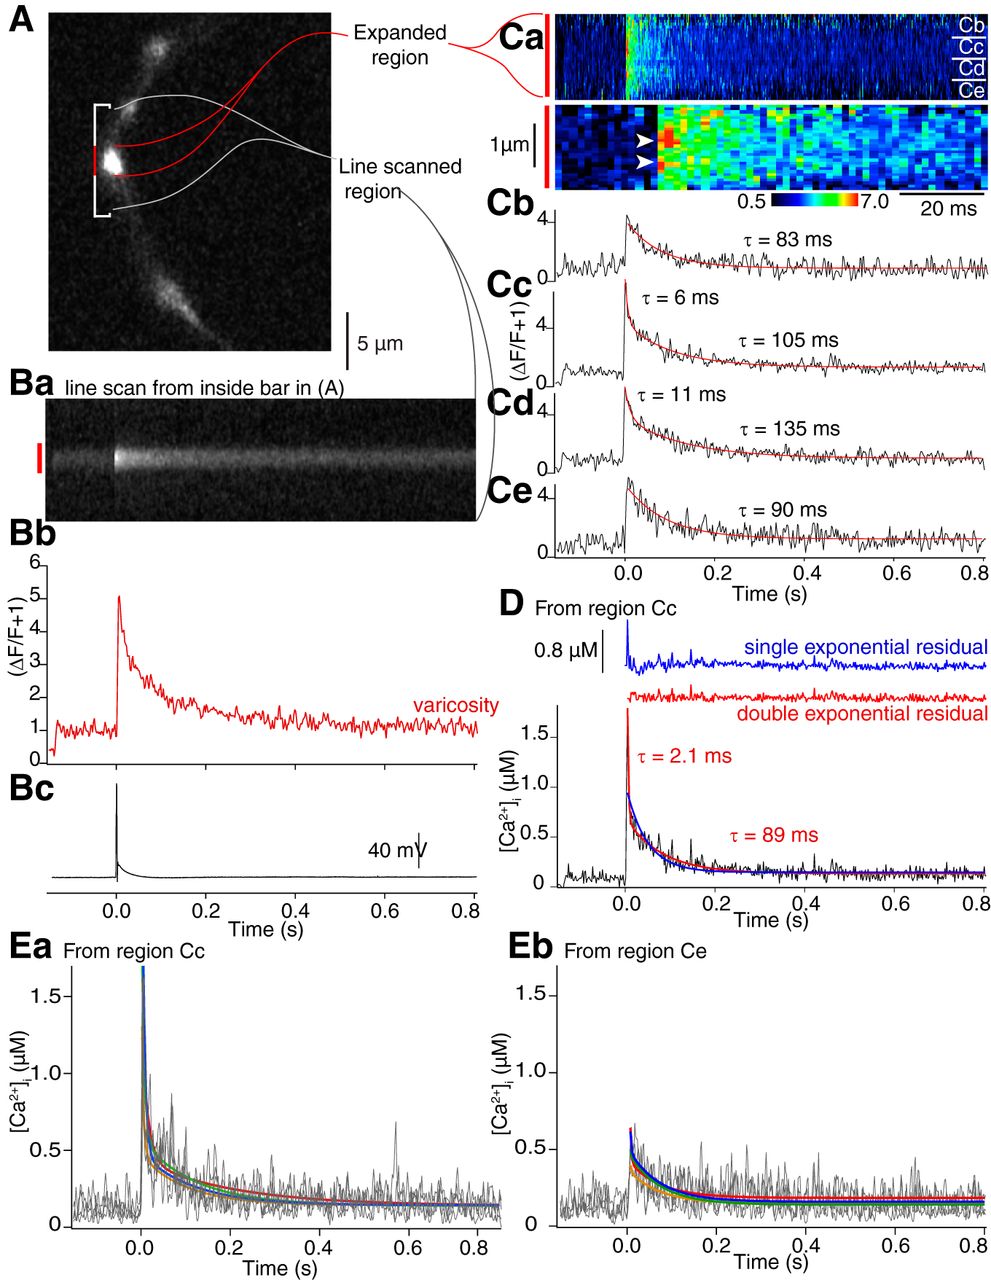
Ca2+ or Ca2+ dye complex can show rapid diffusion from presynaptic terminal hotspots immediately after the stimulus. A, Axon varicosity containing both Alexa Fluor 594 hydrazide and Fluo-5F imaged using the Alexa Fluor dye. Bracketed region encompasses a single varicosity (center, red) and axon on either side (white) used for line scanning. B, Mean of four line scans from region in A. The varicosity exhibited a Ca2+ transient similar to those recorded in earlier figures (Ba). Mean intensity of the line scan through the varicosity (Bb, red bar), which showed a large increase in Ca2+ dye fluorescence following a single action potential (Bc). C, The mean of four line scans within the varicosity (red in B) displayed as ΔF/F + 1 (Ca, upper panel time scale as in graphs in D, E below). Immediately after the stimulus there is a rapidly decaying component of the transient. The lower panel of Ca shows the two hotspots (arrowheads) at a 10× time scale. Data were then analyzed in quadrants (Cb–Ce). Center quadrants (Cc, Cd). The center quadrants were well fit with double exponentials, the outer with single exponentials. D, Data in Cc replotted to demonstrate the amplitude of free [Ca2+]i within this region of the varicosity. As with the data in Cd, this required a double exponential fit (single exponential and residual in blue, double exponential and residual in red). E, Ca2+ transients (gray) were plotted for each of the four sequential responses averaged in C. Ea, Plotted from the region labeled (Cc); and (Eb) from the region labeled (Ce) in Ca. Double exponentials were fit to these data for each of the four traces (colored traces).
- Figure 7.
Simulations of Fluo-5F transients and clustering of Ca2+ entry. Line scans (A) of Fluo-5F transients were simulated by determining its simulated Ca2+ binding in volumes (yellow boxes) across the varicosity (B). Ca, Simulated Fluo-5F ΔF/F + 1 transient (red) in the volume closest to Ca2+ entry (top of yellow band). Experimental data from Fig. 6Cc, blue. Cb, Simulated Fluo-5F ΔF/F + 1 transient in the volume at the bottom of the yellow band in B opposite the site of Ca2+ entry (black). Experimental data from Fig. 6Ce overlaid in blue. D, Ca2+ entry was simulated at six sites, including one placed at the plasmalemma, at the top of the yellow band in B. The Fluo-5F transient is shown from this site (red) and away from sites of Ca2+ entry from the bottom of the yellow band in B (black). E, Graph of peak amplitude of double exponential fit to the simulated transient at a site of Ca2+ entry (red) and away from these sites (black) in varicosities where Ca2+ entry was at one to six sites.
- Figure 8.
Paired-pulse potentiation is not explained by presynaptic residual Ca2+ concentration. A, EPSCs (in AP5 and bicuculline to block NMDAR and GABAAR responses) recorded in subicular pyramidal neurons following stimulation of CA1 pyramidal axons. Effects on EPSC amplitudes of BAPTA-AM or EGTA-AM were recorded after 15–20 min of perfusion. Aa, BAPTA-AM (10–100 µM) caused dose-dependent inhibition of the EPSC (graphed in Ab). EGTA-AM (10–100 µM) had little effect. B, Paired-pulse responses were obtained at 10 Hz (six neurons) EGTA-AM (10 µM) was added to the superfusate (gray). Paired-pulse facilitation was prevented. Ca, In three neurons with EGTA-AM (10 µM), the interstimulus interval was varied from 20 to 500 ms. Paired pulse potentiation was prevented over intervals >50 ms. By contrast control paired-pulse potentiation was seen in all neurons tested over the same range of stimulus intervals (Cb). Cc, Graph showing paired pulse potentiation for these intervals in control (filled circles) and after superfusion of EGTA-AM (open circles). The dashed line represents the first stimulus amplitude. Errors expressed as SEM between preparations. D, Ca2+ transients were stimulated in paired pulses. Da, Line scan image of stimuli at 200-ms intervals. Db, Paired-pulse responses at 20-ms (gray) and 200-ms (black) intervals.
- Figure 9.
Simulations of Ca2+ buffering in the varicosity. A, Using simulation parameters previously determined, the kinetics of calbindin28K binding were simulated and displayed as state diagrams from before a simulated stimulus (Aa) as well as during and after the stimulus (Ab, Ac, Ad) from time points indicated in B. Concentrations of calbindin28K in each of its possible Ca2+-bound or unbound states throughout the varicosity is plotted on the vertical axis and color coded to concentration. The horizontal axes display Ca2+ binding to high-affinity (B1) and medium-affinity (B2) sites (C, single Ca2+ bound; CC, two Ca2+ bound). B, Graph of total concentration of vacant Ca2+-binding sites on calbindin28K throughout the varicosity (black) and total bound Ca2+ (blue) after a stimulus and 2nd pulse in light blue at varying interpulse intervals. Free Ca2+ concentration is also shown (red) to the same scale for a single pulse. Ca, Graph of free Ca2+ concentration after a single stimulus (red) throughout the varicosity and after 2nd stimuli at varying paired-pulse intervals (black). Red dashed line indicates theoretical value of linear summation of a second pulse. Blue dashed line represents the linear sum of the Ca2+ signal that is resolvable using imaging at 500 Hz. Cb, Expansion of the time course of paired pulses from Ca for pulses at 50 Hz. Color scheme as for Ca. Single exponential fits to the fast component of decay of the Ca2+ transients and their decay times (τ) are shown in blue.
- Figure 10.
Paired pulses do not alter nanometer domains of Ca2+ entry. A, Characteristics of Ca2+ entry, buffering, and dispersal analyzed close to Ca2+ entry modeled within 20 nm of a vesicle at the plasmalemma. Left panel, View along axon axis including varicosity contents (blue dots, calbindin28K; green, Ca2+, vesicles; light blue, organelle). Right panel, Magnified model showing volume at the membrane (yellow band, where simulated Ca2+ was determined) and vesicles (blue circles, one dark blue at Ca2+ entry site). The latter vesicle distorts the spatial symmetry of the Ca2+ signal (C, G; Shahrezaei and Delaney, 2004). Ba, Ca2+ transients expressed as a simulated line scan versus time from yellow band in A centered at one point of Ca2+ entry for five channels (red), one channel (black), and zero local channels (blue) active for 0.5 ms (dark gray) against a background of 45 µM entering the entire varicosity for 2 ms (light gray) in Bb, where data are from the center 20 nm of Ba. Bc, Probability (from 100 simulations) of syt1 model showing occupancy of all five Ca2+-binding sites for five (red) and one (black) local Ca2+ channels. Gray shaded regions as for Bb. C, Spatial distribution of the Ca2+ transient peaks from the end of the dark gray shading in B for 0 through five channels at the local site of Ca2+ entry. D, Total Ca2+ entering a volume within 20 nm of three channels (black), the free Ca2+ in this volume (red), and the Ca2+ in the volume bound to buffer. Loss of Ca2+ by diffusion is the difference between the black trace and the sum of the black and red traces (traces are on a logarithmic scale). Gray shaded regions as per B. E, Paired-pulse Ca2+ transients from yellow region in A simulating three local channels located within 20 nm of syt1. Ea, Simulated line scans as for Ba, but with a second pulse simulated 20 ms after the first. Eb, Ca2+ transients within 20 nm of local Ca2+ entry repeated at a 20-ms interval. Insets show single exponential fits and decay rates (blue) of the paired pulse local Ca2+ transient. Ec, Probability of syt1 binding five Ca2+ ions. Ed, Cumulative number of syt1-five Ca2+-binding events to emphasize these are equal in both pulses. F, Paired pulse results (Fa–Fc) as per Eb–Ed but at a paired-pulse interval of 200 ms. G, Spatial distribution of the peak free Ca2+ entry in pulse 1 (black) and the second pulse at 20 ms (red) and 200 ms (blue) from volume in A, B.


Tables
κend 75 ± 10 Resting [Ca2+] (nM) 81 ± 5 Peak Δ[Ca2+]i (nM) 760 ± 30 Total calcium entering (Δ[Ca]total; µM) 45 ± 3 Total molar Ca2+ entry (mol) 8.0 × 10⁻²⁰ Median varicosity volume (µm3) 1.2 ± 0.3 Median varicosity surface area (µm2) 7.6 ± 1.0 Fluo-5F transient decay rate τ (ms) 119.5 ± 1.4 Calculated τ with 0 [dye] (s) 0.11 ± 0.09 Extrusion pump rate 7.6 × 10⁶ ± 1.1 × 10⁶ × (total #Ca2+ ions) M–1 s−1 Parameter Value Source of value Resting free [Ca2+]i (nM) 81 Eq. 3 Peak free Δ[Ca2+]i (nM) 760 Eq. 9; Fig. 3B Total [calcium] entering (Δ[Catotal]; µM) 45 Eq. 10; Fig 3C Absolute extrusion rate
Leak intrusion rate2.2 × 1011 M–1 s−1
1.77 × 10⁵ s−1Fig. 4B × total # Ca2+ ions
for resting [Ca2+]I = 81 nMDecay rate at 0 [dye] (τ) 0.110 s Fig. 3A Volume of model terminal (L)
Cytosolic volume (L)1.22 × 10⁻¹¹
1.07 × 10⁻¹¹Cytosolic volume excludes organelle and vesicle structures in the model Dye parameters Fluo-4 Kd/kon/koff
Fmin/Fmax0.44 µM/5 × 108 M–1 s−1/221.5 s−1/750 s−1
0.0232Fig. 1 Fluo-5F Kd/kon/koff 1.49 µM/5 × 108 M–1 s−1/750 s−1 Fig. 1 Calcium buffers Calbindin28K concentration
Ratio of high to low affinity sites
3:1 ratio high affinity kon1/koff1
3:1 ratio med. affinity kon2/koff2
2:2 ratio high affinity kon1/koff1
2:2 ratio low affinity kon2/koff215–60 µM
2:2 or 1:3
6.5 × 10⁶ M–1 s−1/2.405 s−1
3.85 × 10⁷ M–1 s−1/44.44 s−1
5.5 × 10⁶ M–1 s−1/2.6 s−1
4.35 × 10⁷ M–1 s−1/35.8 s−1Varied in model
Varied in model (Nägerl et al., 2000; Schmidt et al., 2012)Calmodulin concentration
N-terminal kon/off T
N-terminal kon/off R
C-terminal kon/off T
C-terminal kon/off R15 – 60 µM
7.7 × 10⁸ M–1 s−1/1.6 × 105 s−1
3.2 × 10¹⁰ M–1 s−1/2.2 × 104 s−1
8.4 × 10⁷ M–1 s−1/2.6 × 103 s−1
2.5 × 10⁷ M–1 s−1/6.5 s−1Varied in model
Faas et al. (2011; stoichiometry is present with each EF hand lobe showing two sequential on and off rates represented by T and R)Syt1 C2A kon/koff
Syt1 C2B kon/koff2 × 108 M–1 s−1/1.2 × 104 s−1
2 × 10⁸ M–1 s−1/8 × 103 s−1
2 × 10⁸ M–1 s−1/2 × 105 s−1
2 × 10⁸ M–1 s−1/4 × 104 s−1
2 × 10⁸ M–1 s−1/4 × 104 s−1Radhakrishnan et al. (2009) Diffusion constants DCa 223 µm2 s−1 Allbritton et al. (1992) DFluo-4 75 µm2 s−1 Kong et al. (2013) DFluo-5F 75 µm2 s−1 Kong et al. (2013) DCalbindin 0.2 fraction immobile Schmidt et al. (2012) 0.8 fraction mobile, 20 µm2 s−1 Schmidt et al. (2012) Iteration interval (s) 4 × 10⁻⁸ (calbindin/calmodulin buffer determination)5 × 10⁻⁹ (syt1 and local Ca2+) Partition size (µm; this is an MCell function that divides the volume into subvolumes to optimize calculations) 0.2 Molecular interaction radius (nm; radius at which two molecules may interact) 10 Microscopic reversibility (function that increase accuracy of reactions) On
In this issue


