

Article Figures & Data
Figures
- Figure 1.
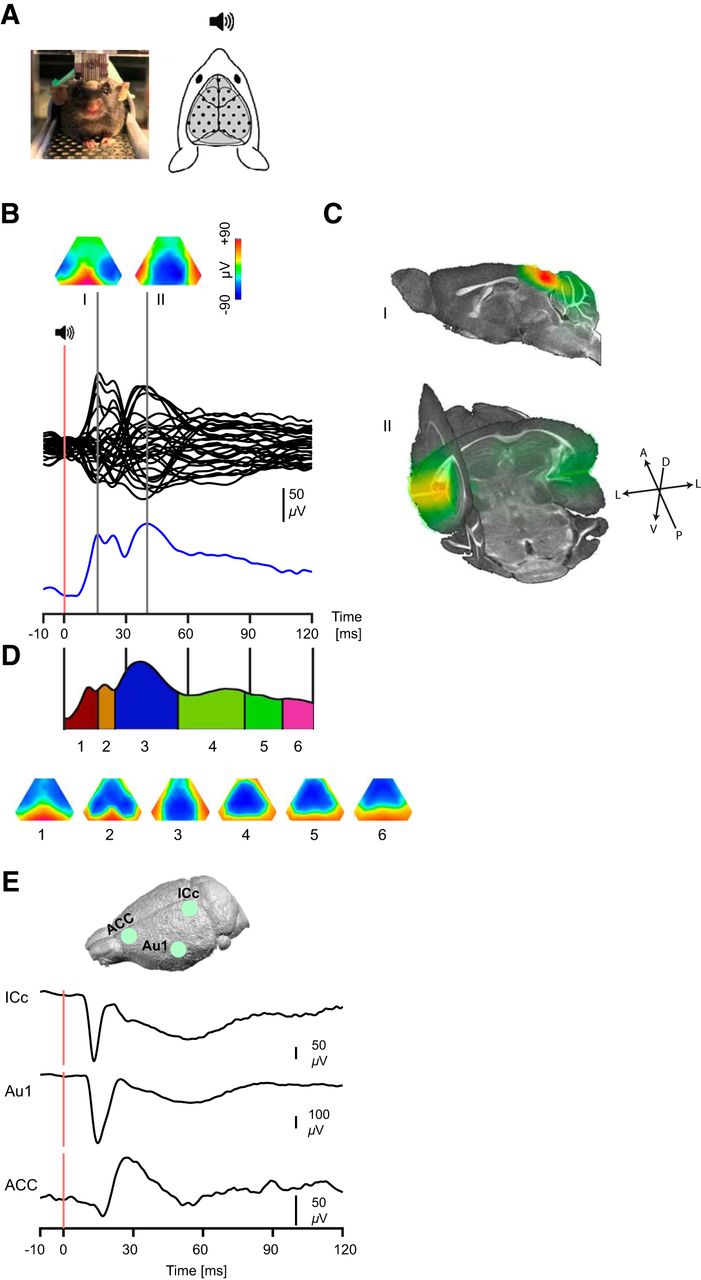
AEP in an example subject with epicranial recording. A, Awake head-fixed animal during epicranial recording (left) and corresponding electrode placement map on the surface of the skull. B, eAEP of an example subject following auditory sensory stimulation. The lower trace (blue) depicts the GFP of the shown EEG traces (average of 32 trials). The traces are time-locked to auditory stimulation (red bar at time 0) and two gray lines correspond to two GFP peaks. Voltage topographic maps at two time points with a peak GFP are shown at the top. C, respective source localized maps of the two topographies shown in B suggesting localization of main generators in the inferior colliculus and auditory cortex. The upper map represents a sagittal section of ∼0.6 mm lateral to the midline. The axes of orientations for the 3D map is also provided. A, P, D, V, and L refer to anterior, posterior, dorsal, ventral and lateral orientations, respectively. D, Clustering (top) of the auditory response shows a sequence of topographies (bottom) corresponding to the large scale network processing auditory response. The temporal extent of the identified maps appears as segments of the grand average GFP trace. Back-fitting of the clusters to individual animals’ ERPs validated the clustering analysis reproducibility across subjects as it showed monotonically increasing onsets and latencies of best correlation of each component map. Onset and latency differences between pairs of successive maps were all significant (p < 0.01). E, Schematic representation of intracranial recording sites (top) and intracranial ERPs of example subjects recorded from the ICc, Au1 and ACC.
- Figure 2.
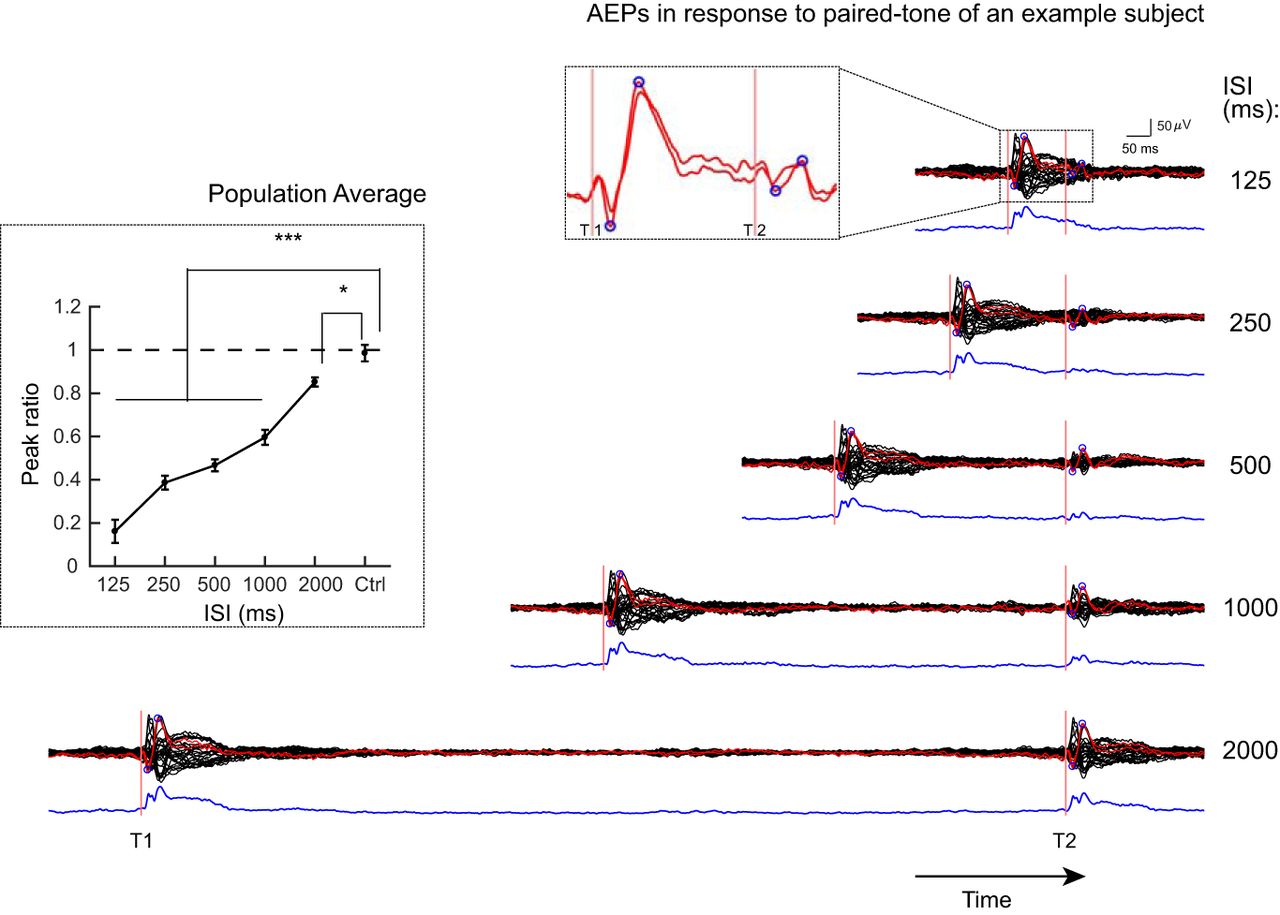
Epicranial EEG recording of sensory gating using paired-tone paradigm. The eAEP of an example subject (same as Fig. 1B) to a pair of tones with different ISIs are shown. The red traces correspond to left and right electrodes above the auditory cortex and black traces represent all other electrodes. The blue circles indicate the peak-to-peak amplitude used to quantify sensory gating. Top inset shows the zoomed segment (only electrodes above auditory cortices) within the dashed rectangle to highlight the strongly gated but still present response to T2 at the ISI of 125 ms. The blue trace in bottom of each EEG trace corresponds to the GFP. The attenuation (gating) of the response to the T2 is visually clear. The left inset shows average sensory gating ratios (n = 7 mice) quantified based on the eAEPs of auditory electrodes. Note that even at 2000 ms ISI, there is a significant sensory gating. The ratio equal to 1 means no gating and the smaller the ratios are, the stronger the gating is. Error bars indicate SEM; *p < 0.05, ***p < 0.001.
- Figure 3.
Similarity of functional brain states during post-T2 of short ISIs and time-matched period of long ISIs during which there is no T2 yet. A, left panel, Result of the clustering analysis of the grand-average eAEP during the 500 ms period following T1. During this period, T2 takes place in short-ISI conditions but not in the long ISIs. The corresponding spatiotemporal topographic maps are presented below. Each map is labeled with the same color code that is used for the clusters. The result of clustering was fitted on the post-T2 epochs (right panel) revealing that the same sequence of brain states was activated in response to the T2 after long ISIs as compared to the sequence following the T1. For short ISIs, it shows that initial segments of T1 sequence were curtailed and suggests that the cluster sequences continue from where T2 stimulation enters in the timecourse. B, GFP at a representative ISI (500 ms). The thick line indicates fdr-corrected significant enhancement of GFP compared to baseline (–200 to 0) power. C, Quantitative fitting results of the clusters across individual subjects. “Presence” histograms show the number of the animals having a given topographic map. Note general similarity of presence, correlation and power of T1 (red) across different ISI conditions regardless of the presence or absence of T2 stimulation. This is also demonstrated by the convergence of correlation and power curves of T2 (blue) to those of T1 after maps 5 and 6 for ISIs of 125 and 250, respectively.
- Figure 4.
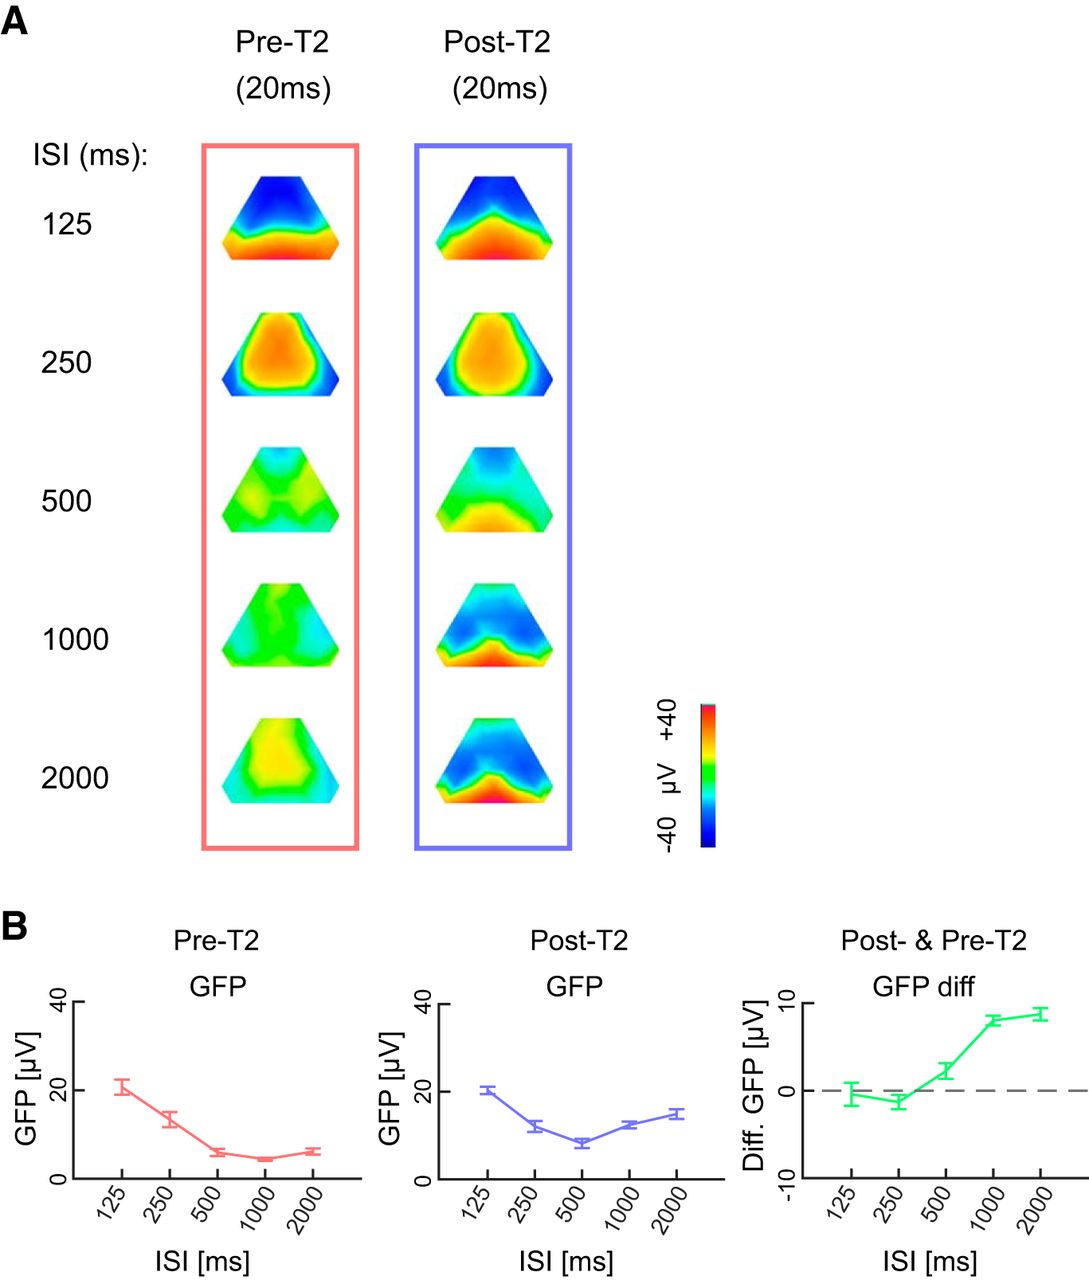
Similarity of pre-T2 and post-T2 maps at short ISIs. A, Topographic maps of pre-T2 and post-T2 EEG (20 ms each) are shown separately for each ISI. At short ISIs, visually distinguishable similarities exist between pre-T2 and post-T2 maps. B, Pre-T2, post-T2 and and the difference between them across different ISIs. As shown on the left panel, pre-T2 GFPs are higher for ISIs of 125 and 250. There is also approximately zero change in power from pre-T2 to post-T2 at these ISIs.
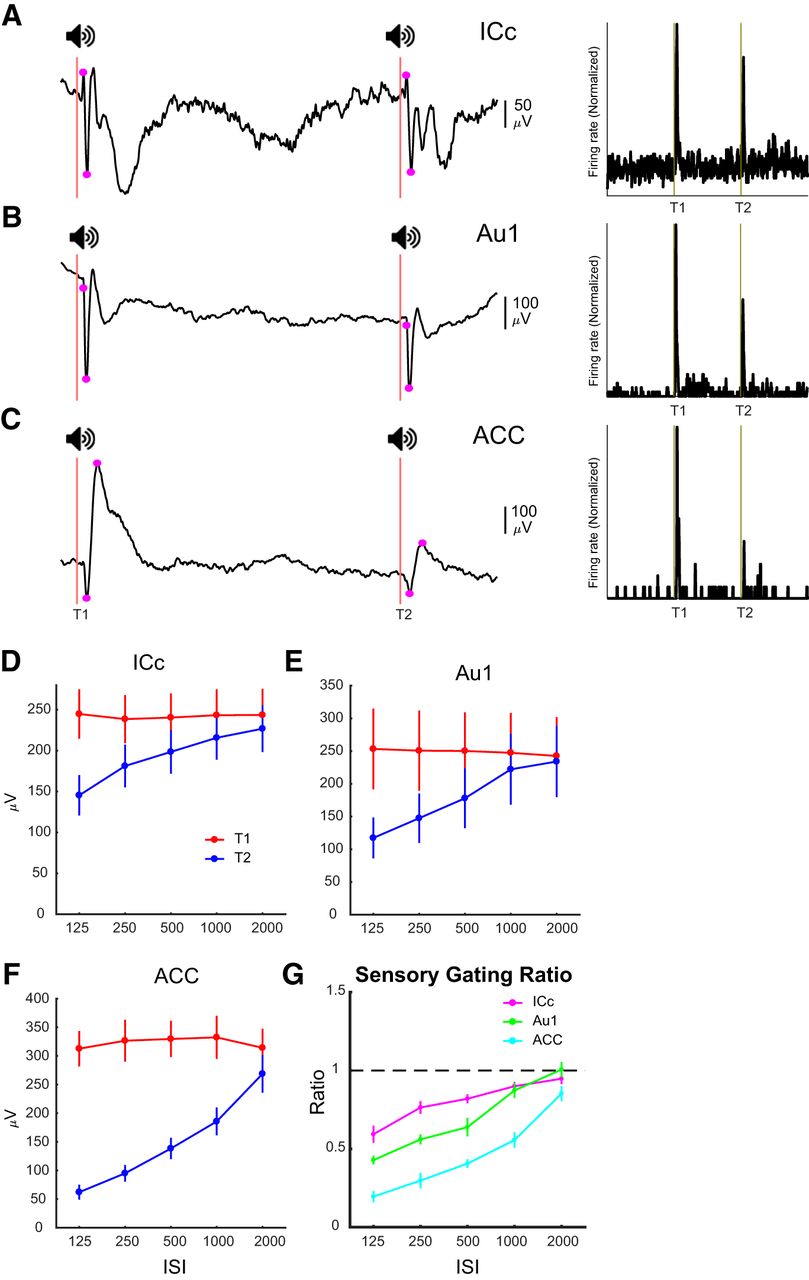
- Figure 5.
Sensory gating in intracranial signals recorded from ICc, Au1 and ACC. A–C, Example iAEPs (left panels) and PSTHs (of all units recorded during a single session) recorded from the ICc, Au1, and ACC, respectively. Magenta dots represent peak-to-peak measurement of the first major ERP component at each region. Latencies were calculated using the onsets of the initial positive peak for the ICc, the main negative deflection for the Au1, and the initial trough for the ACC. D–F, Amplitude of ERP components measured as indicated in A–C in each region, i.e., ICc (n = 12), Au1 (n = 11), and ACC (n = 10), in response to the first (red) and second (blue) tones. The larger the area between two curves is, the stronger the sensory gating is. G, The ratio of sensory gating for different components. The gating increases progressively from the ICc through auditory ERP to the ACC ERP. Error bars signify SEM.
- Figure 6.
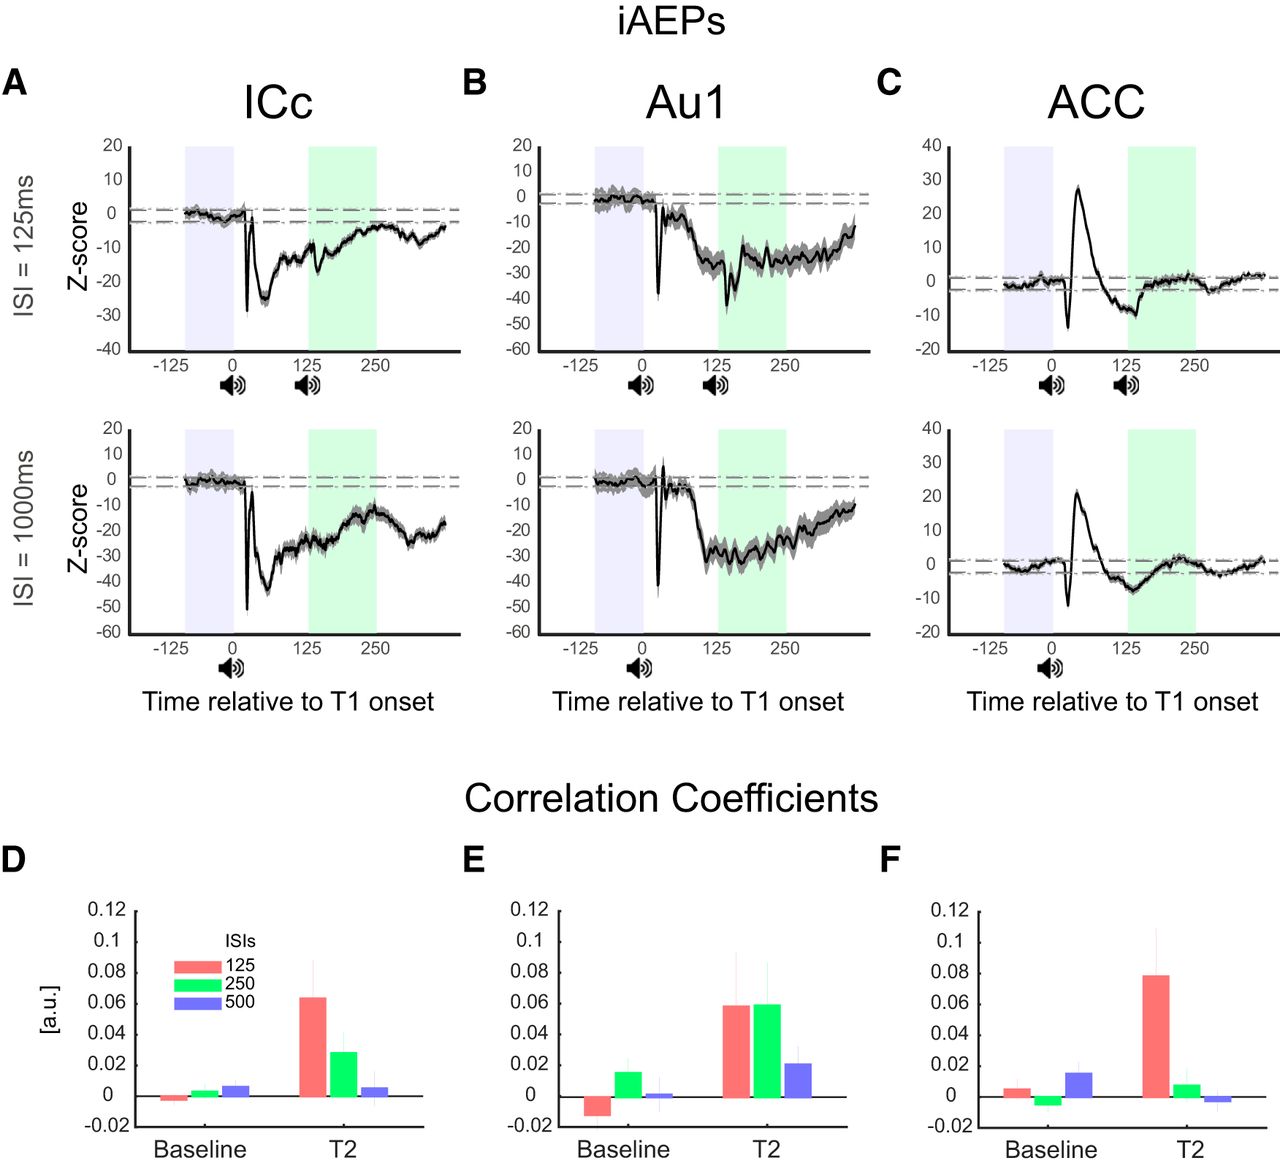
Similarity of post-T2 LFPs of short ISIs to time-matched LFPs of long ISIs. A–C, Show iAEPs of example recordings during 125 (top panels) and 1000 ms (bottom panels) ISIs. Highlighted periods represent pre-T1 baseline and period of interest (125–250 ms post-T1). Dashed lines represent Z-scores corresponding to p values of 0.05. D–F, Correlation coefficient of LFP time series of post-T2 trials during ISIs of 125, 250, and 500 ms with time-matched (i.e., 125–250, 250–375, and 500–625 ms post-T1, respectively) period of 1000 and 2000 ms ISIs. This coefficient is based on the convolution of the signals and takes into account the temporal dynamics of the signal. As it is seen in the figure, post-T2 time series at short ISIs were significantly correlated to the time-matched period in long ISIs compared to baseline correlations. This correlation deteriorates as the ISI duration increases such that there is a non-significant trend at 250 ms ISI and the correlation coefficient is not different from the baseline at 500 ms ISI.
- Figure 7.
Pre-state dynamics following T1 and before T2 auditory stimulation. A–C, left panels, Grand average ERPs across all recordings during ISIs of 250 (top panels) and 500 (bottom panels) for the ICc (n = 12), Au1 (n = 11), and ACC (n = 10), respectively. Right top panels, Corresponding grand average iAEPs calculated for the same time length relative to T1 as the left panels but without a T2, i.e., based on the 2000-ms-long ISI. The gray shades around iAEPs indicate SEM. Bottom right panels, Induced power levels during segments corresponding to pre T2 periods for 250-ms ISI (green highlighted segment in the iAEPs) and 500-ms ISI (blue segment), as compared to the baseline (gray segment). The thick blue lines indicate fdr-corrected significant difference between power of these periods compared to that of the baseline period.
- Figure 8.
ASG at vCN. A, Illustrates the grand average ERP during ISI of 500 ms recorded from the vCN of four animals. B, Shows ASG (T2/T1 ratio) across different ISIs.


In this issue


