
Main menu

  • HOME
  • CONTENT
    • Early Release
    • Featured
    • Current Issue
    • Issue Archive
    • Blog
    • Collections
    • Podcast
  • TOPICS
    • Cognition and Behavior
    • Development
    • Disorders of the Nervous System
    • History, Teaching and Public Awareness
    • Integrative Systems
    • Neuronal Excitability
    • Novel Tools and Methods
    • Sensory and Motor Systems
  • ALERTS
  • FOR AUTHORS
  • ABOUT
    • Overview
    • Editorial Board
    • For the Media
    • Privacy Policy
    • Contact Us
    • Feedback
  • SUBMIT

User menu

Search

  • Advanced search
eNeuro
eNeuro

Advanced Search


  • HOME
  • CONTENT
    • Early Release
    • Featured
    • Current Issue
    • Issue Archive
    • Blog
    • Collections
    • Podcast
  • TOPICS
    • Cognition and Behavior
    • Development
    • Disorders of the Nervous System
    • History, Teaching and Public Awareness
    • Integrative Systems
    • Neuronal Excitability
    • Novel Tools and Methods
    • Sensory and Motor Systems
  • ALERTS
  • FOR AUTHORS
  • ABOUT
    • Overview
    • Editorial Board
    • For the Media
    • Privacy Policy
    • Contact Us
    • Feedback
  • SUBMIT
PreviousNext
Research ArticleNew Research, Neuronal Excitability

Transcranial Direct Current Stimulation (tDCS) Induces Adrenergic Receptor-Dependent Microglial Morphological Changes in Mice

Tsuneko Mishima, Terumi Nagai, Kazuko Yahagi, Sonam Akther, Yuki Oe, Hiromu Monai, Shinichi Kohsaka and Hajime Hirase
eNeuro 23 August 2019, 6 (5) ENEURO.0204-19.2019; https://doi.org/10.1523/ENEURO.0204-19.2019
Tsuneko Mishima
1Laboratory for Neuron-Glia Circuitry, RIKEN Center for Brain Science, Wako 351-0198, Japan
  • Find this author on Google Scholar
  • Find this author on PubMed
  • Search for this author on this site
Terumi Nagai
1Laboratory for Neuron-Glia Circuitry, RIKEN Center for Brain Science, Wako 351-0198, Japan
  • Find this author on Google Scholar
  • Find this author on PubMed
  • Search for this author on this site
Kazuko Yahagi
1Laboratory for Neuron-Glia Circuitry, RIKEN Center for Brain Science, Wako 351-0198, Japan
  • Find this author on Google Scholar
  • Find this author on PubMed
  • Search for this author on this site
Sonam Akther
1Laboratory for Neuron-Glia Circuitry, RIKEN Center for Brain Science, Wako 351-0198, Japan
2Brain and Body System Science Institute, Saitama University, Saitama 338-8570, Japan
3Center for Translational Neuromedicine, Faculty of Health and Medical Sciences, University of Copenhagen, 2200 Copenhagen, Denmark
  • Find this author on Google Scholar
  • Find this author on PubMed
  • Search for this author on this site
Yuki Oe
1Laboratory for Neuron-Glia Circuitry, RIKEN Center for Brain Science, Wako 351-0198, Japan
  • Find this author on Google Scholar
  • Find this author on PubMed
  • Search for this author on this site
  • ORCID record for Yuki Oe
Hiromu Monai
1Laboratory for Neuron-Glia Circuitry, RIKEN Center for Brain Science, Wako 351-0198, Japan
4Faculty of Core Research Natural Science Division, Ochanomizu University, Tokyo 112-8610, Japan
  • Find this author on Google Scholar
  • Find this author on PubMed
  • Search for this author on this site
Shinichi Kohsaka
5National Institute of Neuroscience, National Center of Neurology and Psychiatry, Kodaira 187-0031, Japan
  • Find this author on Google Scholar
  • Find this author on PubMed
  • Search for this author on this site
Hajime Hirase
1Laboratory for Neuron-Glia Circuitry, RIKEN Center for Brain Science, Wako 351-0198, Japan
2Brain and Body System Science Institute, Saitama University, Saitama 338-8570, Japan
3Center for Translational Neuromedicine, Faculty of Health and Medical Sciences, University of Copenhagen, 2200 Copenhagen, Denmark
  • Find this author on Google Scholar
  • Find this author on PubMed
  • Search for this author on this site
  • ORCID record for Hajime Hirase
  • Article
  • Figures & Data
  • Info & Metrics
  • eLetters
  • PDF
Loading

Article Figures & Data

Figures

  • Tables
  • Extended Data
  • Figure1
    • Download figure
    • Open in new tab
    • Download powerpoint
  • Figure 1.
    • Download figure
    • Open in new tab
    • Download powerpoint
    Figure 1.

    Head-restraint tDCS experiment. A, Experimental setup for tDCS. B, Experimental schedule of immunohistochemical experiment. C, Top view of a BAC-GLT1-G7 Line 817 (G7NG817) mouse. Fluorescent Ca2+ signal is transcranially observable. Signals ∼3 mm anterior to the anodal site (1 × 1 mm2 red square) are plotted from four mice (right, top traces). The bold trace on the bottom is the mean of the four traces, and the shaded areas represent SE. The red arrowhead and line indicate the onset of tDCS. Scale bar, 1 mm. tDCS-induced Ca2+ elevations were not observed in isoflurane-anesthetized mice (Extended Data Fig. 1-1).

  • Figure 2.
    • Download figure
    • Open in new tab
    • Download powerpoint
    Figure 2.

    Intensity analysis of microglial confocal images. A, B, Representative images of Cy3-labeled Iba1 IHC by maximum intensity projection obtained in Sham- and LPS-treated mice. Yellow scale bars: A, left, 100 μm; A, right, B, 20 μm. C, Cumulative pixel intensity distributions from unrestrained Ctl and head-restrained Sham groups were similar and distinct from the LPS-treated group. D–G, Intensity was compared between tDCS- and Sham-treated groups under the isoflurane-anesthetized (D, E) or awake (F, G) conditions, perfused at 30 min or 3 h after sham/tDCS. H, In awake mice, the pixel intensity histogram indicates that there is a cluster at z score >2 (i.e., mean + 2 SDs) region in the tDCS group (dotted red square). I, J, Representative images from a sham-treated mouse and a tDCS-treated mouse. Images in the red squares correspond to the thresholded images on the left at the mean + 2 SDs. Red scale bars, 20 μm. **p < 0.01, ***p < 0.001.
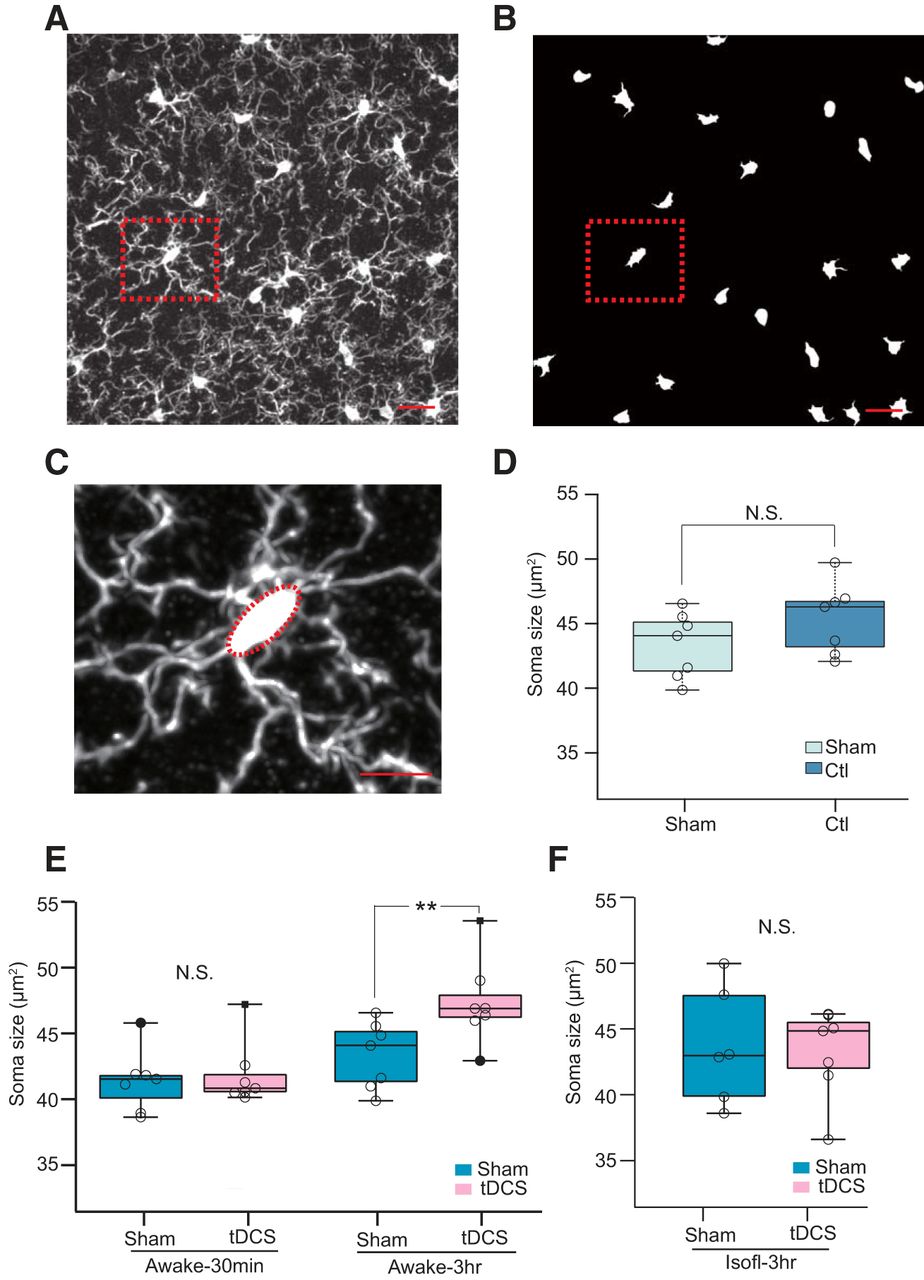
  • Figure 3.
    • Download figure
    • Open in new tab
    • Download powerpoint
    Figure 3.

    Quantification and comparison of microglial soma size. A, Example image of an Iba1 IHC confocal image stack collapsed by maximum intensity projection. Scale bar, 20 μm. B, Digitally processed image of A for soma extraction. C, Example of the elliptic approximation of soma (A, B, red dotted square). D, Comparison of median values of microglial soma areas between Sham-stimulated and unrestrained control mice (p = 0.1a, Mann–Whitney Wilcoxon rank sum test). Scale bars: A, B, 10 μm; C, 20 μm. E, Comparison of microglial soma size in awake mice with/without tDCS treatment at different time points (30 min or 3 h) after tDCS. Microglial soma size was larger in the tDCS group in the awake 3 h experiment (p = 0.017c, Mann–Whitney Wilcoxon rank sum test). Each group contains seven mice. F, Microglial soma size comparison in isoflurane-anesthetized mice (Isofl-3hr). **p < 0.03, N.S. not significant.
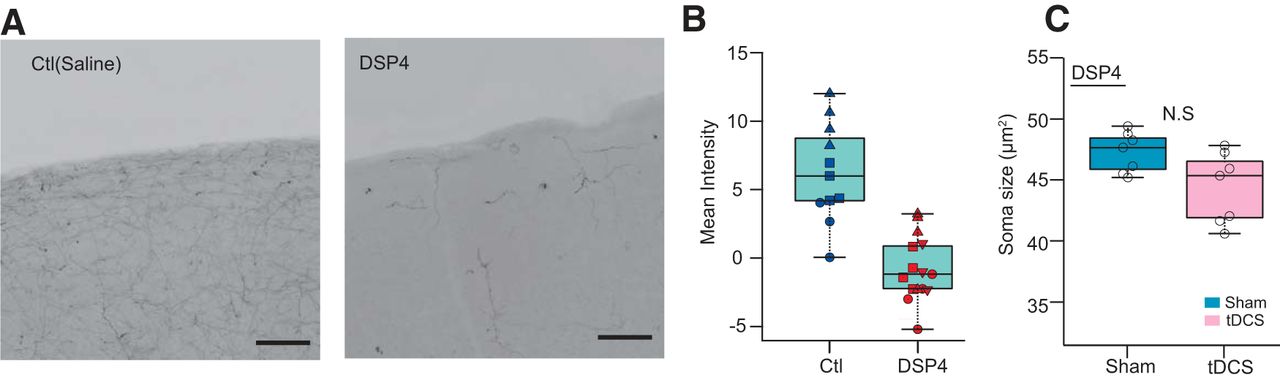
  • Figure 4.
    • Download figure
    • Open in new tab
    • Download powerpoint
    Figure 4.

    tDCS-induced microglial somatic enlargement depends on noradrenaline. A, Example of cortical image (inverted grayscale) from saline- (left) or DSP4- (right) pretreated mice stained with TH antibody. B, Mean intensity analysis of TH+ fiber. Each group contains data from three mice. Data from the same animals are plotted with the same symbol and color. Scale bars, 100 μm. C, Comparison between median glial soma size from sham- and tDCS-treated mice (Sham group: 7 mice; tDCS: 7 mice; p = 0.073e, Mann–Whitney Wilcoxon rank sum test). N.S. not significant.

  • Figure 5.
    • Download figure
    • Open in new tab
    • Download powerpoint
    Figure 5.

    tDCS-induced microglial somatic enlargement depends on B2AR and A1AR pathways. A, Comparison between median microglial soma size between Sham- and tDCS-treated IP3R2 KO mice (Sham group: 6 mice; tDCS group: 7 mice; p = 0.73f). B, C, Comparison of microglial soma size between Sham- and tDCS-treated wild-type strain C57BL/6J with prazosin (B; Sham group: 7 mice; tDCS group: 7 mice; p = 0.8 × g), or ICI181551 pretreatment (C; Sham group: 6 mice; tDCS group: 6 mice; p = 0.48h). N.S. not significant.

  • Figure 6.
    • Download figure
    • Open in new tab
    • Download powerpoint
    Figure 6.

    In vivo monitoring of microglial morphologic dynamics. A, B, Experimental setup (A) and time schedule of in vivo two-photon imaging (B). C, Representative images of a microglia overlaid from t = 0 to respective time points (10, 30, and 40 min). D, Normalized surveillance area curve during 60 min imaging period. Red arrowheads show the time points for the images in C. Scale bar, 10 μm. E, Initial microglial area at t = 0 of Before and After sessions are similar in Sham mice (13 cells from 8 mice; p = 0.82i). Blue lines represent data from individual microglia, and the black line represents averaged data. F, Normalized surveillance area curves during the 60 min imaging period before (blue) and after (red) stimulation in the sham (left) and tDCS (right) mice. Data are represented as the mean ± SEM. G, Normalized surveillance area at t = 40 min in Before and After sessions in tDCS-treated mice (normalized by surveillance area at t = 0/Before). Red lines represent data from individual microglia, and the black line represents averaged data. p = 0.014j, paired t test. **p < 0.03.
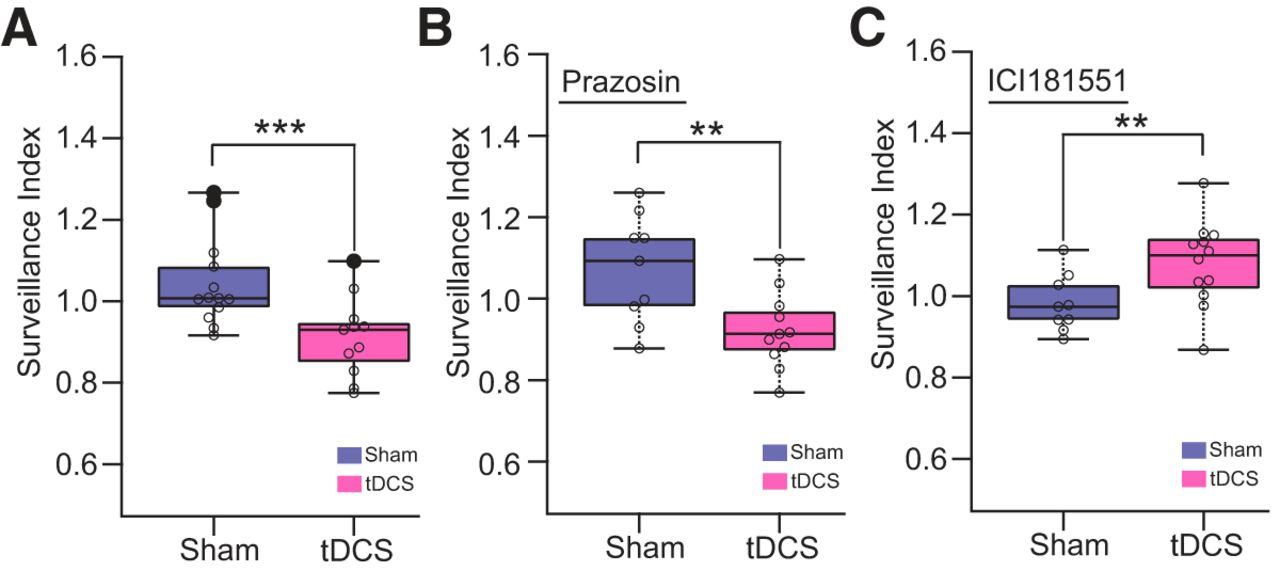
  • Figure 7.
    • Download figure
    • Open in new tab
    • Download powerpoint
    Figure 7.

    Microglial surveillance is compromised by tDCS. A, Surveillance index at t = 40 min after sham/tDCS treatment in no drug-treated animals (Sham group: 13 cells from 8 mice; tDCS group: 11 cells from 8 mice; p = 0.006k). B, Surveillance index comparison in prazosin pretreated mice (Sham group: 9 cells from 2 mice; tDCS group: 11 cells from 3 mice; p = 0.015l). C, Surveillance index comparison in ICI181551-pretreated mice (Sham group: 9 cells from 3 mice; tDCS group: 12 cells from 3 mice; p = 0.023m) Mann–Whitney Wilcoxon rank sum test. **p < 0.03; ***p < 0.01.

Tables

  • Figures
  • Extended Data
    • View popup
    Table 1:

    Statistical table

     Sample number: cells (animals)Test typep ValuePower
    aSham: 334(7), Ctl: 315(7)Mann–Whitney Wilcoxon rank sum test0.1 
    bSham: 315(7), tDCS: 314(7)Mann–Whitney Wilcoxon rank sum test0.16 
    cSham: 309(7), tDCS: 301(7)Mann–Whitney Wilcoxon rank sum test**0.017 
    dSham: 278(6), tDCS: 296(7)Mann–Whitney Wilcoxon rank sum test0.95 
    eSham: 285(7), tDCS: 319(7)Mann–Whitney Wilcoxon rank sum test0.073 
    fSham: 238(6), tDCS: 356(7)Mann–Whitney Wilcoxon rank sum test0.73 
    gSham: 274(7), tDCS: 310(7)Mann–Whitney Wilcoxon rank sum test0.8 
    hSham: 266(6), tDCS: 282(6)Mann–Whitney Wilcoxon rank sum test0.48 
    iSham: 13(8)Paired t test0.820.055
    jtDCS: 11(8)Paired t test**0.0140.77
    kSham: 13(8), tDCS: 11(8)Mann–Whitney Wilcoxon rank sum test***0.006 
    lSham: 11(3), tDCS: 9(2)Mann–Whitney Wilcoxon rank sum test**0.015 
    mSham: 9(3), tDCS: 12(3)Mann–Whitney Wilcoxon rank sum test**0.023 
    • *p < 0.05, **p < 0.03, ***p < 0.01

Extended Data

  • Figures
  • Tables
  • Extended Data Figure 1-1

    Cortical Ca2+ activity during tDCS in mice under deep isoflurane anesthesia. G-CaMP7 signal was transcranially measured from isoflurane-anesthetized (1.5–2.0%) BAC-GLT1-G7 Line 817 (G7NG817) mice. The top trace is for Sham stimulation (−3.14 ± 0.02%), and the lower trace is for tDCS (0.1 mA, 10 min; −4.30 ± 0.02%). Bold traces represent the mean of 11 traces from 9 mice. Shaded areas represent the SE. The red arrowhead and vertical line indicate the onset of tDCS or sham stimulation. Download Extended Data 1, EPS file.

Back to top

In this issue

eneuro: 6 (5)
eNeuro
Vol. 6, Issue 5
September/October 2019
  • Table of Contents
  • Index by author
  • Ed Board (PDF)
Email

Thank you for sharing this eNeuro article.

NOTE: We request your email address only to inform the recipient that it was you who recommended this article, and that it is not junk mail. We do not retain these email addresses.

Enter multiple addresses on separate lines or separate them with commas.
Transcranial Direct Current Stimulation (tDCS) Induces Adrenergic Receptor-Dependent Microglial Morphological Changes in Mice
(Your Name) has forwarded a page to you from eNeuro
(Your Name) thought you would be interested in this article in eNeuro.
CAPTCHA
This question is for testing whether or not you are a human visitor and to prevent automated spam submissions.
Print
View Full Page PDF
Citation Tools
Transcranial Direct Current Stimulation (tDCS) Induces Adrenergic Receptor-Dependent Microglial Morphological Changes in Mice
Tsuneko Mishima, Terumi Nagai, Kazuko Yahagi, Sonam Akther, Yuki Oe, Hiromu Monai, Shinichi Kohsaka, Hajime Hirase
eNeuro 23 August 2019, 6 (5) ENEURO.0204-19.2019; DOI: 10.1523/ENEURO.0204-19.2019

Citation Manager Formats

  • BibTeX
  • Bookends
  • EasyBib
  • EndNote (tagged)
  • EndNote 8 (xml)
  • Medlars
  • Mendeley
  • Papers
  • RefWorks Tagged
  • Ref Manager
  • RIS
  • Zotero
Respond to this article
Share
Transcranial Direct Current Stimulation (tDCS) Induces Adrenergic Receptor-Dependent Microglial Morphological Changes in Mice
Tsuneko Mishima, Terumi Nagai, Kazuko Yahagi, Sonam Akther, Yuki Oe, Hiromu Monai, Shinichi Kohsaka, Hajime Hirase
eNeuro 23 August 2019, 6 (5) ENEURO.0204-19.2019; DOI: 10.1523/ENEURO.0204-19.2019
Twitter logo Facebook logo Mendeley logo
  • Tweet Widget
  • Facebook Like
  • Google Plus One

Jump to section

  • Article
    • Visual Abstract
    • Abstract
    • Significance Statement
    • Introduction
    • Materials and Methods
    • Results
    • Discussion
    • Acknowledgments
    • Footnotes
    • References
    • Synthesis
  • Figures & Data
  • Info & Metrics
  • eLetters
  • PDF

Keywords

  • Iba1
  • in vivo
  • microglia
  • norepinephrine
  • tDCS
  • two-photon imaging

Responses to this article

Respond to this article

Jump to comment:

No eLetters have been published for this article.

Related Articles

Cited By...

More in this TOC Section

New Research

  • A Very Fast Time Scale of Human Motor Adaptation: Within Movement Adjustments of Internal Representations during Reaching
  • TrkB Signaling Influences Gene Expression in Cortistatin-Expressing Interneurons
  • Optogenetic Activation of β-Endorphin Terminals in the Medial Preoptic Nucleus Regulates Female Sexual Receptivity
Show more New Research

Neuronal Excitability

  • Investigating Mechanically Activated Currents from Trigeminal Neurons of Non-Human Primates
  • Postnatal Development of Dendritic Morphology and Action Potential Shape in Rat Substantia Nigra Dopaminergic Neurons
  • Recurrent Interneuron Connectivity Does Not Support Synchrony in a Biophysical Dentate Gyrus Model
Show more Neuronal Excitability

Subjects

  • Neuronal Excitability
  • Home
  • Alerts
  • Follow SFN on BlueSky
  • Visit Society for Neuroscience on Facebook
  • Follow Society for Neuroscience on Twitter
  • Follow Society for Neuroscience on LinkedIn
  • Visit Society for Neuroscience on Youtube
  • Follow our RSS feeds

Content

  • Early Release
  • Current Issue
  • Latest Articles
  • Issue Archive
  • Blog
  • Browse by Topic

Information

  • For Authors
  • For the Media

About

  • About the Journal
  • Editorial Board
  • Privacy Notice
  • Contact
  • Feedback
(eNeuro logo)
(SfN logo)

Copyright © 2025 by the Society for Neuroscience.
eNeuro eISSN: 2373-2822

The ideas and opinions expressed in eNeuro do not necessarily reflect those of SfN or the eNeuro Editorial Board. Publication of an advertisement or other product mention in eNeuro should not be construed as an endorsement of the manufacturer’s claims. SfN does not assume any responsibility for any injury and/or damage to persons or property arising from or related to any use of any material contained in eNeuro.