

Article Figures & Data
Figures
- Figure 1.
Experimental design. A, visual–tactile stimuli were presented on each trial. Brief changes in stimulus intensity occurred concurrently in both modalities, either in the same direction (“congruent”) or in different directions (“incongruent”). B, Each trial started with a central arrow that cued the left or right side reliably. After 1 s of central fixation, the visual–tactile stimulus was presented on the cued side. Participants were asked to maintain central fixation and report congruence of the presented stimulus. After response, participants received feedback. C, Multi-electrode tACS montage (black and white electrodes represent different polarities) and estimation of current density on cortical surface. Participants received either left or right hemispheric stimulation with two 4-in-1 montages over visual and somatosensory cortices. Color coding on cortical surface corresponds to the simulated maximum absolute field strength in V/m. D, On a given trial, electrical and sensory stimulation could be targeted at the same hemisphere (left) or at different hemispheres (right).
- Figure 2.
Results from ANOVA. A correlation analysis between tACS side effect and significant interactions in the RT ANOVA is provided as Extended Data Figure 2-1. A, Overview of all conditions entering the HEMISPHERE (2) × FREQUENCY (2) × STIMULATION (3) × CONGRUENCE (2); repeated-measures ANOVA (rmANOVA). Filled/empty circles represent congruent/incongruent trials. Factor levels of STIMULATION are color coded (blue, sham; red, in-phase; yellow, anti-phase). B–E, Main effects resulting from 2 × 2 × 3 × 2 rm-ANOVA. F, CONGRUENCE × STIMULATION interaction for gamma stimulation over the hemisphere targeted by sensory stimuli (*p < 0.05, **p < 0.01, ***p < 0.001). G, FREQUENCY × STIMULATION interaction for stimulation of the hemisphere not targeted by sensory stimulation.
- Figure 3.
Results from follow-up analysis comparing RT distributions. A, Follow-up analysis of the STIMULATION × CONGRUENCE interaction found for gamma stimulation over the hemisphere targeted by sensory input (same). Left, CDFs corresponding to all levels of the 2 × 3 interaction. Middle, Differences in CDFs for congruent trials between levels of factor STIMULATION. Gray-shaded area indicates the CI as estimated by nonparametric permutation statistics (corrected for multiple comparisons, p < 0.000129). All differences outside the CI indicate significant differences between the respective conditions. Right, Differences in CDFs for incongruent trials between levels of factor STIMULATION. B, Follow-up analysis of the FREQUENCY × STIMULATION interaction found for stimulation over the hemisphere not targeted by sensory input. Left, CDFs corresponding to all levels of the 2 × 3 interaction. Middle, Differences in CDFs for trials under alpha stimulation between levels of factor STIMULATION. Gray-shaded area indicates the CI as estimated by permutation statistics (corrected for multiple comparisons, p < 0.000129). Right, Differences in CDFs for trials under gamma stimulation between levels of factor STIMULATION.
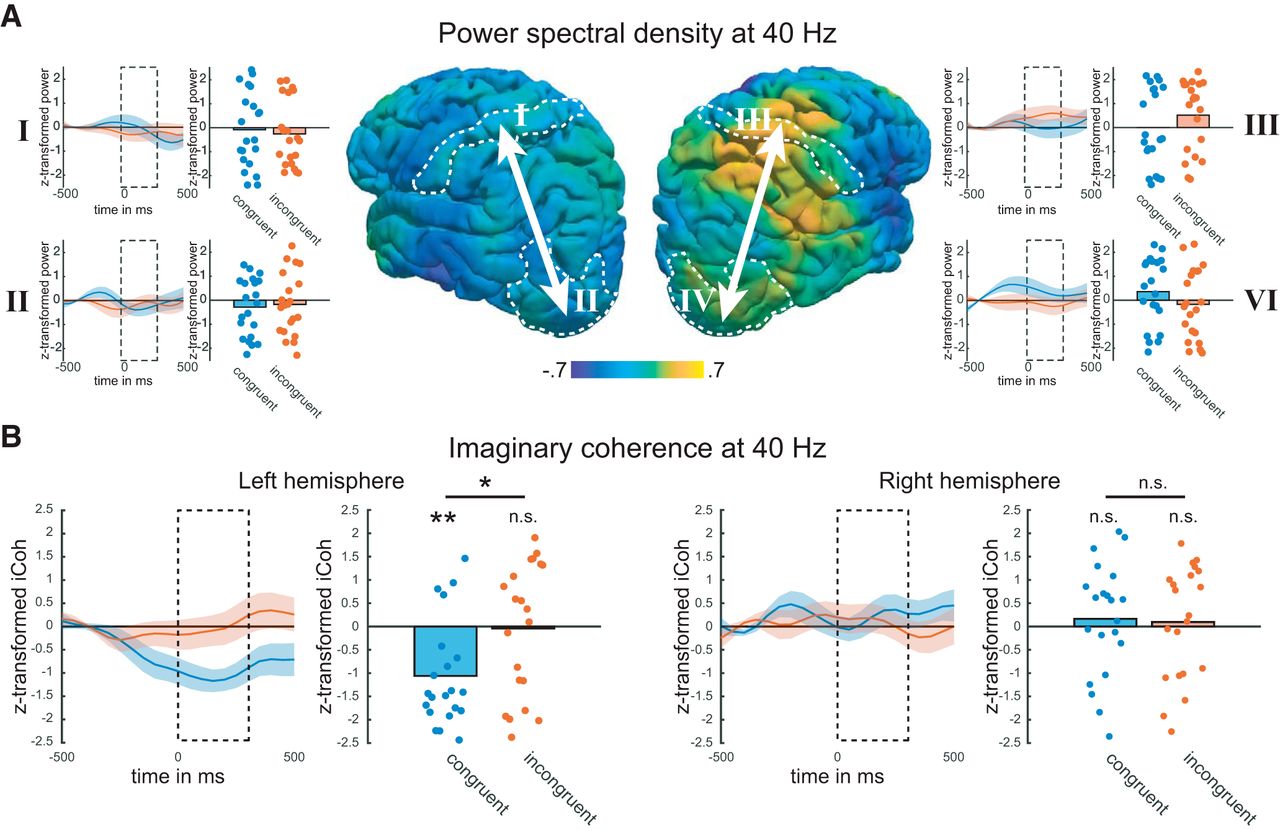
- Figure 4.
Results from reanalysis of EEG data. In a previous study (Misselhorn et al., 2019), EEG was recorded during a similar experimental paradigm. Here, we reanalyzed the data with a focus on power and imaginary coherence in and between visual and somatosensory areas at 40 Hz. In the extended data, we present an analysis comparing the average change in 40 Hz power across hemispheres (Extended Data Fig. 4-1) as well as an analysis of the correlation between power and iCoh (Extended Data Fig. 4-2). A, Middle, Distribution of average normalized power at 40 Hz during the change interval. Dotted outlines indicate borders of ROIs. Left, right, Roman numerals indicate the ROI in which power was computed. Each graph depicts the time course of power changes for congruent (blue) and incongruent (red) trials as well as the average power during change (dotted box) as a bar/scatter plot. All comparisons resulted in nonsignificant differences (all p > 0.05). B, Left, Timecourse of iCoh between visual (II) and somatosensory (I) cortices of the left hemisphere. Bar/scatter plots depict average iCoh during change interval (dotted box; n.s. p > 0.05, *p < 0.05, **p < 0.01). Right, Timecourse of iCoh between visual (IV) and somatosensory (III) cortices of the right hemisphere. Bar/scatter plots depict average iCoh during change interval.


Tables
Factor F p 
Complete ANOVA model CONGRUENCE 34.659 0.000 0.646 STIMULATION × CONGRUENCE 4.199 0.032 0.181 FREQUENCY × STIMULATION × CONGRUENCE 4.089 0.027 0.177 HEMISPHERE × FREQUENCY × STIMULATION × CONGRUENCE 4.862 0.015 0.204 Reduced model: different HEMISPHEREs CONGRUENCE 24.803 0.000 0.566 FREQUENCY × STIMULATION 3.771 0.038 0.166 Reduced model: same HEMISPHERE CONGRUENCE 40.028 0.000 0.678 FREQUENCY × STIMULATION × CONGRUENCE 7.548 0.002 0.284 Reduced model: same HEMISPHERE, alpha FREQUENCY CONGRUENCE 43.454 0.000 0.696 Reduced model: same HEMISPHERE, gamma FREQUENCY CONGRUENCE 26.133 0.000 0.579 STIMULATION × CONGRUENCE 4.578 0.018 0.194 Complete tables of ANOVA for accuracy and response time data can be found as Extended Data Table 1-1.

Figure 2-1
Side effects of tACS. A, Visualization of questionnaire data for skin sensations (aggregated across itching, warmth, stinging, pulsating), phosphenes, fatigue, and pain. Lowest row represents “absent” response while top rows indicate “light” to “strong” sensation. The sizes of circles represent the number of responses, and asterisks indicate the median response per condition and sensation. B–D, Correlations of ranked behavioral effect detected in ANOVA with skin sensations (rank 1 is lowest value). Bar plots indicate direction of behavioral effects. Across all effects, correlations are weak and nonsignificant, but show signs that are opposite to what would have been expected if side effects drove the behavioral effects. Download Figure 2-1, EPS file.
Table 1-1
: Complete and reduced ANOVA results from behavior in tACS experiment Download Table 1-1, DOC file.
Figure 4-1
Average power change of 40 Hz activity in visual and somatosensory cortices. Average power change in left visual (blue) and somatosensory cortices (red) for the left and right hemispheres. Paired-sample t tests showed that none of these changes represent a significant deviation from zero (all uncorrected p > 0.15). Although, descriptively, 40 Hz power increased in right hemisphere and decreased in left hemisphere, comparisons between left and right visual and somatosensory cortices, respectively, were nonsignificant (all uncorrected p > 0.1). Download Figure 4-1, EPS file.
Figure 4-2
Correlation between power in and imaginary coherence between visual and somatosensory cortices at 40 Hz. Scatter plots depict differences incongruent − incongruent in z-scored and normalized power/iCoh. Top left, No significant correlation between power in left visual cortex and imaginary coherence between left visual and somatosensory cortices. Top right, No significant correlation between power in right visual cortex and imaginary coherence between right visual and somatosensory cortices. Bottom left, No significant correlation between power in left somatosensory cortex and imaginary coherence between left visual and somatosensory cortices. Top right, Significant correlation between power in right somatosensory cortex and imaginary coherence between right visual and somatosensory cortices. Download Figure 4-2, EPS file.
In this issue


