

Article Figures & Data
Figures
- Figure 1.
A, Examples of spectrograms of spoken stimuli used in the experiment (adapted from Gansonre et al., (2018)). B, Examples of waveforms plotted on top of each other.
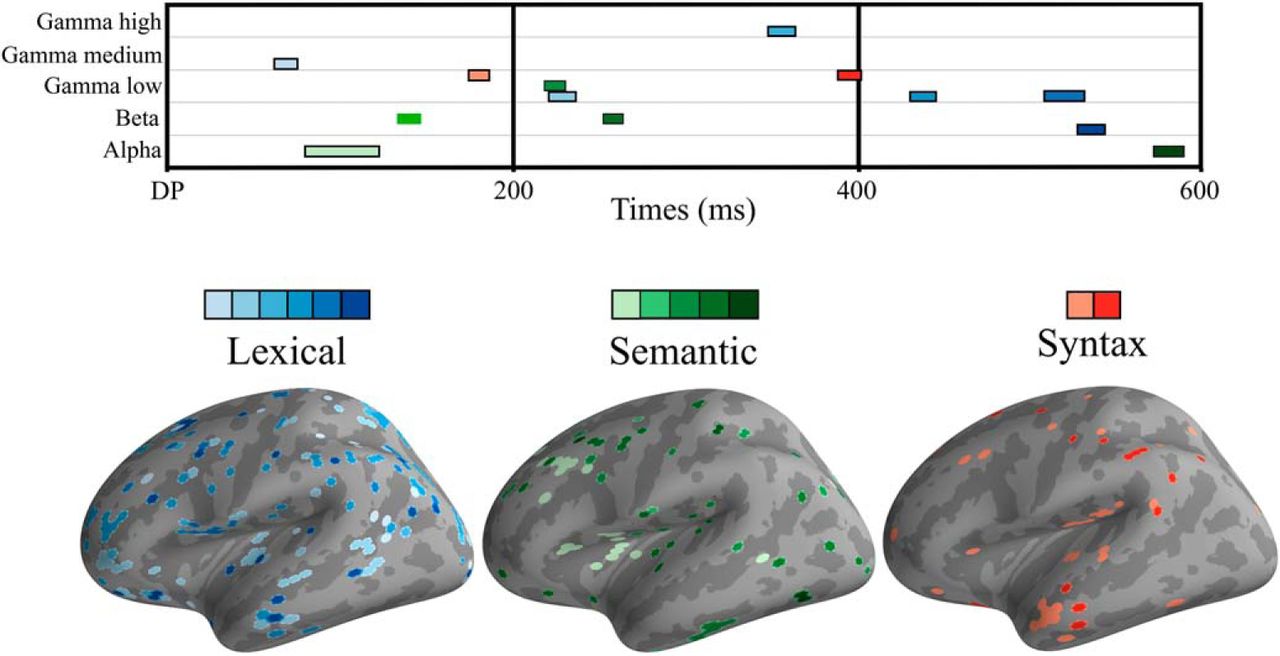
- Figure 2.
Top, Heatmap of significant clusters across three linguistic contrasts, five frequency bands, and time. Lexical condition in blue colors, semantic in green, and syntax in red. Bottom, Surface topography of significant effects. For all conditions, colors go from lighter to darker as latency becomes longer.
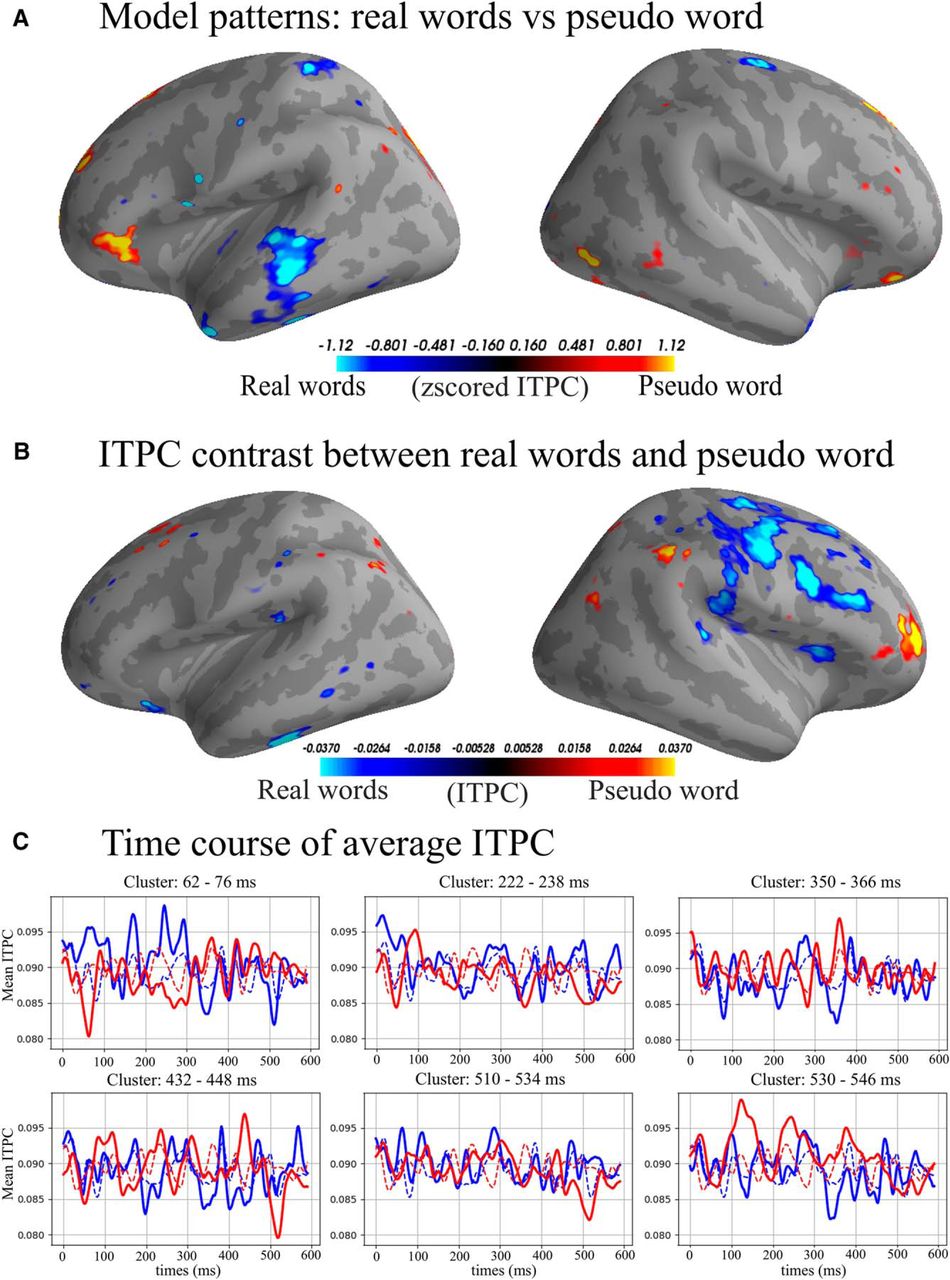
- Figure 3.
A, Model patterns: interpreting coefficients of a machine learning model is not trivial and a high coefficient value does not necessitate a high signal value in the MEG data (for details, see Haufe et al., 2014). “Model patterns” are a way to highlight the signal in a neurophysiological sensible way that is directly interpretable compared to the raw coefficients (Haufe et al., 2014). We show top and bottom 5% of the patterns in the γ-low band from 222 to 238 ms. Blue colors are areas of activation able to predict real words and yellow/red are areas used to predict pseudo word. B, Average top and bottom 5% of ITPC difference; blue colors indicate higher ITPC for real words and yellow/red colors indicate higher ITPC for pseudo word γ-low band from 222 to 238 ms. C, Average ITPC over time; solid lines are the average of the selected features, dashed lines are the average of all vertices in the source space. Time 0 is the divergence point, when stimuli could be recognized from the available acoustic information.
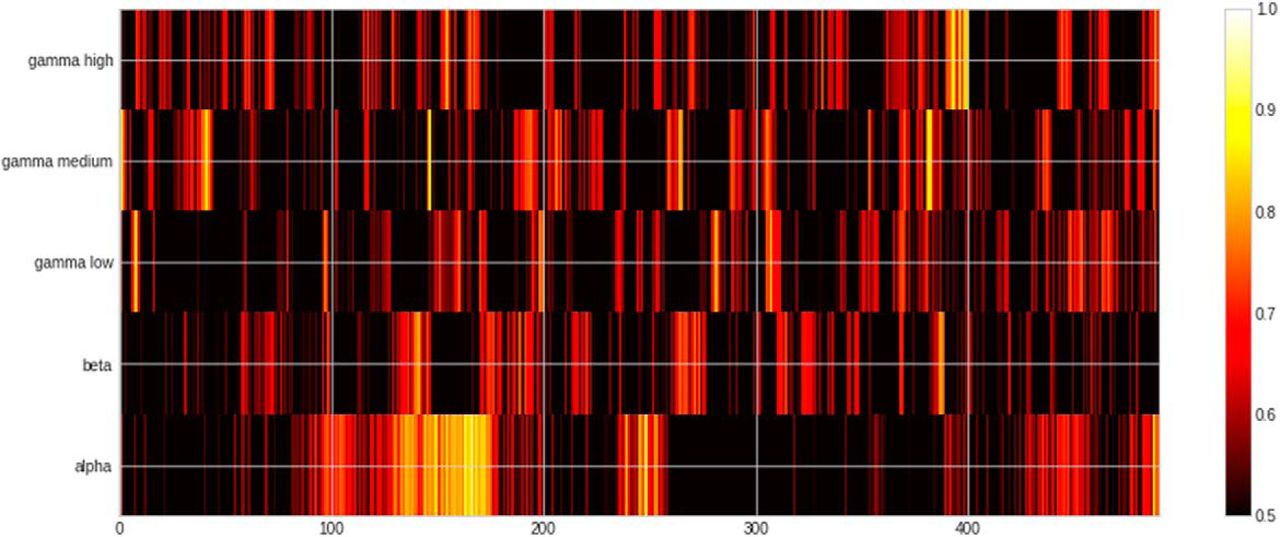
- Figure 4.
Heatmap of ROC-AUC scores for all bands in lexical condition. Note that chance in this condition is 75%. Time is relative to DP.
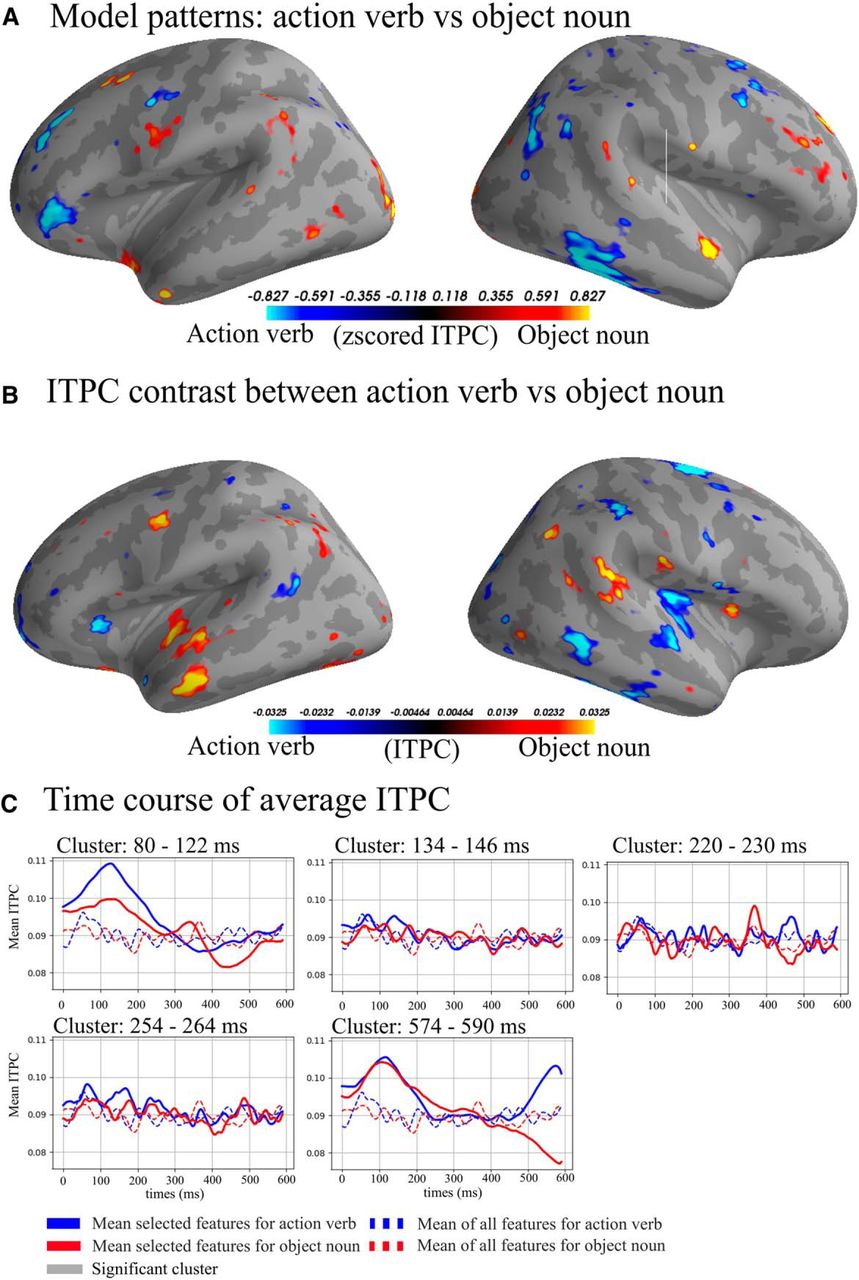
- Figure 5.
A, Model patterns (see also Fig. 4 legend): top and bottom 5% of the patterns in the the α band from 80 to 122 ms. Blue colors are areas used to predict action verb and yellow/red are areas used to predict object noun. B, Average top and bottom 5% of ITPC difference, blue colors indicating higher ITPC for action verb and yellow/red indicating higher ITPC for object noun from 80 to 122 ms. C, Average ITPC over time, solid lines are the average of the selected features, dashed lines are the average of all vertices in the source space. Time 0 is the divergence point, when stimuli could be recognized from the available acoustic information.
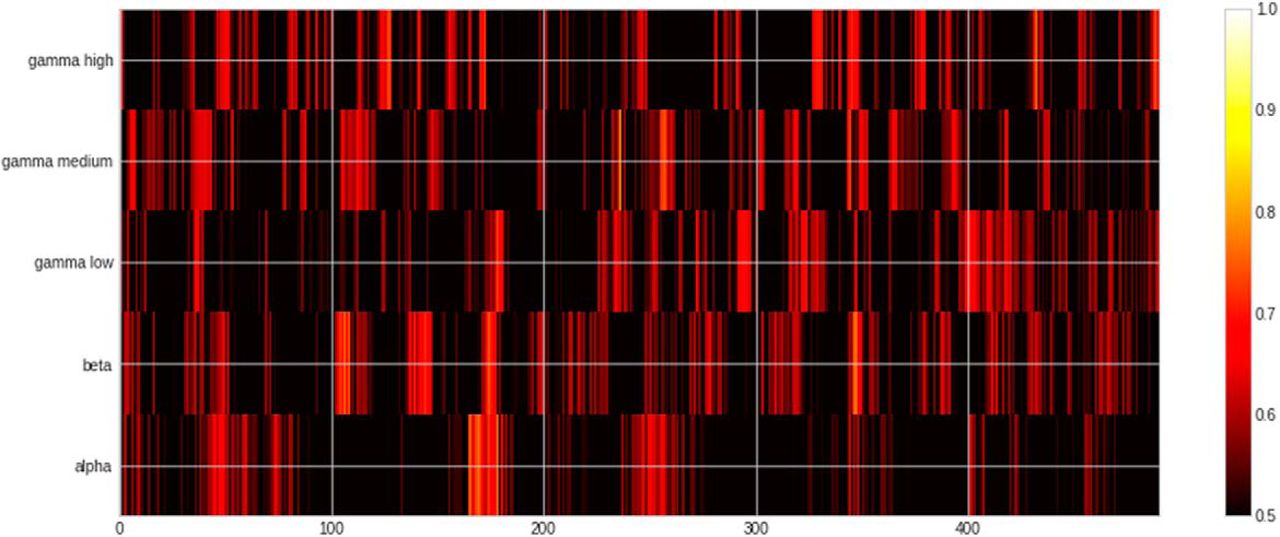
- Figure 6.
Heatmap of ROC-AUC scores for all bands in semantic condition.
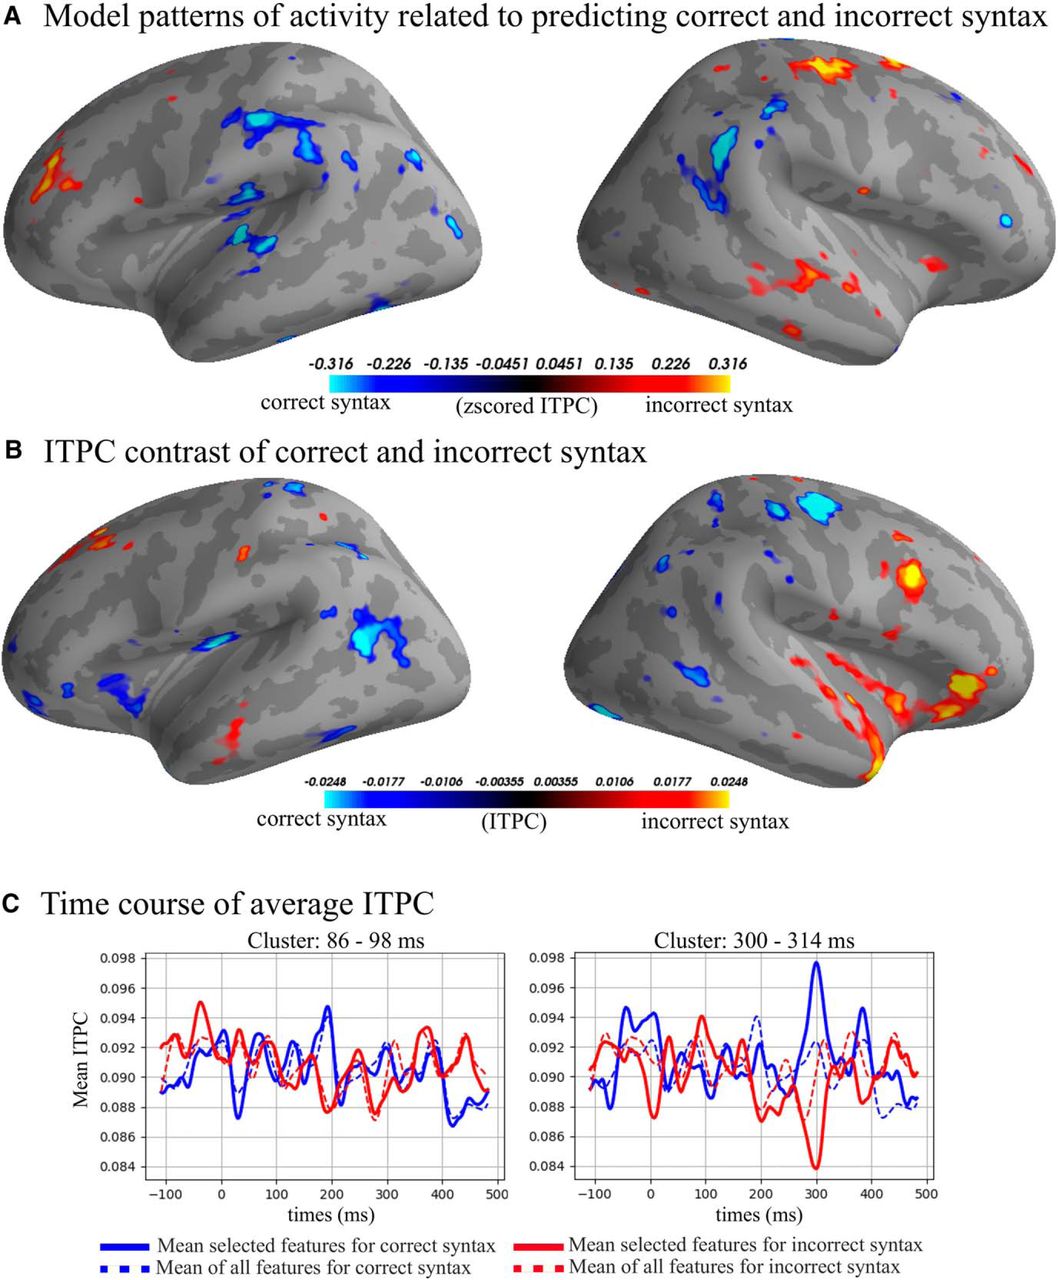
- Figure 7.
A, Model patterns: top and bottom 5% of the patterns in the γ-low band from 84 to 98 ms. Blue colors are areas used to predict correct syntax and yellow/red are areas used to predict incorrect syntax. B, Average top and bottom 5% of ITPC difference. Blue colors indicate higher ITPC for correct syntax and yellow/red colors indicate higher ITPC γ-low band from 84 to 98 ms. C, Average ITPC over time; solid lines are the average of the selected features, dashed lines are the average of all vertices in the source space. Time is relative to the divergence point.
- Figure 8.
Heatmap of ROC-AUC scores for all bands in syntax condition.


Tables
- Table 1.
Table of significant clusters in the lexical condition sorted by time from the divergence point
Lexical Band Peak (%) Peak SD (%) Peak time (ms) Cluster start (ms) Cluster end (ms) Cluster length (ms) Cluster mean (%) Cluster SD (%) γ-Medium 88.53 6.43 66 62 76 14 83.20 4.57 γ-Low 94.35 4.50 224 222 238 16 85.02 9.68 γ-High 87.88 9.29 358 350 366 16 80.19 4.95 γ-Low 87.65 11.08 440 432 448 16 81.34 4.99 γ-Low 87.71 8.83 516 510 534 24 81.34 4.36 β 85.97 14.95 538 530 546 16 80.25 4.32 Peak is highest ROC-AUC scores of the cluster. Peak SD is the standard deviation (SD) of cross-validation folds for the peak ROC-AUC score. Peak time is the time of the peak from DP. Cluster start is the start time of the cluster from DP. Cluster end is the end time of the cluster from DP. Cluster length is the length of the cluster. Cluster mean is the mean ROC-AUC score of the cluster. Cluster SD is the SD of the cluster mean across cross-validation folds.
- Table 2.
Table of significant clusters in the semantic condition sorted by time from the divergence point
Semantics Band Peak (%) Peak SD (%) Peak time (ms) Cluster start (ms) Cluster end (ms) Cluster length (ms) Cluster mean (%) Cluster SD (%) α 91.11 12.96 106 80 122 42 68.21 9.77 β 75.00 19.08 138 134 146 12 69.62 5.25 γ-Low 84.58 9.01 224 220 230 10 71.85 7.06 β 70.00 13.43 256 254 264 10 66.53 3.37 α 85.83 3.74 584 574 590 16 71.71 7.62 See the legend of Table 1 for an explanation of the columns.
- Table 3.
Table of significant clusters in the syntax condition sorted by time from the divergence point
Syntax Band Peak (%) Peak SD (%) Peak time (ms) Cluster start (ms) Cluster end (ms) Cluster length (ms) Cluster mean (%) Cluster SD (%) γ-Low 69.22 13.05 90 85 98 12 62.57 9.16 γ-Low 68.36 11.57 302 300 314 14 64.04 5.10 See the legend of Table 1 for an explanation of the columns.
- Table 4.
Table of peak scores for each bands and condition, dash (-) indicates no significant cluster
Condition Lexical condition Semantic condition Syntax condition Band Peak score Peak SD Peak time Peak score Peak SD Peak time Peak score Peak SD Peak time α - - - 91.11 12.96 106 - - - β 85.97 14.95 538 75.00 19.08 138 - - - γ-Low 94.35 4.50 224 84.58 9.01 224 69.22 13.05 90 γ-Medium 88.53 6.43 66 - - - - - - γ-High 87.88 9.29 358 - - - - - - Peak score is highest ROC-AUC scores of the cluster. Peak SD is the SD of cross-validation folds for the peak ROC-AUC score. Peak time is the time of the peak from DP.
In this issue


