

Article Figures & Data
Figures
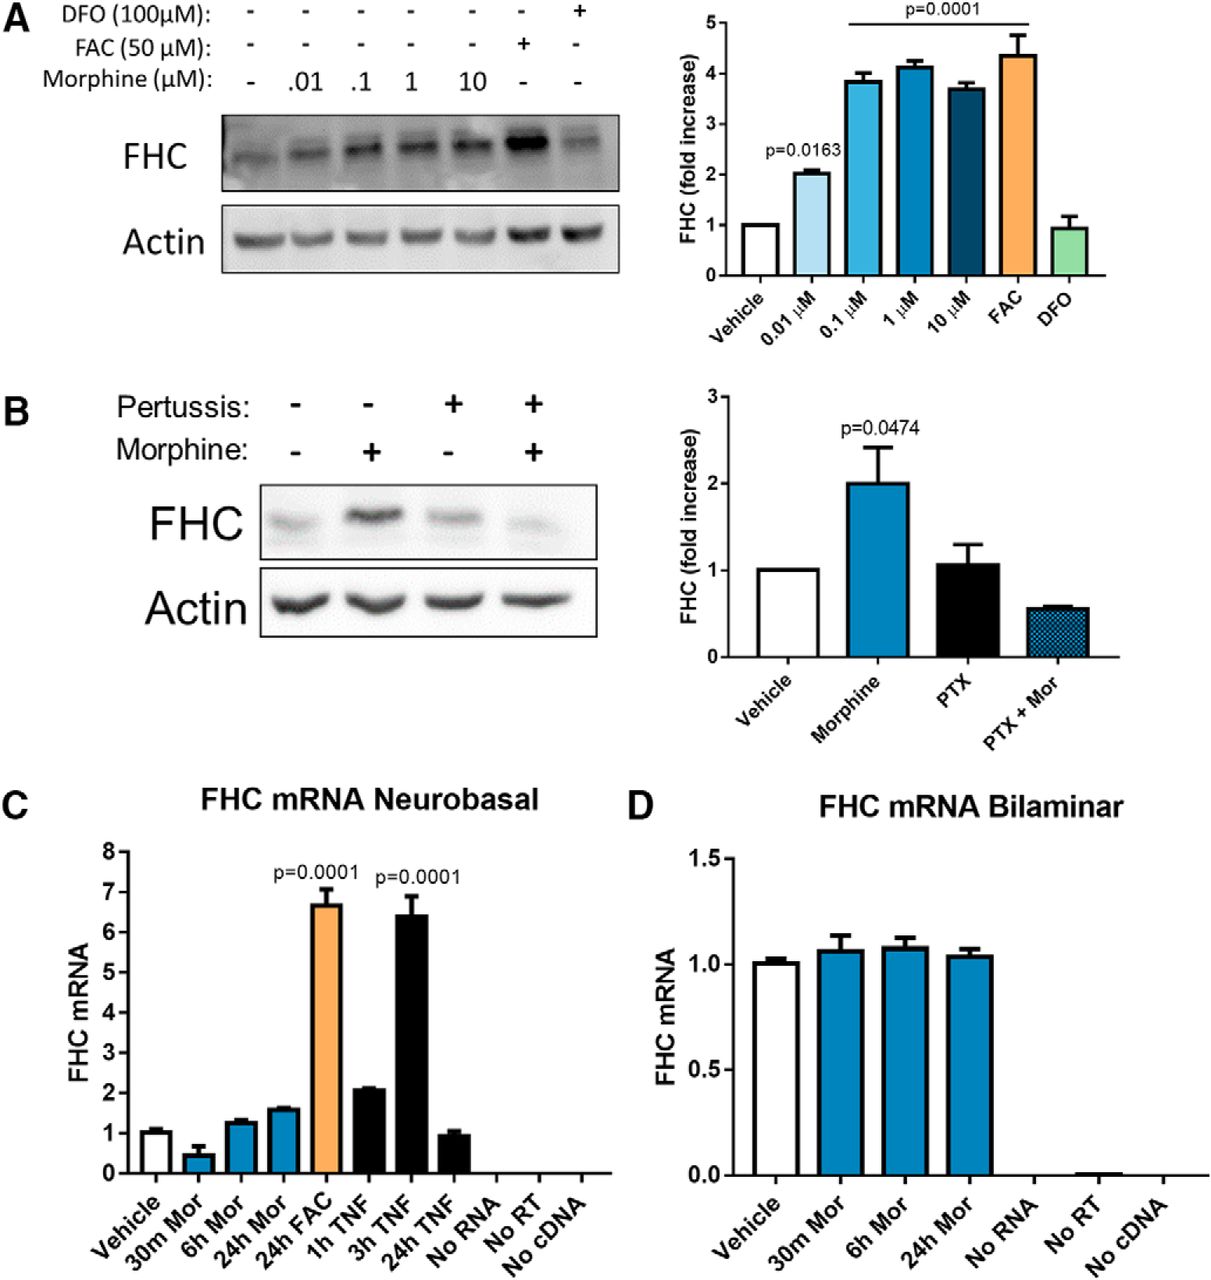
- Figure 1.
Morphine upregulates FHC protein without altering transcript levels. A, Morphine dose dependently upregulates neuronal FHC. Neurobasal cultures were treated with morphine (0.01, 0.1, 1, or 10 µM) or vehicle for 24 h. Morphine significantly increased FHC protein level at every dose, and 1 µM produced a peak effect. Positive control cultures were iron-loaded with FAC (50 µM, 24 h), and negative control cultures were iron-chelated with DFO (100 µM, 24 h). Iron loading significantly increased FHC protein levels, while iron chelation did not alter FHC protein levels, showing that neurobasal cultures could predictably respond to altered iron levels through FHC synthesis; F(6,14) = 52.697, p < 0.0001. B, Blocking Gαi signaling inhibits morphine-mediated FHC upregulation in bilaminar cultures. Cultures were pre-treated with PTX (200 ng/ml) or vehicle for 2 h, followed by addition of morphine (1 µM, 24 h). Morphine alone significantly increased FHC protein levels, but pre-treatment with PTX completely blocked FHC upregulation by morphine; F(3,8) = 6.2933, p = 0.0168. C, Morphine does not change FHC transcript expression in neurobasal cultures. Cultures were treated with morphine (1 µM) for 30 min, 6 h, or 24 h before collection of total RNA. Morphine had no effect on FHC transcript expression as assessed by qPCR. Positive control cultures either iron loaded with a high concentration of FAC (100 µM) for 24 h or treated with TNFα (10 ng/ml) for 3 h significantly upregulated FHC transcripts, showing that the cultures were capable of increasing FHC gene expression; F(7,16) = 94.711, p < 0.0001. D, Morphine does not change FHC transcript expression in bilaminar cultures. As before, cultures were treated with morphine (1 µM) for 30 min, 6 h, or 24 h before collection of total RNA. Again, morphine had no effect on neuronal FHC transcript levels, even in the presence of a glial feeder layer; N = 4 experiments, F(3,42) = 0.38357, p = 0.7654. In both C, D, FHC transcripts were quantified using the ΔΔCT method, and data are presented relative to GAPDH. All experiments analyzed by one-way ANOVA and Dunnett post hoc.
- Figure 2.
Morphine upregulates FHC protein in the neuronal cytoplasm. A, FHC is expressed in the soma and processes of morphine-treated neurons. Neurobasal cultures were treated with morphine (1 µM, 24 h) or vehicle before fixation and immunostaining. Cultures were immunostained for FHC (green) and the neuronal marker β-III Tubulin (red), and counterstained with the nuclear marker Hoechst (blue). Images were acquired with 20× and 60× objectives. Morphine treatment visibly increased FHC staining in the soma and processes. One group of neurons was immunostained without both primary antibodies, showing that non-specific staining was negligible. B, Morphine upregulates FHC in cytoplasmic extracts of neurobasal cultures. Cultures were treated with morphine (1 µM, 3, 6, or 24 h) or vehicle, and separated into cytosolic and nuclear extracts. Morphine dose dependently increased FHC protein levels in cytoplasmic extracts, and 6-h and 24-h treatments reached significance; F(3,8) = 24.28, p = 0.0002. Conversely, morphine did not significantly alter FHC expression in nuclear extracts at any time; F(3,8) = 1.644, p = 0.2549. Both experiments were analyzed by one-way ANOVA and Dunnett post hoc.
- Figure 3.
Morphine dose dependently reduces dendritic spine density and mature spine types through µOR and Gαi signaling. A, Morphine reduced several dendritic spine types in neurobasal cultures. Cultures (20 DIV) were treated with morphine (1 µM, 24 h), followed by fixation and staining with antibodies against MAP2 and with phalloidin 488 counterstain to visualize dendritic spines in MAP2-positive neurons; scale bar = 5 µm. Morphine significantly reduced overall dendritic spine density (t(16) = 9.372) and specifically reduced the density of thin, stubby, and mushroom spines. Dendritic spine density data were analyzed by two-tailed Student’s t test, while dendritic spine morphology data were analyzed by two-way ANOVA with Sidak’s multiple comparisons test (treatment F(3,64) = 151.9, p < 0.0001; morphology F(1,64) = 81.83, p < 0.0001). B, Morphine decreases dendritic spine density in a dose-dependent manner. Neurobasal cultures (20 DIV) were treated with morphine (0.01, 0.1, 1, or 10 µM) or vehicle for 24 h before fixation. As in A, treated cultures were stained with antibodies against MAP2, and counterstained with phalloidin 488 to visualize dendritic spines in MAP2-positive neurons. Morphine reduced overall dendritic spine density dose dependently, and each dose up to 1 µM reduced spine density significantly more than the previous dose; F(4,40) = 50.32, p < 0.0001. Spine morphology analysis showed the same dose-dependent reduction of thin and mushroom spines. All morphine doses significantly reduced thin spine density, while only 0.1, 1, and 10 µM morphine significantly reduced mushroom spine density; treatment F(4,160) = 42.9, p < 0.0001; spine morphology F(3,160) = 956.9, p < 0.0001. C, Morphine’s actions on dendritic spines depend on µOR and Gαi protein activation. Neurobasal cultures (20 DIV) were either treated with morphine (1 µM, 24 h) alone or pre-treated with the µOR antagonist CTAP (1 µM) or the Gαi protein inhibitor PTX (200 ng/ml) for 30 min/2 h before morphine treatment, respectively. Morphine alone significantly reduced dendritic spine density, which was blocked by cotreatment with both CTAP and PTX; F(5,42) = 15.29, p < 0.0001. Spine morphology analysis revealed a similar pattern where morphine significantly reduced thin and mushroom spine density, which was rescued by PTX and CTAP pre-treatment; treatment F(5,168) = 17.39, p < 0.0001; spine morphology F(3,168) = 1448, p < 0.0001. N = 3 experiments for all panels. Spine density data were analyzed by one-way ANOVA and Tukey post hoc, while spine morphology data were analyzed by two-way ANOVA and Tukey post hoc.
- Figure 4.
Morphine upregulates FHC and decreases mature dendritic spines in layer 2/3 neurons of the rat medial prefrontal cortex. A, Morphine upregulates FHC in cortical neurons in vivo. Three-week-old Holtzman rats were treated with extended-release morphine pellets (25 mg) or placebo for 96 h as detailed in the methods, followed by perfusion and brain tissue collection. Brain sections were stained with antibodies against FHC (green) and the neuronal marker NeuN (red), and images were acquired with a 20× objective. Images were analyzed by measuring the staining intensity of FHC in NeuN-positive areas of the layer 2/3 prelimbic cortex of the mPFC. FHC staining intensity values from individual neurons were averaged to one value per rat, represented as one dot in the graph. FHC staining was significantly higher in neurons of morphine-treated rats; N = 4 rats per treatment group. Data analyzed by Student’s t test; t(6) = 2.717. B, Morphine reduced thin and mushroom dendritic spine density in PFC neurons. A different group of three-week-old Holtzman rats treated with morphine or placebo pellets were used for dendritic spine analysis. PFC-containing tissue slices were stained with DiI to visualize dendritic spines, as shown in the micrograph; scale bar = 5 µm. Morphine decreased the overall spine density of layer 2/3 prelimbic cortex neurons (t(10) = 8.482), and specifically reduced the density of thin and mushroom spines. Stubby spines and filopodia were not significantly changed by morphine; N = 6 rats per treatment group. Spine density data were analyzed by Student’s t test, and morphology data were analyzed by two-way ANOVA with Sidak’s multiple comparisons test (treatment F(1,40) = 44.5, p < 0.0001; morphology F(3,40) = 114, p < 0.0001).
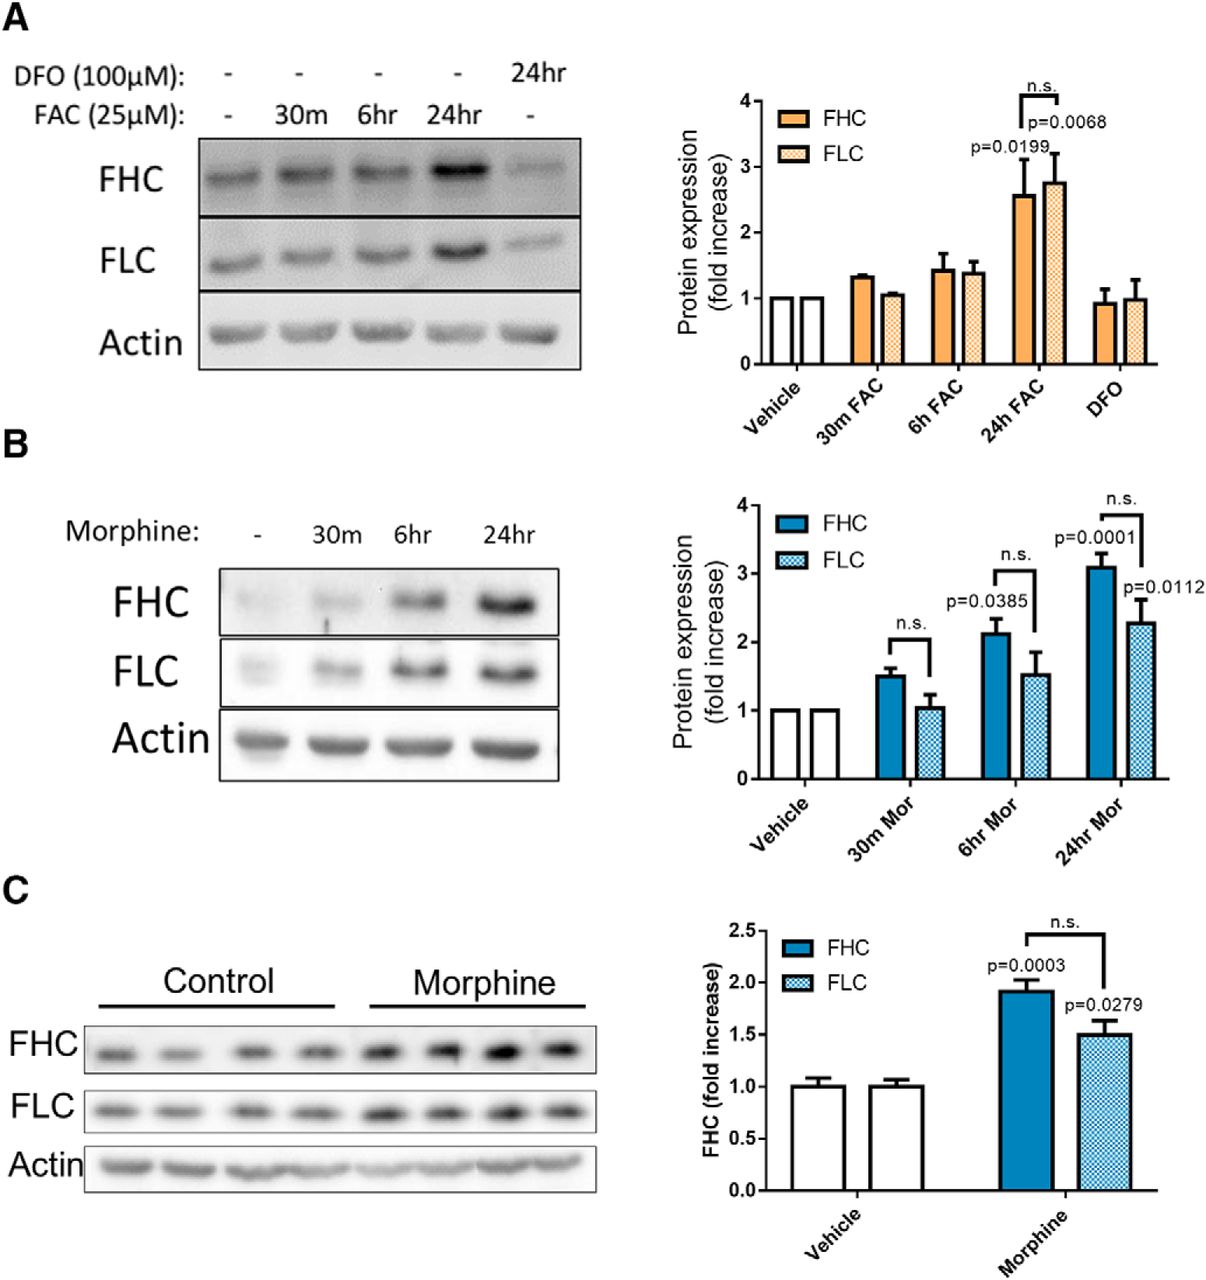
- Figure 5.
Morphine and iron upregulate FHC and FLC in cortical neurons. A, Iron-loading upregulates FHC and FLC in neurobasal cultures. Cultures were iron-loaded with FAC (25 µM) for 30 min, 6 h, or 24 h before lysis. Additionally, a negative control culture was iron-chelated with DFO (100 µM, 24 h) before lysis. Iron loading with FAC significantly increased FHC and FLC but only after 24 h. FHC and FLC expression were not significantly different at any time after treatment; N = 3 experiments; treatment F(4,20) = 12.94, p < 0.0001; FHC/FLC expression F(1,20) = 0.0029, p = 0.9576. B, Morphine upregulates FHC and FLC in neurobasal cultures. Cultures were treated with morphine (1 µM) or vehicle and lysed 30 min, 6 h, or 24 h after treatment. Morphine upregulated both FHC and FLC, but FHC was significantly upregulated at 6 h, while FLC reached significance at 24 h. However, the overall expression of FHC was not significantly different from FLC at each time point; N = 4 experiments; treatment F(3,24) = 22.94, p < 0.0001; FHC/FLC expression F(1,24) = 9.252, p = 0.0056. C, Morphine-treated rats upregulate FHC and FLC in frontal cortex tissue. Three-week-old Holtzman rats were treated with extended-release morphine or placebo pellets for 96 h as described in Figure 4 and the Materials and Methods. After the treatment, rats were killed and frontal cortex tissue was dissected, homogenized, and analyzed by Western blotting. Morphine significantly increased FHC and FLC expression in vivo, similarly to the in vitro experiment in panel B; N = 4 rats per treatment group; each column contains a homogenate from a different rat; treatment F(1,12) = 43.94, p < 0.0001; FHC/FLC expression F(1,12) = 3.814, p = 0.0745. All data were analyzed by two-way ANOVA and Tukey post hoc.
- Figure 6.
Morphine induces endolysosomal iron efflux to the cytoplasm. Visualization (A) and quantification (B) of endolysosomal iron levels in morphine-treated cortical neurons. Neurobasal cultures were transfected with LAMP1-GFP to visualize endolysosomes and loaded with the endolysosome/Golgi localized iron sensor FeRhoNox-1 (10 µM, 1 h). FeRhoNox-1 fluorescence, which is increased by iron, was measured from LAMP1-GFP-positive areas. Morphine reduced endolysosomal iron levels dose dependently, achieving statistical significance at all doses from 1 to 100 µM; F(4,8) = 112, p < 0.0001. Visualization (C) and quantification (D) of cytosolic iron levels in morphine-treated cortical neurons. A different group of neurons was transfected with LAMP1-RFP and loaded with the cytoplasmically localized iron sensor phen green SK (1 µM, 30 min). Phen green fluorescence, which is quenched by iron, was measured outside of LAMP1-RFP-positive areas. Morphine increased cytosolic iron levels dose dependently, and statistical significance was achieved at all doses from 1 to 100 µM in direct agreement with endolysosomal iron studies; F(4,13) = 47.98, p < 0.0001. E, Morphine dose dependently de-acidifies cortical neuron endolysosomes. Neurobasal cultures were transfected with LAMP1-GFP to visualize lysosomes and loaded with pH-sensitive pHrodo dextran and pH-insensitive Alexa Fluor 647 dextran the night before drug treatments. Endolysosomal pH was calculated from the ratio of dextran emission in LAMP1-GFP-positive areas. Morphine treatment (0.1–10 µM, 30 min) increased endolysosome pH dose dependently (shown in top graph), reaching statistical significance at 1 and 10 µM doses; F(3,8) = 180.2, p < 0.0001. Additionally, naloxone (50 µM) cotreatment with morphine (10 µM, 30 min) completely blocked morphine’s actions on endolysosomal pH, while naloxone alone had no effect on endolysosomal pH (shown in bottom graph); F(3,8) = 127.2, p < 0.0001. All cortical neuron data were analyzed by one-way ANOVA and Dunnett post hoc. Iron visualization (F) and quantification (G) in morphine-treated hippocampal neurons. Hippocampal neurons were labeled with LysoTracker and FeRhoNox-1 to visualize endolysosomal iron, as shown in the micrograph. Morphine treatment (10 µM, 30 min) significantly reduced endolysosomal iron levels (t(4) = 7.036), and increased cytoplasmic iron levels as measured by phen green SK (t(4) = 16.86). Data analyzed by Student’s t test. H, Iron quantification in morphine-treated U87MG cells. Endolysosomal and cytoplasmic iron levels in U87MG cells were measured with the same approach used for hippocampal neurons. Morphine (10 µM, 30 min) significantly reduced endolysosomal iron levels, which was blocked by cotreatment with naloxone (50 µM); F(3,8) = 541.2, p < 0.0001. The same morphine treatment significantly increased cytoplasmic iron levels as measured by phen green SK, which was blocked by chelating endolysosomal iron with DFO (100 µM); F(3,8) = 26.27, p = 0.0002. I, Morphine de-acidifies endolysosomes in U87MG cells. U87MG cells were loaded with the ratiometric pH sensor Lysosensor DND-160 (1 µM, 30 min) before treatments. Morphine (10 µM, 30 min) significantly increased endolysosomal pH, which was blocked by cotreatment with naloxone; F(3,8) = 45.05, p < 0.0001. U87MG data analyzed by one-way ANOVA with Tukey post hoc.
- Figure 7.
Endolysosomal iron is required for morphine-mediated FHC upregulation and reduction of mature types of dendritic spines. A, Morphine increases cytoplasmic labile iron levels over 24 h in cultured neurons. Neurobasal cultures were treated with morphine (1 µM) for 30 min, 3, 6, or 24 h before loading with the cytoplasmically localized fluorescent iron sensor calcein-AM (200 nM, 30 min). Morphine treatment significantly increased cytoplasmic iron from 30 min to at least 24 h. Negative control cultures pre-treated with the iron chelator phenanthroline (10 µM, 30 min) blocked morphine's ability to increase iron levels. Positive control cultures loaded with FAC (100 µM, 24 h) significantly increased neuronal iron levels, as expected; F(8,18) = 166.5, p < 0.0001. B, Chelation of endolysosomal iron blocks morphine-mediated FHC upregulation. Neuronal cultures were treated with the extracellular and endolysosomal iron chelator DFO (100 µM), the cell-impermeable iron chelator DTPA (100 µM), or vehicle in combination with morphine (1 µM) and lysed 24 h later. Morphine alone significantly upregulated FHC, but DFO blocked morphine-mediated FHC upregulation. The extracellular iron chelator DTPA had no effect on morphine-mediated FHC upregulation, indicating that only intracellular iron is required for this pathway; F(5,14) = 13.72, p < 0.0001. Data in A, B were analyzed by one-way ANOVA and Dunnett post hoc. C, Morphine-mediated reduction of mature dendritic spines requires endolysosomal iron. Neuronal cultures (20 DIV) were treated with morphine and various iron modulators for 24 h, followed by analysis of dendritic spine density and morphology. Morphine (1 µM) and FAC (50 µM) both significantly reduced overall dendritic spine density by the same amount. Morphine’s ability to reduce dendritic spine density was blocked by chelation of endolysosomal iron with DFO, but not affected by extracellular iron chelation with DTPA, demonstrating the importance of endolysosomal iron for this pathway; F(6,56) = 24.21, p < 0.0001. Spine morphology analysis showed that morphine and FAC significantly reduced thin and mushroom spines, and this effect was similarly blocked by DFO, but not DTPA; treatment F(6,224) = 31.61, p < 0.0001; spine morphology F(3,224) = 1991, p < 0.0001. Spine density data were analyzed by one-way ANOVA and Tukey post hoc, while spine morphology data were analyzed by two-way ANOVA and Tukey post hoc. N = 3 experiments for all panels.
- Figure 8.
Working model of opioid regulation of FHC. Morphine-mediated activation of the µOR Gαi-protein pathway resulted in endolysosomal iron flux to the cytoplasm and a corresponding de-acidification of endolysosomes. This may be caused by µOR activation of two-pore channels (TPC), TRPML1, or DMT-1. Increased labile iron levels in the cytoplasm results in neurons producing additional FHC protein without altering FHC transcript levels. As FHC translation is controlled by IRPs that bind to FHC transcripts and prevent translation in low-iron conditions, endolysosomal iron flux may release IRPs from FHC transcripts, allowing FHC translation. FHC protein then directly interacts with the CXCR4 signaling complex and inhibits its homeostatic signaling pathways. Notably, this results in reduced dendritic spine density and reduced resilience to excitotoxicity. This pathway may be implicated in HAND with comorbid opioid use, as well as other neurologic disorders where neuronal iron levels are pathologically altered.


Tables
Figures Data structure Type of test Statistical information Figure 1A Normal distribution One-way ANOVA F(6,14) = 52.697, p < 0.0001 Vehicle vs 0.01 μM Dunnett's multiple comparisons test CI: –1.8649 to –0.17292 Vehicle vs 0.1 μM Dunnett's multiple comparisons test CI: –3.6802 to –1.9882 Vehicle vs 1 μM Dunnett's multiple comparisons test CI: –3.9667 to –2.2748 Vehicle vs 10 μM Dunnett's multiple comparisons test CI: –3.5352 to –1.8432 Vehicle vs FAC Dunnett's multiple comparisons test CI: –4.198 to –2.5061 Vehicle vs DFO Dunnett's multiple comparisons test CI: –0.77749 to 0.91446 Figure 1B Normal distribution One-way ANOVA F(3,8) = 6.2933, p = 0.0168 Vehicle vs morphine Dunnett's multiple comparisons test CI: –1.9825 to –0.01226 Vehicle vs PTX Dunnett's multiple comparisons test CI: –1.0416 to 0.92856 Vehicle vs PTX + Mor Dunnett's multiple comparisons test CI: –0.53893 to 1.4313 Figure 1C Normal distribution One-way ANOVA F(7,16) = 94.711, p < 0.0001 Vehicle vs 30 m Mor Dunnett's multiple comparisons test CI: –0.49618 to 1.6318 Vehicle vs 6 h Mor Dunnett's multiple comparisons test CI: –1.2963 to 0.8317 Vehicle vs 24 h Mor Dunnett's multiple comparisons test CI: –1.6376 to 0.49035 Vehicle vs 24 h FAC Dunnett's multiple comparisons test CI: –6.7161 to –4.5881 Vehicle vs 1 h TNF Dunnett's multiple comparisons test CI: –2.109 to 0.019 Vehicle vs 3 h TNF Dunnett's multiple comparisons test CI: –6.4336 to –4.3057 Vehicle vs 24 h TNF Dunnett's multiple comparisons test CI: –0.98676 to 1.1412 Figure 1D Normal distribution One-way ANOVA F(3,42) = 0.38357, p = 0.7654 Vehicle vs 30 m Mor Dunnett's multiple comparisons test CI: –0.23702 to 0.11747 Vehicle vs 6 h Mor Dunnett's multiple comparisons test CI: –0.24894 to 0.10556 Vehicle vs 24 h Mor Dunnett's multiple comparisons test CI: –0.21279 to 0.14933 Figure 2B, cytoplasmic Normal distribution One-way ANOVA F(3,8) = 24.28, p = 0.0002 Vehicle vs 3 h Mor Dunnett's multiple comparisons test CI: –1.002 to 0.4371 Vehicle vs 6 h Mor Dunnett's multiple comparisons test CI: –1.629 to –0.1897 Vehicle vs 24 h Mor Dunnett's multiple comparisons test CI: –2.684 to –1.245 Figure 2B, nuclear Normal distribution One-way ANOVA F(3,8) = 1.644, p = 0.2549 Vehicle vs 3 h Mor Dunnett's multiple comparisons test CI: –0.6596 to 0.767 Vehicle vs 6 h Mor Dunnett's multiple comparisons test CI: –0.7541 to 0.6725 Vehicle vs 24 h Mor Dunnett's multiple comparisons test CI: –1.151 to 0.2751 Figure 3A, spine density Normal distribution Two-tailed, unpaired t test t(16) = 9.372, CI: –2.825 to –1.783 Figure 3A, spine morphology Normal distribution Two-way ANOVA Interaction F(3,64) = 13.9, p < 0.0001Treatment F(3,64) = 151.9, p < 0.0001Morphology F(1,64) = 81.83, p < 0.0001 Vehicle, morphine Thin Sidak's multiple comparisons test CI: 0.7779 to 1.428 Stubby Sidak's multiple comparisons test CI: 0.007506 to 0.6573 Mushroom Sidak's multiple comparisons test CI: 0.4853 to 1.135 Filopodia Sidak's multiple comparisons test CI: –0.2768 to 0.373 Figure 3B, spine density Normal distribution One-way ANOVA F(4,40) = 50.32, p < 0.0001 Vehicle vs 0.01 μM Tukey's multiple comparisons test CI: 0.0951 to 1.616 Vehicle vs 0.1 μM Tukey's multiple comparisons test CI: 1.048 to 2.569 Vehicle vs 1 μM Tukey's multiple comparisons test CI: 2.003 to 3.524 Vehicle vs 10 μM Tukey's multiple comparisons test CI: 2.487 to 4.008 0.01 vs 0.1 μM Tukey's multiple comparisons test CI: 0.1923 to 1.713 0.1 vs 1 μM Tukey's multiple comparisons test CI: 0.1951 to 1.716 1 vs 10 μM Tukey's multiple comparisons test CI: –0.2771 to 1.244 Figure 3B, spine morphology Normal distribution Two-way ANOVA Interaction F(12,160) = 21.58, p < 0.0001Morphology F(3,160) = 956.9, p < 0.0001Treatment F(4,160) = 42.9, p < 0.0001 Filopodia Vehicle vs 0.01 μM Tukey's multiple comparisons test CI: –0.4073 to 0.3795 Vehicle vs 0.1 μM Tukey's multiple comparisons test CI: –0.1906 to 0.5962 Vehicle vs 1 μM Tukey's multiple comparisons test CI: –0.3156 to 0.4712 Vehicle vs 10 μM Tukey's multiple comparisons test CI: –0.2767 to 0.5101 Mushroom Vehicle vs 0.01 μM Tukey's multiple comparisons test CI: –0.1934 to 0.5934 Vehicle vs 0.1 μM Tukey's multiple comparisons test CI: 0.006604 to 0.7934 Vehicle vs 1 μM Tukey's multiple comparisons test CI: 0.08438 to 0.8712 Vehicle vs 10 μM Tukey's multiple comparisons test CI: 0.1983 to 0.9851 Stubby Vehicle vs 0.01 μM Tukey's multiple comparisons test CI: –0.3934 to 0.3934 Vehicle vs 0.1 μM Tukey's multiple comparisons test CI: –0.4378 to 0.349 Vehicle vs 1 μM Tukey's multiple comparisons test CI: –0.3434 to 0.4434 Vehicle vs 10 μM Tukey's multiple comparisons test CI: –0.3295 to 0.4573 Thin Vehicle vs 0.01 μM Tukey's multiple comparisons test CI: 0.4372 to 1.224 Vehicle vs 0.1 μM Tukey's multiple comparisons test CI: 0.803 to 1.59 Vehicle vs 1 μM Tukey's multiple comparisons test CI: 1.77 to 2.557 Vehicle vs 10 μM Tukey's multiple comparisons test CI: 2.114 to 2.9 0.01 vs 0.1 μM Tukey's multiple comparisons test CI: –0.02756 to 0.7592 0.1 vs 1 μM Tukey's multiple comparisons test CI: 0.5741 to 1.361 1 vs 10 μM Tukey's multiple comparisons test CI: –0.05034 to 0.7365 Figure 3C, spine density Normal distribution One-way ANOVA F(5,42) = 15.29, p < 0.0001 Vehicle vs morphine Tukey's multiple comparisons test CI: 1.608 to 3.41 Vehicle vs PTX Tukey's multiple comparisons test CI: 0.0146 to 1.817 Vehicle vs PTX + Mor Tukey's multiple comparisons test CI: –0.3166 to 1.485 Vehicle vs CTAP Tukey's multiple comparisons test CI: 0.2709 to 2.073 Vehicle vs CTAP + Mor Tukey's multiple comparisons test CI: 0.09273 to 1.895 PTX vs PTX + Mor Tukey's multiple comparisons test CI: –1.232 to 0.5698 CTAP vs CTAP + Mor Tukey's multiple comparisons test CI: –1.079 to 0.7229 Figure 3C, spine morphology Normal distribution Two-way ANOVA Interaction F(15,168) = 9.193, p < 0.0001Morphology F(3,168) = 1448, p < 0.0001Treatment F(5,168) = 17.39, p < 0.0001 Filopodia Vehicle vs morphine Tukey's multiple comparisons test CI: –0.3425 to 0.4612 Vehicle vs PTX Tukey's multiple comparisons test CI: –0.3894 to 0.4144 Vehicle vs PTX + Mor Tukey's multiple comparisons test CI: –0.4519 to 0.3519 Vehicle vs CTAP Tukey's multiple comparisons test CI: –0.3675 to 0.4362 Vehicle vs CTAP + Mor Tukey's multiple comparisons test CI: –0.3487 to 0.455 Mushroom Vehicle vs morphine Tukey's multiple comparisons test CI: 0.1544 to 0.9581 Vehicle vs PTX Tukey's multiple comparisons test CI: –0.2019 to 0.6019 Vehicle vs PTX + Mor Tukey's multiple comparisons test CI: –0.2956 to 0.5081 Vehicle vs CTAP Tukey's multiple comparisons test CI: –0.08937 to 0.7144 Vehicle vs CTAP + Mor Tukey's multiple comparisons test CI: –0.1081 to 0.6956 PTX vs PTX + Mor Tukey's multiple comparisons test CI: –0.4956 to 0.3081 CTAP vs CTAP + Mor Tukey's multiple comparisons test CI: –0.4206 to 0.3831 Stubby Vehicle vs morphine Tukey's multiple comparisons test CI: –0.4644 to 0.3394 Vehicle vs PTX Tukey's multiple comparisons test CI: –0.5612 to 0.2425 Vehicle vs PTX + Mor Tukey's multiple comparisons test CI: –0.4206 to 0.3831 Vehicle vs CTAP Tukey's multiple comparisons test CI: –0.4144 to 0.3894 Vehicle vs CTAP + Mor Tukey's multiple comparisons test CI: –0.38 to 0.4237 Thin Vehicle vs morphine Tukey's multiple comparisons test CI: 1.404 to 2.208 Vehicle vs PTX Tukey's multiple comparisons test CI: 0.1481 to 0.9519 Vehicle vs PTX + Mor Tukey's multiple comparisons test CI: –0.03 to 0.7737 Vehicle vs CTAP Tukey's multiple comparisons test CI: 0.4544 to 1.258 Vehicle vs CTAP + Mor Tukey's multiple comparisons test CI: –0.03625 to 0.7675 PTX vs PTX + Mor Tukey's multiple comparisons test CI: –0.58 to 0.2237 CTAP vs CTAP + Mor Tukey's multiple comparisons test CI: –0.8925 to –0.08875 Figure 4A Normal distribution Two-tailed, unpaired t test t(6) = 2.717, CI: 0.6332 to 12.11 Figure 4B, spine density Normal distribution Two-tailed, unpaired t test t(10) = 8.482, CI: –7.026 to –4.103 Figure 4B, spine morphology Normal distribution Two-way ANOVA Interaction F(3,40) = 7.579, p = 0.0004Morphology F(3,40) = 114, p < 0.0001Treatment F(1,40) = 44.5, p < 0.0001 Vehicle, morphine Thin Sidak's multiple comparisons test CI: 1.922 to 4.195 Stubby Sidak's multiple comparisons test CI: –0.2348 to 2.038 Mushroom Sidak's multiple comparisons test CI: 0.4543 to 2.727 Filopodia Sidak's multiple comparisons test CI: –0.8738 to 1.399 Figure 5A Normal distribution Two-way ANOVA Interaction F(4,20) = 0.1919, p = 0.9398Treatment F(4,20) = 12.94, p < 0.0001Expression F(1,20) = 0.002895, p = 0.9576 Vehicle:FHC vs 30 m FAC:FHC Tukey's multiple comparisons test CI: –1.704 to 1.063 Vehicle:FHC vs 6 h FAC:FHC Tukey's multiple comparisons test CI: –1.8 to 0.9668 Vehicle:FHC vs 24 h FAC:FHC Tukey's multiple comparisons test CI: –2.94 to –0.1729 Vehicle:FHC vs DFO:FHC Tukey's multiple comparisons test CI: –1.299 to 1.468 Vehicle:FLC vs 30 m FAC:FLC Tukey's multiple comparisons test CI: –1.433 to 1.334 Vehicle:FLC vs 6 h FAC:FLC Tukey's multiple comparisons test CI: –1.762 to 1.005 Vehicle:FLC vs 24 h FAC:FLC Tukey's multiple comparisons test CI: –3.136 to –0.3684 Vehicle:FLC vs DFO:FLC Tukey's multiple comparisons test CI: –1.365 to 1.402 24 h FAC:FHC vs 24 h FAC:FLC Tukey's multiple comparisons test CI: –1.579 to 1.188 Figure 5B Normal distribution Two-way ANOVA Interaction F(3,24) = 1.244, p = 0.3157Treatment F(3,24) = 22.94, p < 0.0001Expression F(1,24) = 9.252, p = 0.0056 Vehicle:FHC vs 30 m Mor:FHC Sidak's multiple comparisons test CI: –1.581 to 0.5878 Vehicle:FHC vs 6 h Mor:FHC Sidak's multiple comparisons test CI: –2.202 to –0.03317 Vehicle:FHC vs 24 h Mor:FHC Sidak's multiple comparisons test CI: –3.17 to –1.001 Vehicle:FLC vs 30 m Mor:FLC Sidak's multiple comparisons test CI: –1.118 to 1.051 Vehicle:FLC vs 6 h Mor:FLC Sidak's multiple comparisons test CI: –1.596 to 0.5731 Vehicle:FLC vs 24 h Mor:FLC Sidak's multiple comparisons test CI: –2.356 to –0.1869 30 m Mor:FHC vs 30 m Mor:FLC Sidak's multiple comparisons test CI: –0.6212 to 1.548 6 h Mor:FHC vs 6 h Mor:FLC Sidak's multiple comparisons test CI: –0.4783 to 1.691 24 h Mor:FHC vs 24 h Mor:FLC Sidak's multiple comparisons test CI: –0.2706 to 1.899 Figure 5C Normal distribution Two-way ANOVA Interaction F(1,12) = 3.823, p = 0.0742Treatment F(1,12) = 43.94, p < 0.0001Expression F(1,12) = 3.814, p = 0.0745 Vehicle:FHC vs morphine:FHC Tukey's multiple comparisons test CI: –1.358 to –0.4659 Vehicle:FLC vs morphine:FHC Tukey's multiple comparisons test CI: –1.358 to –0.4657 Morphine:FHC vs morphine:FLC Tukey's multiple comparisons test CI: –0.03085 to 0.8613 Figure 6B Normal distribution One-way ANOVA F(4,8) = 112, p < 0.0001 Vehicle vs 0.1 μM Dunnett's multiple comparisons test CI: –1.472 to 2.722 Vehicle vs 1 μM Dunnett's multiple comparisons test CI: 1.293 to 5.487 Vehicle vs 10 μM Dunnett's multiple comparisons test CI: 8.804 to 13.49 Vehicle vs 100 μM Dunnett's multiple comparisons test CI: 10.07 to 14.76 Figure 6D Normal distribution One-way ANOVA F(4,13) = 47.98, p < 0.0001 Vehicle vs 0.1 μM Dunnett's multiple comparisons test CI: –26.25 to 4.68 Vehicle vs 1 μM Dunnett's multiple comparisons test CI: –34.28 to –6.624 Vehicle vs 10 μM Dunnett's multiple comparisons test CI: –60.4 to –35.66 Vehicle vs 100 μM Dunnett's multiple comparisons test CI: –61.63 to –36.89 Figure 6E, top Normal distribution One-way ANOVA F(3,8) = 180.2, p < 0.0001 Vehicle vs 0.1 μM Dunnett's multiple comparisons test CI: –0.2068 to 0.0702 Vehicle vs 1 μM Dunnett's multiple comparisons test CI: –0.6368 to –0.3598 Vehicle vs 10 μM Dunnett's multiple comparisons test CI: –1.127 to –0.8498 Figure 6E, bottom Normal distribution One-way ANOVA F(3,8) = 127.2, p < 0.0001 Vehicle vs morphine Dunnett's multiple comparisons test CI: –1.17 to –0.8066 Vehicle vs naloxone Dunnett's multiple comparisons test CI: –0.11 to 0.2534 Vehicle vs Nal + Mor Dunnett's multiple comparisons test CI: –0.21 to 0.1534 Figure 6G, EL Normal distribution Two-tailed, unpaired t test t(4) = 7.036, CI: –27.35 to –11.87 Figure 6G, cytosol Normal distribution Two-tailed, unpaired t test t(4) = 16.86, CI: 11.13 to 15.52 Figure 6H, EL Normal distribution One-way ANOVA F(3,8) = 541.2, p < 0.0001 Vehicle vs morphine Tukey's multiple comparisons test CI: 30.67 to 36.88 Vehicle vs naloxone Tukey's multiple comparisons test CI: –2.663 to 3.55 Vehicle vs Nal + Mor Tukey's multiple comparisons test CI: 4.1 to 10.31 Morphine vs Nal + Mor Tukey's multiple comparisons test CI: –29.68 to –23.46 Figure 6H, cytosol Normal distribution One-way ANOVA F(3,8) = 26.27, p = 0.0002 Vehicle vs morphine Tukey's multiple comparisons test CI: –14.9 to –5.351 Vehicle vs DFO Tukey's multiple comparisons test CI: –4.623 to 4.929 Vehicle vs DFO + Mor Tukey's multiple comparisons test CI: –3.169 to 6.383 Morphine vs DFO + Mor Tukey's multiple comparisons test CI: 6.957 to 16.51 Figure 6I Normal distribution One-way ANOVA F(3,8) = 45.05, p < 0.0001 Vehicle vs morphine Tukey's multiple comparisons test CI: –0.249 to –0.131 Vehicle vs naloxone Tukey's multiple comparisons test CI: –0.06895 to 0.04895 Vehicle vs Nal + Mor Tukey's multiple comparisons test CI: –0.119 to –0.001048 Morphine vs Nal + Mor Tukey's multiple comparisons test CI: 0.07105 to 0.189 Figure 7A Normal distribution One-way ANOVA F(7,16) = 87.91, p < 0.0001 Vehicle vs 30 m Mor Dunnett's multiple comparisons test CI: –678.2 to –19.94 Vehicle vs 3 h Mor Dunnett's multiple comparisons test CI: –1010 to –351.8 Vehicle vs 6 h Mor Dunnett's multiple comparisons test CI: –1033 to –374.9 Vehicle vs 24 h Mor Dunnett's multiple comparisons test CI: –741.5 to –83.21 Vehicle vs Phen Dunnett's multiple comparisons test CI: –27.91 to 630.4 Vehicle vs Phen + 24 h Mor Dunnett's multiple comparisons test CI: –208.3 to 449.9 Vehicle vs FAC Dunnett's multiple comparisons test CI: –2417 to –1759 Figure 7B Normal distribution One-way ANOVA F(5,14) = 13.72, p < 0.0001 Vehicle vs morphine Dunnett's multiple comparisons test CI: –0.954 to –0.06 Vehicle vs DFO Dunnett's multiple comparisons test CI: –0.06606 to 0.8279 Vehicle vs Mor + DFO Dunnett's multiple comparisons test CI: –0.009428 to 0.8182 Vehicle vs DTPA Dunnett's multiple comparisons test CI: –0.1879 to 0.7061 Vehicle vs Mor + DTPA Dunnett's multiple comparisons test CI: –0.9824 to –0.08839 Figure 7C, spine density Normal distribution One-way ANOVA F(6,56) = 24.21, p < 0.0001 Vehicle vs morphine Tukey's multiple comparisons test CI: 1.869 to 3.642 Vehicle vs FAC Tukey's multiple comparisons test CI: 1.494 to 3.267 Vehicle vs DFO Tukey's multiple comparisons test CI: 0.1525 to 1.925 Vehicle vs DFO + Mor Tukey's multiple comparisons test CI: 0.1108 to 1.884 Vehicle vs DTPA Tukey's multiple comparisons test CI: –0.3058 to 1.467 Vehicle vs DTPA + Mor Tukey's multiple comparisons test CI: 1.13 to 2.903 Morphine vs FAC Tukey's multiple comparisons test CI: –1.261 to 0.5114 DFO vs DFO + Mor Tukey's multiple comparisons test CI: –0.928 to 0.8447 DTPA vs DTPA + Mor Tukey's multiple comparisons test CI: 0.5497 to 2.322 Figure 7C, spine morphology Normal distribution Two-way ANOVA Interaction F(18,224) = 17.58Morphology F(3,224) = 1991, p < 0.0001Treatment F(6,224) = 31.61, p < 0.0001 Filopodia Vehicle vs morphine Tukey's multiple comparisons test CI: –0.254 to 0.504 Vehicle vs FAC Tukey's multiple comparisons test CI: –0.2623 to 0.4956 Vehicle vs DFO Tukey's multiple comparisons test CI: –0.2984 to 0.4595 Vehicle vs DFO + Mor Tukey's multiple comparisons test CI: –0.3355 to 0.4225 Vehicle vs DTPA Tukey's multiple comparisons test CI: –0.2568 to 0.5012 Vehicle vs DTPA + Mor Tukey's multiple comparisons test CI: –0.2512 to 0.5068 Mushroom Vehicle vs morphine Tukey's multiple comparisons test CI: 0.1044 to 0.8623 Vehicle vs FAC Tukey's multiple comparisons test CI: 0.07103 to 0.829 Vehicle vs DFO Tukey's multiple comparisons test CI: –0.1206 to 0.6373 Vehicle vs DFO + Mor Tukey's multiple comparisons test CI: –0.05953 to 0.6984 Vehicle vs DTPA Tukey's multiple comparisons test CI: –0.2068 to 0.5512 Vehicle vs DTPA + Mor Tukey's multiple comparisons test CI: 0.03769 to 0.7956 Morphine vs FAC Tukey's multiple comparisons test CI: –0.4123 to 0.3456 DFO vs DFO + Mor Tukey's multiple comparisons test CI: –0.3179 to 0.4401 DTPA vs DTPA + Mor Tukey's multiple comparisons test CI: –0.1345 to 0.6234 Stubby Vehicle vs morphine Tukey's multiple comparisons test CI: –0.3845 to 0.3734 Vehicle vs FAC Tukey's multiple comparisons test CI: –0.3706 to 0.3873 Vehicle vs DFO Tukey's multiple comparisons test CI: –0.4429 to 0.3151 Vehicle vs DFO + Mor Tukey's multiple comparisons test CI: –0.3956 to 0.3623 Vehicle vs DTPA Tukey's multiple comparisons test CI: –0.3956 to 0.3623 Vehicle vs DTPA + Mor Tukey's multiple comparisons test CI: –0.3929 to 0.3651 Thin Vehicle vs morphine Tukey's multiple comparisons test CI: 1.788 to 2.546 Vehicle vs FAC Tukey's multiple comparisons test CI: 1.457 to 2.215 Vehicle vs DFO Tukey's multiple comparisons test CI: 0.4081 to 1.166 Vehicle vs DFO + Mor Tukey's multiple comparisons test CI: 0.3432 to 1.101 Vehicle vs DTPA Tukey's multiple comparisons test CI: –0.07897 to 0.679 Vehicle vs DTPA + Mor Tukey's multiple comparisons test CI: 1.121 to 1.879 Morphine vs FAC Tukey's multiple comparisons test CI: –0.7095 to 0.04842 DFO vs DFO + Mor Tukey's multiple comparisons test CI: –0.4438 to 0.3142 DTPA vs DTPA + Mor Tukey's multiple comparisons test CI: 0.821 to 1.579
In this issue


