
Main menu

  • HOME
  • CONTENT
    • Early Release
    • Featured
    • Current Issue
    • Issue Archive
    • Blog
    • Collections
    • Podcast
  • TOPICS
    • Cognition and Behavior
    • Development
    • Disorders of the Nervous System
    • History, Teaching and Public Awareness
    • Integrative Systems
    • Neuronal Excitability
    • Novel Tools and Methods
    • Sensory and Motor Systems
  • ALERTS
  • FOR AUTHORS
  • ABOUT
    • Overview
    • Editorial Board
    • For the Media
    • Privacy Policy
    • Contact Us
    • Feedback
  • SUBMIT

User menu

Search

  • Advanced search
eNeuro
eNeuro

Advanced Search


  • HOME
  • CONTENT
    • Early Release
    • Featured
    • Current Issue
    • Issue Archive
    • Blog
    • Collections
    • Podcast
  • TOPICS
    • Cognition and Behavior
    • Development
    • Disorders of the Nervous System
    • History, Teaching and Public Awareness
    • Integrative Systems
    • Neuronal Excitability
    • Novel Tools and Methods
    • Sensory and Motor Systems
  • ALERTS
  • FOR AUTHORS
  • ABOUT
    • Overview
    • Editorial Board
    • For the Media
    • Privacy Policy
    • Contact Us
    • Feedback
  • SUBMIT
PreviousNext
Research ArticleNew Research, Cognition and Behavior

Visual Motion and Form Integration in the Behaving Ferret

Erika Dunn-Weiss, Samuel U. Nummela, Augusto A. Lempel, Jody M. Law, Johanna Ledley, Peter Salvino and Kristina J. Nielsen
eNeuro 1 August 2019, 6 (4) ENEURO.0228-19.2019; https://doi.org/10.1523/ENEURO.0228-19.2019
Erika Dunn-Weiss
1Solomon H. Snyder Department of Neuroscience, Johns Hopkins University School of Medicine, Baltimore, MD 21205
2Zanvyl Krieger Mind/Brain Institute, Johns Hopkins University, Baltimore, MD 21218
  • Find this author on Google Scholar
  • Find this author on PubMed
  • Search for this author on this site
Samuel U. Nummela
1Solomon H. Snyder Department of Neuroscience, Johns Hopkins University School of Medicine, Baltimore, MD 21205
2Zanvyl Krieger Mind/Brain Institute, Johns Hopkins University, Baltimore, MD 21218
  • Find this author on Google Scholar
  • Find this author on PubMed
  • Search for this author on this site
  • ORCID record for Samuel U. Nummela
Augusto A. Lempel
1Solomon H. Snyder Department of Neuroscience, Johns Hopkins University School of Medicine, Baltimore, MD 21205
2Zanvyl Krieger Mind/Brain Institute, Johns Hopkins University, Baltimore, MD 21218
  • Find this author on Google Scholar
  • Find this author on PubMed
  • Search for this author on this site
Jody M. Law
2Zanvyl Krieger Mind/Brain Institute, Johns Hopkins University, Baltimore, MD 21218
  • Find this author on Google Scholar
  • Find this author on PubMed
  • Search for this author on this site
Johanna Ledley
2Zanvyl Krieger Mind/Brain Institute, Johns Hopkins University, Baltimore, MD 21218
  • Find this author on Google Scholar
  • Find this author on PubMed
  • Search for this author on this site
Peter Salvino
2Zanvyl Krieger Mind/Brain Institute, Johns Hopkins University, Baltimore, MD 21218
  • Find this author on Google Scholar
  • Find this author on PubMed
  • Search for this author on this site
Kristina J. Nielsen
1Solomon H. Snyder Department of Neuroscience, Johns Hopkins University School of Medicine, Baltimore, MD 21205
2Zanvyl Krieger Mind/Brain Institute, Johns Hopkins University, Baltimore, MD 21218
  • Find this author on Google Scholar
  • Find this author on PubMed
  • Search for this author on this site
  • ORCID record for Kristina J. Nielsen
  • Article
  • Figures & Data
  • Info & Metrics
  • eLetters
  • PDF
Loading

Article Figures & Data

Figures

  • Tables
  • Figure 1.
    • Download figure
    • Open in new tab
    • Download powerpoint
    Figure 1.

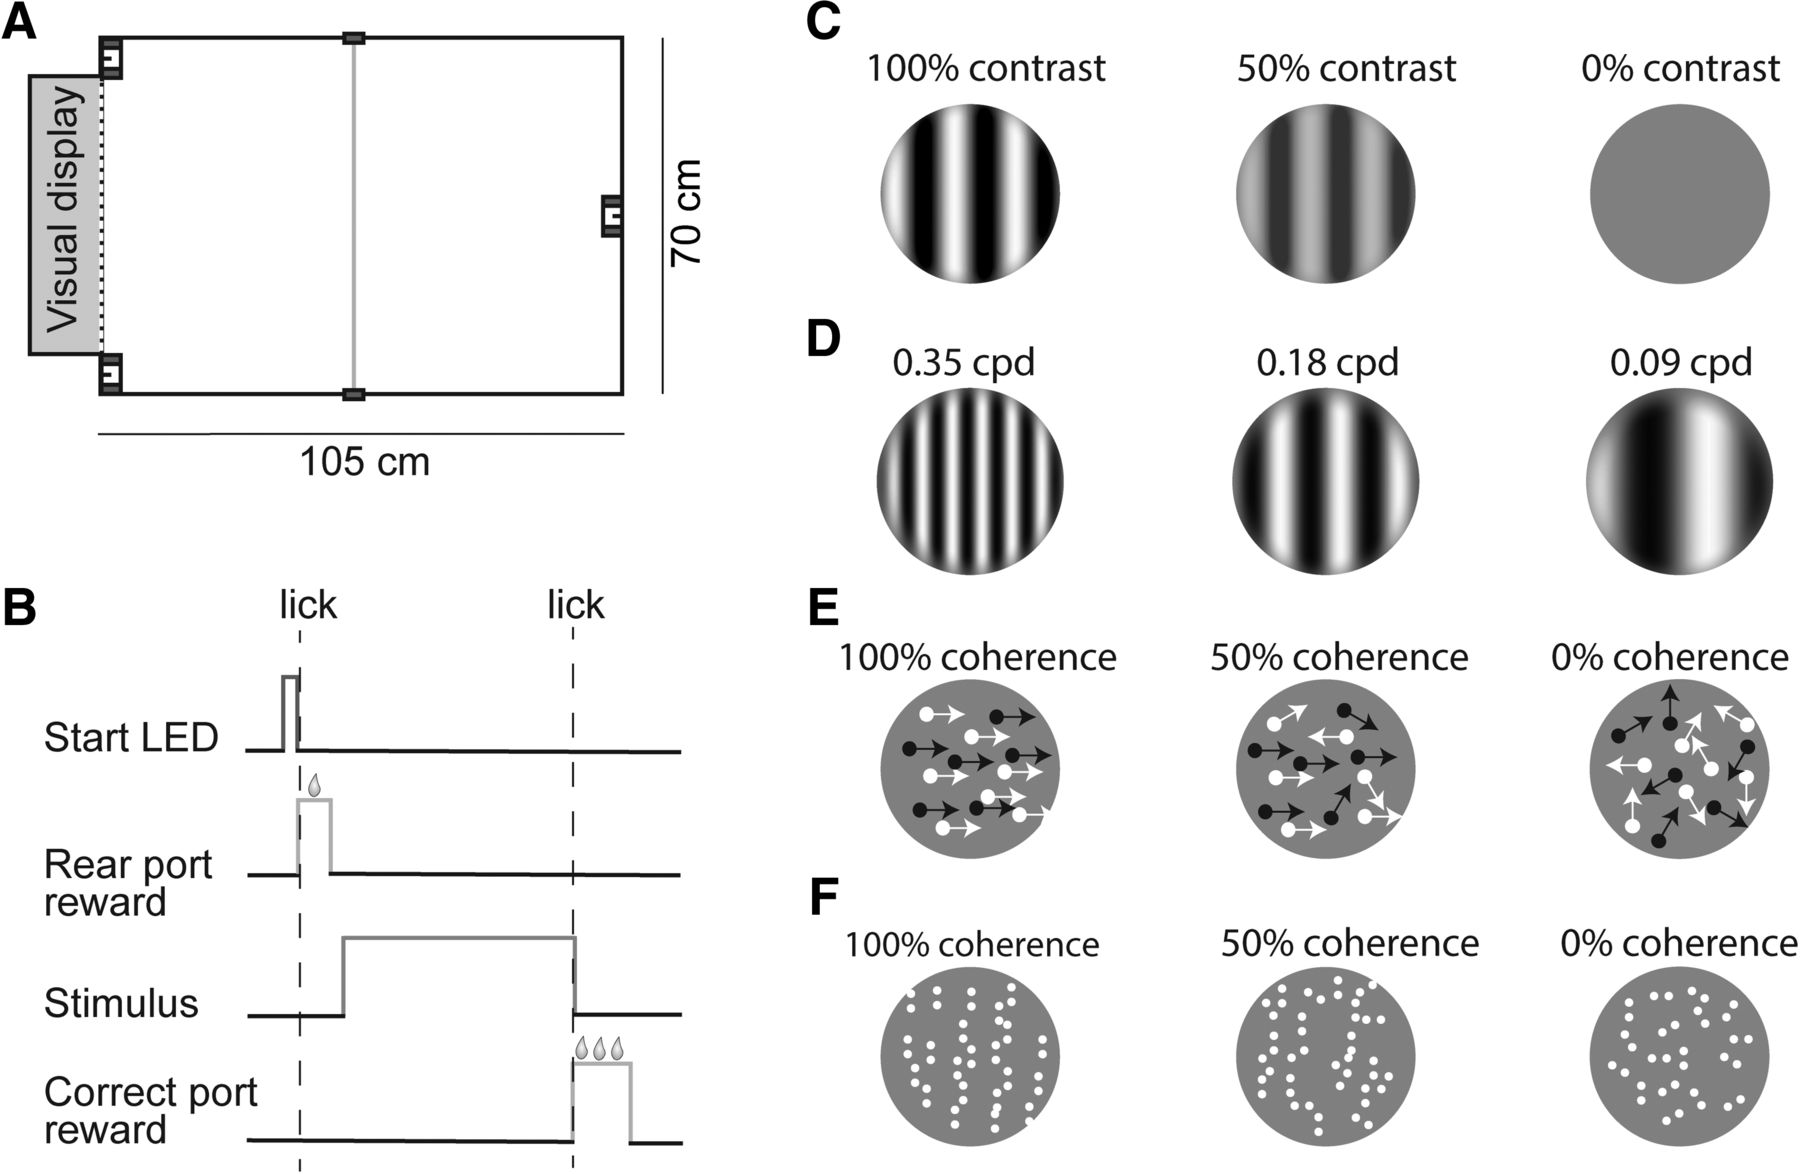
    Freely-moving setup and basic stimulus design. A, Schematic of freely-moving behavioral setup. The trial initiation port was centered on the wall opposite the visual display. Choice ports were on either side of the display. An IR beam was also placed across the middle of the box. B, Task structure. An LED was illuminated above the trial initiation port to signal that the ferret could initiate a trial. When the ferret broke the IR beam in that port, a small reward was dispensed, and stimulus presentation was triggered. Subsequent selection of the correct port resulted in ending stimulus presentation and reward delivery. C & D, Acuity task stimuli: sinusoidal gratings with varying contrasts and spatial frequencies. The ferrets were trained to discriminate horizontal from vertical gratings. E, Motion integration task stimuli: RDK consisting of black and white dots with varying coherence levels. RDK had to be discriminated based on their direction of motion (left or right). F, Form integration task stimuli: linear Glass patterns with varying degrees of coherence. The ferrets were trained to discriminate horizontal from vertical patterns.

  • Figure 2.
    • Download figure
    • Open in new tab
    • Download powerpoint
    Figure 2.

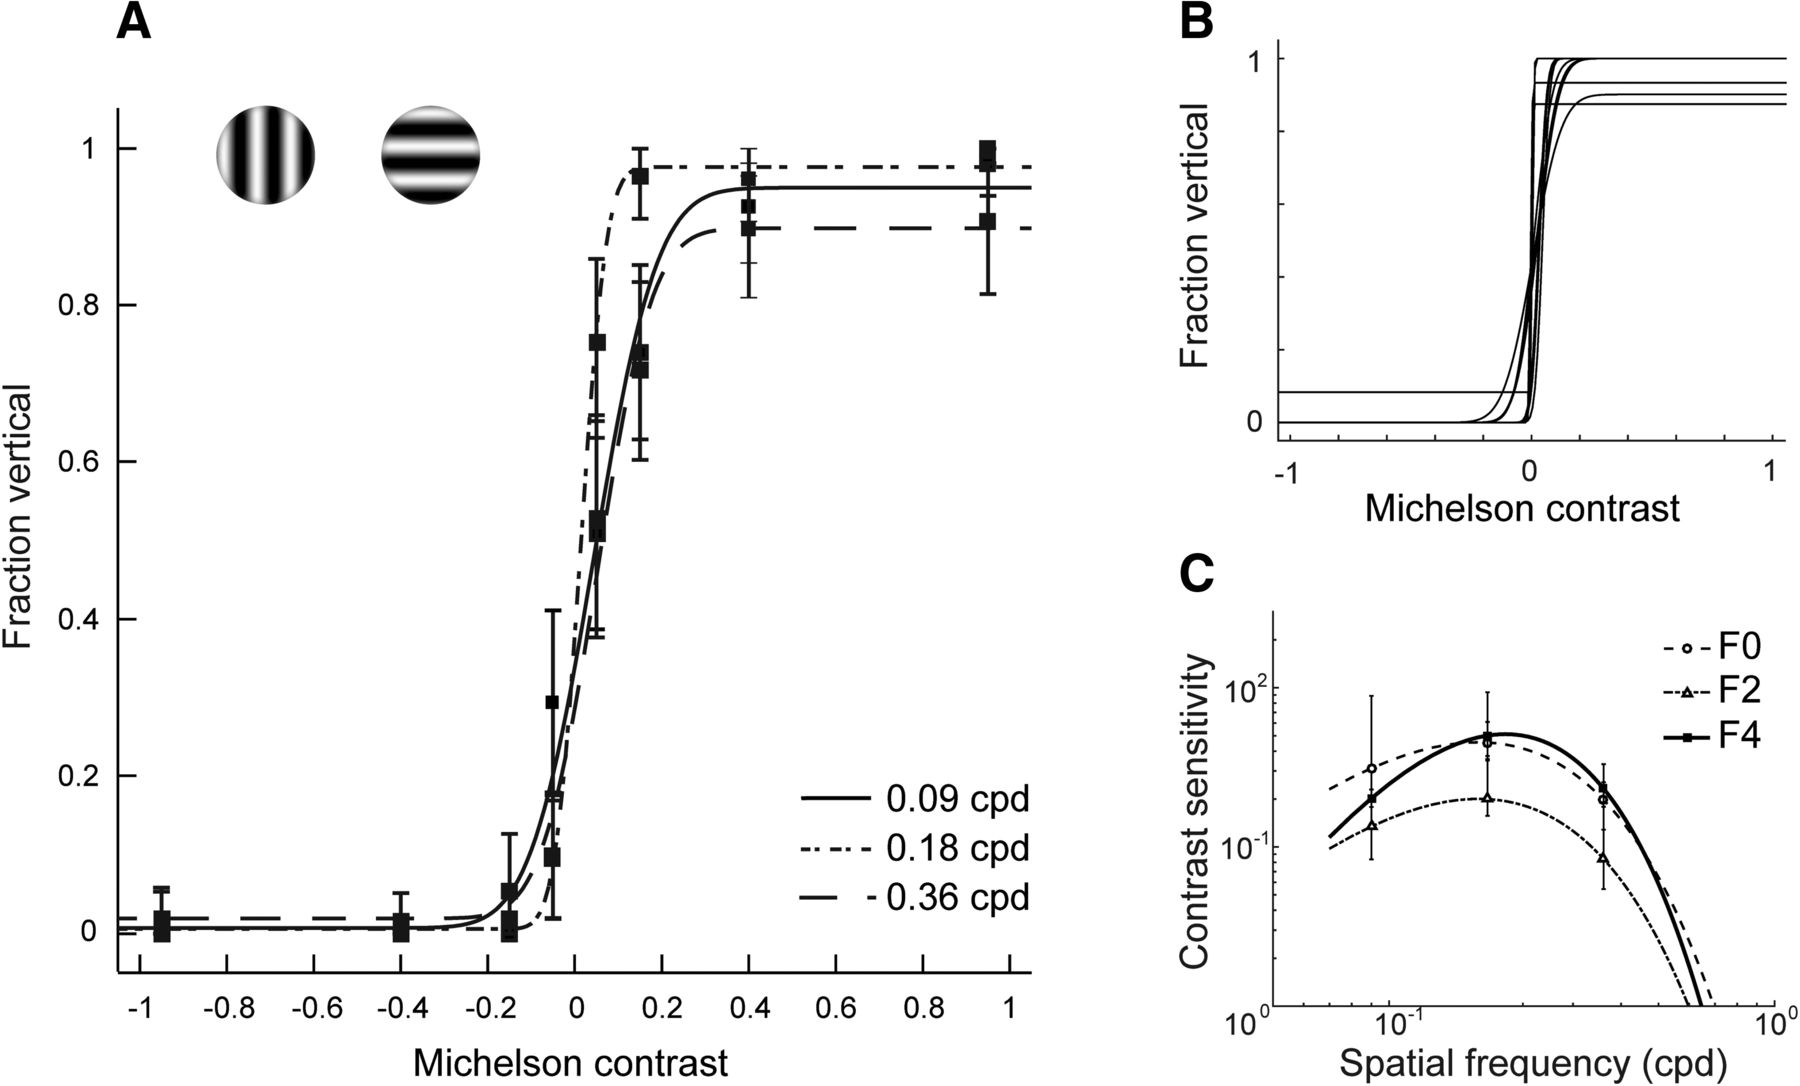
    Behavioral estimates of visual acuity. A, Psychometric curves for one ferret (F4) for three spatial frequencies. Error bars represent 95% confidence intervals (see Materials and Methods). B, Psychometric curves fit to data from individual testing sessions using a spatial frequency of 0.18 cpd (ferret F4); 13 sessions are shown here. C, Contrast sensitivity curves for each ferret. Error bars represent 68% confidence intervals (see Materials and Methods).

  • Figure 3.
    • Download figure
    • Open in new tab
    • Download powerpoint
    Figure 3.

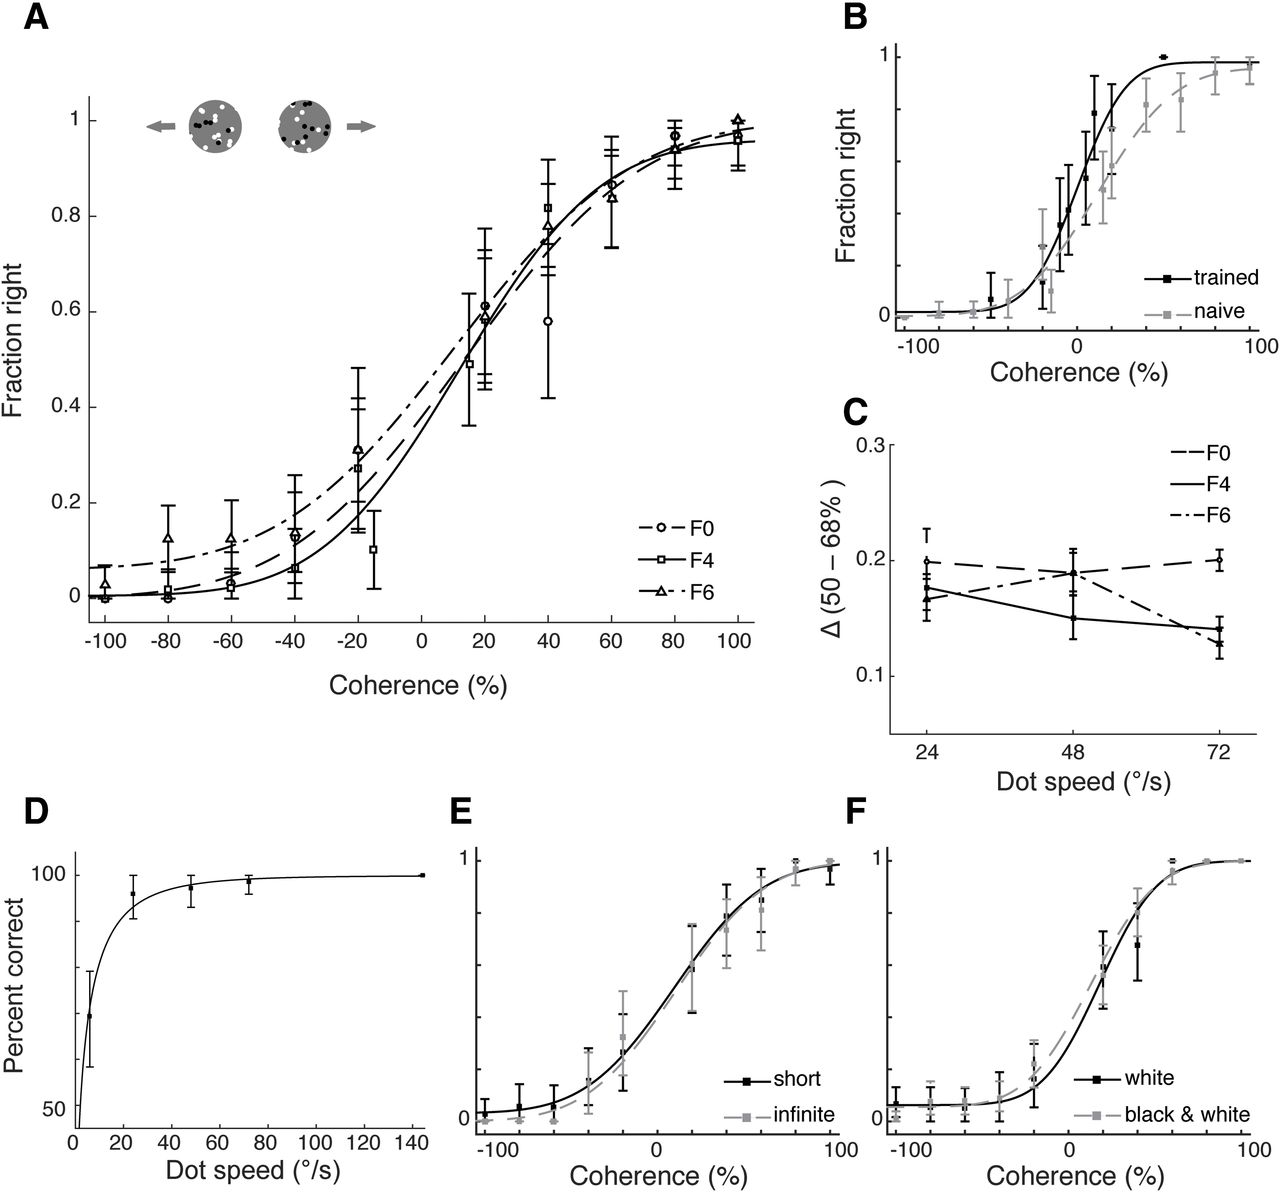
    Motion integration thresholds. A, Psychometric curves for each ferret on the motion integration task (dot speed 48°/s). B, Impact of training on motion integration thresholds: performance for F4 at the time of initial threshold measurements, and after 11 additional sessions. C, Sided coherence threshold Δ as a function of dot speed for each ferret. D, Performance of ferret F4 for RDK of 60% coherence as a function of dot speed. E, Performance comparison for short versus infinite dot lifetime (data for ferret F0). F, Performance comparison for white dots on a black background versus black and white dots on a gray background (data for ferret F6). All error bars, with exception of C, represent 95% confidence intervals. Error bars for C are 68% confidence intervals.

  • Figure 4.
    • Download figure
    • Open in new tab
    • Download powerpoint
    Figure 4.

    Head-fixed behavior paradigm. A, Schematic drawing of the head-fixed behavior setup (top view). The setup consisted of three major components, a body holder, headpost holder, and the reward spouts. All three components could be moved relative to each other to allow the animal to assume a comfortable posture while in the setup, and to reach the spouts easily. Each spout could be moved independently between a retracted and a forward position by means of a gas piston. Animals could only lick the spouts when in the forward position. All spouts were mounted on a large translation stage to control their overall distance from the animal. In addition, the two peripheral spouts were mounted on two smaller translation stages to control the lateral distance between the spouts. This was necessary to make sure that animals could not activate more than one spout simultaneously. B, Side-view of the head-fixed behavior setup. C, Three-spout task design. A trial initiation cue was presented and the center spout was moved forward. When the ferret licked the center spout, a small reward was dispensed. Next, the center spout was retracted and stimulus presentation was triggered. The two choice spouts were moved forward. If the ferret licked the correct spout first, the incorrect spout was retracted, the stimulus removed, and the ferret received a large water reward. If the ferret contacted the incorrect spout first, it was also retracted. The ferret then had to contact the correct spout (which remained in position) to end the trial and receive a much smaller reward.

  • Figure 5.
    • Download figure
    • Open in new tab
    • Download powerpoint
    Figure 5.

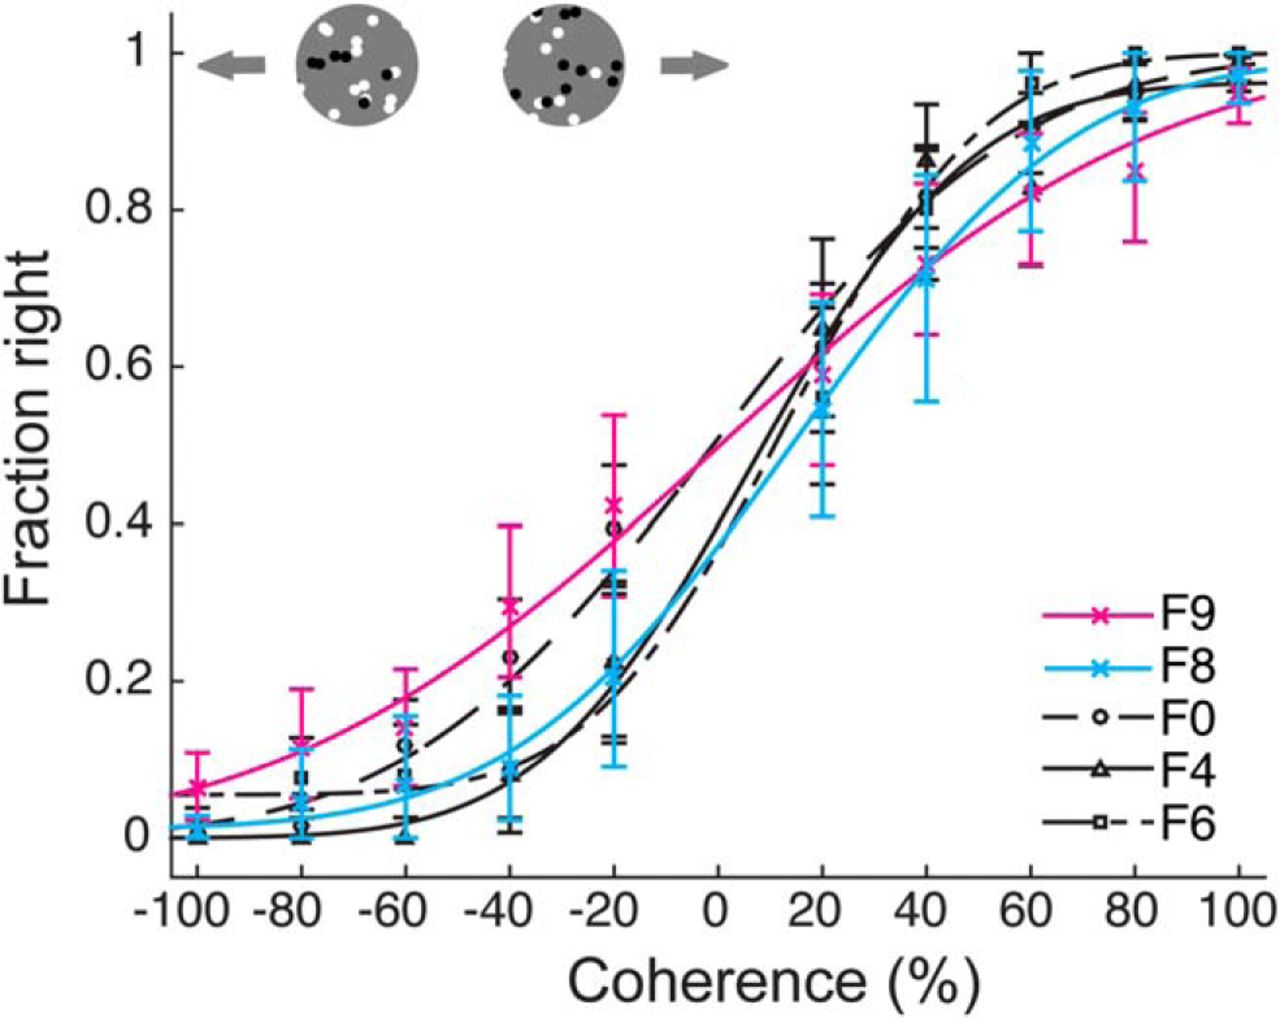
    Comparison of motion integration thresholds measured using head-fixed and freely-moving paradigms. Psychometric curves from all ferrets for the motion integration task at 72°/s. Colored lines show the performance of the head-fixed animals, F8 and F9. Black lines show the performance of freely moving animals (F0, F4, and F6). Error bars represent 95% confidence intervals.

  • Figure 6.
    • Download figure
    • Open in new tab
    • Download powerpoint
    Figure 6.

    Form integration thresholds measured using Glass patterns. Psychometric curves for Glass pattern stimuli for two ferrets. Error bars represent 95% confidence intervals.

  • Figure 7.
    • Download figure
    • Open in new tab
    • Download powerpoint
    Figure 7.

    Comparison of neurometric and psychometric motion integration thresholds. A, Sagittal view of the ferret brain, with the suprasylvian sulcus (SS) and PSS indicated. B, Firing rate distributions for an example PSS neuron, evoked by RDK of different coherence levels moving in the neurons preferred direction (black bars) or its null direction (white bars). Each bar indicates the number of trials on which a neuron exhibited a particular firing rate. C, ROC curves generated from the distributions in B. D, aROC values for all directionally selective and significantly responsive neurons (N = 36) at 100% coherence. Red dashed line at 0.75 indicates criterion cutoff. E, Comparison of an example neurometric function, computed for the neuron shown in C, D, to the average psychometric function. The average psychometric function was generated by fitting behavioral data collapsed across all three ferrets tested in the freely-moving paradigm. The threshold for the average psychometric function, using a criterion of 75% correct responses, is also indicated. Error bars indicate 95% confidence intervals. F, Distribution of 75% correct coherence thresholds across all directionally selective, significantly responsive neurons with aROC values of 0.75 or above at 100% coherence (N = 34). Also shown are the mean of this distribution, the threshold based on the average psychometric function (see E), and the thresholds of each of the three ferrets, all using the same criterion of 75% correct.

Tables

  • Figures
    • View popup
    Table 1.

    Tasks that each ferret performed

    FerretAcuityDotsGlass
    F0XXX
    F4XX
    F2X
    F6XX
    F8X
    F9X
    • Ferrets were first trained on the Acuity task, followed by the RDK task, followed by the Glass pattern task.

    • View popup
    Table 2.

    Peak contrast sensitivity and maximum acuity estimates

    FerretPeak contrast sensitivity (cpd)Maximum acuity estimate (cpd)Number of trialsNumber of sessions
    F00.170.70142011
    F20.170.60150017
    F40.200.65129113
    Mean0.18 ± 0.010.65 ± 0.031404 ± 6114 ± 2
    • Mean reported with SE.

    • View popup
    Table 3.

    Threshold evaluations for each complex visual task

    TaskΔ (50–68%)Threshold at 75%Threshold at 82%Number of trialsNumber of sessions
    Dots, 72°/s
    F020.06%35.62%45.07%137112
    F414.05%23.39%32.17%5036
    F612.79%26.74%34.98%7787
    Mean, free15.63 ± 2.24%28.58 ± 2.65%37.40 ± 3.92%884 ± 2568 ± 2
    F9 (hf)18.36%30.55%41.62%5684
    F8 (hf)28.35%45.27%59.48%9392
    Mean, hf23.36 ± 5.00%37.91 ± 7.36%50.55 ± 8.93%753 ± 1863± 1
    Mean, all18.72 ± 2.75%32.31 ± 3.83%42.66 ± 4.79%832 ± 1556 ± 2
    Dots, 48°/s
    F018.93%42.96%49.98%3083
    F415.01%25.10%35.56%5815
    F618.91%34.51%47.76%7078
    Mean17.62 ± 1.30%34.19 ± 5.16%44.43 ±4.48%532 ± 1185 ± 1
    Dots, 24°/s
    F019.89%38.37%50.89%5705
    F417.67%39.16%47.37%4925
    F616.67%33.97%44.20%7498
    Mean18.07 ± 0.95%37.16 ± 1.61%47.49 ± 1.93%604 ± 766 ± 1
    Glass
    F021.32%44.31%66.68%7666
    F623.25%48.94%65.45%6165
    Mean22.28 ± 0.97%46.65 ± 2.34%66.06 ± 0.62%691 ± 756 ± 1
    • Hf, head-fixed behavior; free, freely-moving behavior. Mean reported with SE.

Back to top

In this issue

eneuro: 6 (4)
eNeuro
Vol. 6, Issue 4
July/August 2019
  • Table of Contents
  • Index by author
  • Ed Board (PDF)
Email

Thank you for sharing this eNeuro article.

NOTE: We request your email address only to inform the recipient that it was you who recommended this article, and that it is not junk mail. We do not retain these email addresses.

Enter multiple addresses on separate lines or separate them with commas.
Visual Motion and Form Integration in the Behaving Ferret
(Your Name) has forwarded a page to you from eNeuro
(Your Name) thought you would be interested in this article in eNeuro.
CAPTCHA
This question is for testing whether or not you are a human visitor and to prevent automated spam submissions.
Print
View Full Page PDF
Citation Tools
Visual Motion and Form Integration in the Behaving Ferret
Erika Dunn-Weiss, Samuel U. Nummela, Augusto A. Lempel, Jody M. Law, Johanna Ledley, Peter Salvino, Kristina J. Nielsen
eNeuro 1 August 2019, 6 (4) ENEURO.0228-19.2019; DOI: 10.1523/ENEURO.0228-19.2019

Citation Manager Formats

  • BibTeX
  • Bookends
  • EasyBib
  • EndNote (tagged)
  • EndNote 8 (xml)
  • Medlars
  • Mendeley
  • Papers
  • RefWorks Tagged
  • Ref Manager
  • RIS
  • Zotero
Respond to this article
Share
Visual Motion and Form Integration in the Behaving Ferret
Erika Dunn-Weiss, Samuel U. Nummela, Augusto A. Lempel, Jody M. Law, Johanna Ledley, Peter Salvino, Kristina J. Nielsen
eNeuro 1 August 2019, 6 (4) ENEURO.0228-19.2019; DOI: 10.1523/ENEURO.0228-19.2019
Twitter logo Facebook logo Mendeley logo
  • Tweet Widget
  • Facebook Like
  • Google Plus One

Jump to section

  • Article
    • Abstract
    • Significance Statement
    • Introduction
    • Materials and Methods
    • Results
    • Discussion
    • Acknowledgments
    • Footnotes
    • References
    • Synthesis
  • Figures & Data
  • Info & Metrics
  • eLetters
  • PDF

Keywords

  • behavior
  • electrophysiology
  • ferret
  • form vision
  • motion vision
  • visual cortex

Responses to this article

Respond to this article

Jump to comment:

No eLetters have been published for this article.

Related Articles

Cited By...

More in this TOC Section

New Research

  • A Very Fast Time Scale of Human Motor Adaptation: Within Movement Adjustments of Internal Representations during Reaching
  • TrkB Signaling Influences Gene Expression in Cortistatin-Expressing Interneurons
  • Optogenetic Activation of β-Endorphin Terminals in the Medial Preoptic Nucleus Regulates Female Sexual Receptivity
Show more New Research

Cognition and Behavior

  • A Positive Relationship Exists Between the Triglyceride to Glucose Index and Waist to Hip Ratio with Stroke Risk in Middle Aged and Older Chinese
  • Visual Speech Reduces Cognitive Effort as Measured by EEG Theta Power and Pupil Dilation
  • A Progressive Ratio Task with Costly Resets Reveals Adaptive Effort-Delay Trade-Offs
Show more Cognition and Behavior

Subjects

  • Cognition and Behavior
  • Home
  • Alerts
  • Follow SFN on BlueSky
  • Visit Society for Neuroscience on Facebook
  • Follow Society for Neuroscience on Twitter
  • Follow Society for Neuroscience on LinkedIn
  • Visit Society for Neuroscience on Youtube
  • Follow our RSS feeds

Content

  • Early Release
  • Current Issue
  • Latest Articles
  • Issue Archive
  • Blog
  • Browse by Topic

Information

  • For Authors
  • For the Media

About

  • About the Journal
  • Editorial Board
  • Privacy Notice
  • Contact
  • Feedback
(eNeuro logo)
(SfN logo)

Copyright © 2025 by the Society for Neuroscience.
eNeuro eISSN: 2373-2822

The ideas and opinions expressed in eNeuro do not necessarily reflect those of SfN or the eNeuro Editorial Board. Publication of an advertisement or other product mention in eNeuro should not be construed as an endorsement of the manufacturer’s claims. SfN does not assume any responsibility for any injury and/or damage to persons or property arising from or related to any use of any material contained in eNeuro.