Article Figures & Data
Figures
- Figure 1.
Effect of social isolation on body weight and anhedonia in control and epileptic mice. A, Experimental protocol. In pretest condition, up to day 0, mice were socially housed and evaluated for anhedonia, anxiety (EPM), and NOR test. Tested mice were then assigned randomly to different groups: non-pilo-SC, i.e., control like before D0, non-pilo-IC, i.e., the mice were transferred to an individual cage, pilo-SC, the mice received pilo to induce SE, which triggers epileptogenesis, the process leading to the occurrence of spontaneous seizures, and pilo-IC. Four weeks following SE (posttest conditions), the same mice were evaluated for anhedonia, EPM, and NOR tests. At the end of the experimental protocol, animals were killed to measure corticosterone, ACTH, and BDNF. B, Evolution of averaged body weight over six weeks for the four groups. The pilo-IC groups gained less weight than the other groups. Data are mean ± SEM; *p < 0.05 in comparison with the control non-pilo-SC group. C, Sweet water consumption was identical in all mice in pretest conditions (splitting them on their future group assignment). As compared to the control group (non-pilo-SC), the non-pilo-IC showed anhedonia, which was further increased in the pilo-SC and exacerbated in the pilo-IC group. Data are mean ± SEM; ***p < 0.001 in comparison with the corresponding non-pilo group; #p < 0.05, ##p < 0.01, and ###p < 0.001 in comparison with the corresponding SC group.
- Figure 2.
Effect of social isolation on anxiety levels in control and epileptic mice. The paired mean difference for four comparisons between posttest (non-pilo-SC, pilo-SC, non-pilo-IC, and pilo-IC) and pretest (pre) conditions are shown in the Cumming estimation plot. The raw data are plotted on the upper axes; each paired set of observations is connected by a line (A). On the lower axis (B), each paired mean difference is plotted as a bootstrap sampling distribution. Mean differences are depicted as black dots; 95% CIs are indicated by the ends of the vertical error bars. Colored dots correspond to the posttest-pretest differences for each mouse. Although anxiety levels appear similar in average in pretest conditions, we note a wide dispersion of the raw data, i.e., individual animals can have very different levels of anxiety (compare pretest values in panel A). We also note the apparent existence of a bimodal distribution. B, There was no change in anxiety level in the control group (non-pilo mice maintained in social housing), although individuals displayed variability (first panel from the left). Social isolation in non-pilo animals (third panel from the left) significantly increased anxiety levels as compared to pretest. The changes in anxiety levels were more extensive in the pilo-SC group (second panel) and most extensive in the pilo-IC group (fourth panel). C, Each mean difference in changes in anxiety score is plotted as a bootstrap sampling distribution. Mean differences are depicted as dots; 95% CIs are indicated by the ends of the vertical error bars. Epilepsy (in pilo mice) produced the same increase in anxiety levels in SC and IC conditions (although the IC group starts from higher anxiety levels as compared to the SC group). This means that the effect of epilepsy in isolated mice on anxiety levels is a blend of the effect of epilepsy and isolation.
- Figure 3.
Effect of social isolation on the NOR test in control and epileptic mice. The paired mean difference for four comparisons between posttest (non-pilo-SC, pilo-SC, non-pilo-IC, and pilo-IC) and pretest (pre) conditions are shown in the Cumming estimation plot. The raw data are plotted on the upper axes; each paired set of observations is connected by a line (A). On the lower axis (B), each paired mean difference is plotted as a bootstrap sampling distribution. Mean differences are depicted as black dots; 95% CIs are indicated by the ends of the vertical error bars. Colored dots correspond to the posttest-pretest differences for each mouse. As for anxiety levels, although the discrimination index appears similar in average in pretest conditions, we note a wide dispersion of the raw data, i.e., individual animals can have very different levels of performance in the NOR test (compare pretest values in panel A). B, There was no change in performance in the control group (non-pilo mice maintained in social housing), although individuals displayed variability (first panel from the left). Social isolation in non-pilo animals (third panel from the left) did not change the performance at the group level (the CI crosses the null line), but we note that five out of six of the isolated animals displayed a decrease in performance as compared to pretest. The changes in discrimination index were substantial in both pilo-SC (second panel) and pilo-IC (fourth panel) groups. C, Each mean difference in changes in discrimination index score is plotted as a bootstrap sampling distribution. Mean differences are depicted as dots; 95% CIs are indicated by the ends of the vertical error bars. Epilepsy (in pilo mice) produced the same increase in anxiety levels in SC and IC conditions.
- Figure 4.
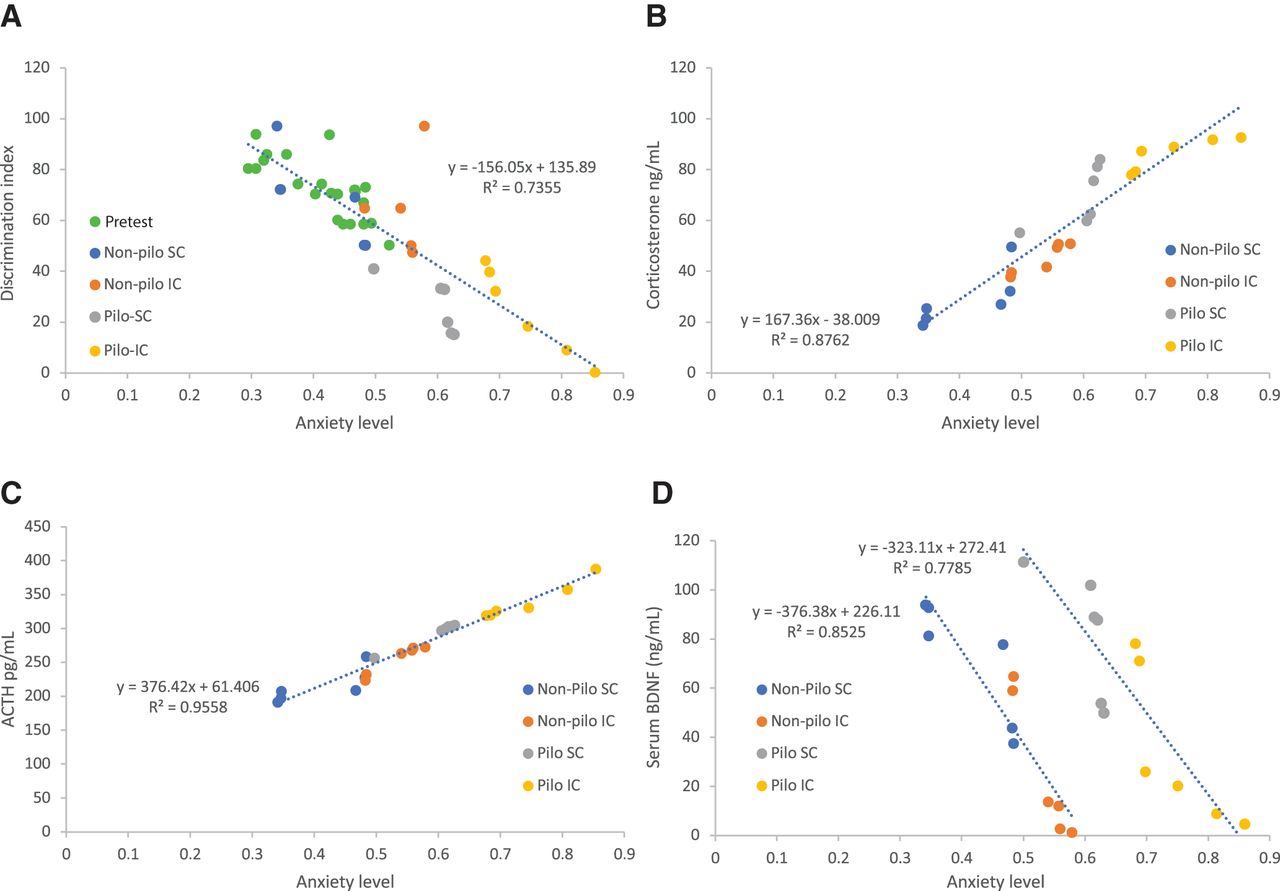
Co-variance between anxiety levels and the discrimination index, corticosterone, ACTH, and BDNF levels. A, The discrimination index is linearly correlated to anxiety levels. All mice are displayed. The dispersion of pairs of values for anxiety levels (Fig. 2A) across 0.25 U and discrimination index (Fig. 2B) across 50 U at baseline is clearly apparent (green dots). All mice are distributed close to the regression line (built from all data points). The non-pilo group maintaining social housing (dark blue dots) remained in the cloud of baseline values. The non-pilo isolated group (orange dots) showed a downward shift. Note the presence of the outlier with high cognitive performance and high anxiety level. Pilo animals displayed a further downward shift with higher anxiety levels and lower cognitive performance, with isolated animals showing the strongest phenotype. Corticosterone (B) and ACTH (C) levels are strongly linearly correlated to anxiety levels. As for the discrimination index, the phenotype increased in a group-dependent manner non-pilo-SC < non-pilo-IC < pilo-SC < pilo-IC. D, The relationship between BDNF and anxiety levels was also linear but treatment dependent. The regression line was shifted to the right (greater anxiety levels) in epileptic mice.
- Figure 5.
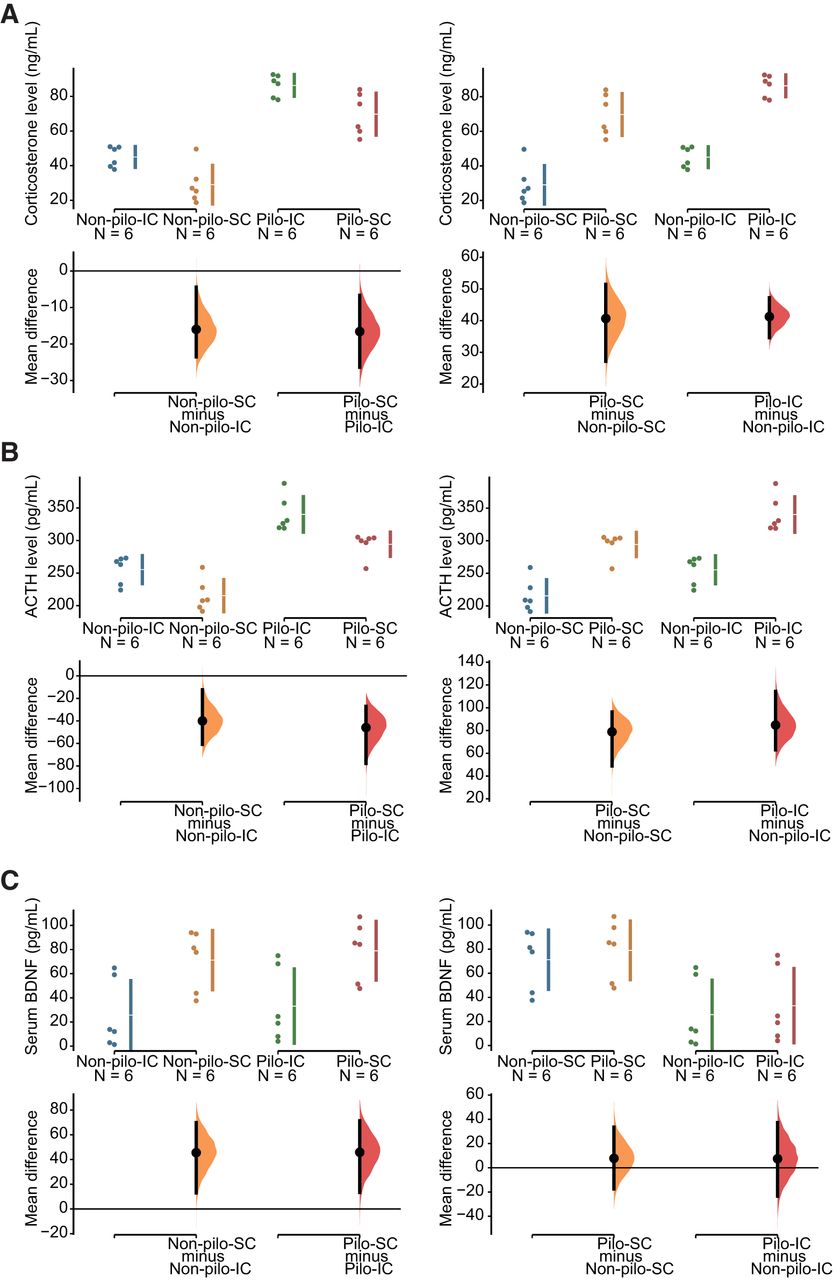
Effect of social isolation on corticosterone, ACTH, and BDNF levels in control and epileptic mice. In A–C, the mean difference for two comparisons is shown in the Cumming estimation plot. All raw data are shown on the upper axes. For each group, summary measurements (mean ± SD) are shown as gapped lines. Each mean difference is plotted on the lower axes as a bootstrap sampling distribution. Mean differences are depicted as black dots; 95% CIs are indicated by the ends of the vertical error bars. A, Social isolation increased corticosterone levels by 15 U in both non-pilo and pilo groups (left panel). The effect of epilepsy was even stronger (40 U) in the SC and IC groups (right panel). B, Social isolation increased ACTH levels by 40 U in both non-pilo and pilo groups (left panel). The effect of epilepsy was even stronger (80 U) in the SC and IC groups (right panel). C, Social isolation decreased BDNF levels by 40 U in both non-pilo and pilo groups (left panel). The epilepsy condition had no apparent effect on BDNF levels in both SC and IC groups.
- Figure 6.
Housing × treatment interaction on corticosterone, ACTH, and BDNF levels. Means and 95% CIs are as in Figure 5. The (pilo–non-pilo) differences between the right two means and the left two means are marked by the purple lines ending in diamonds (indicating the direction of the change). The slanted dotted lines make a comparison of the two differences. The difference between the differences is marked by the triangle on the difference axis, with its CI. The analysis of the difference of differences did not reveal apparent housing × treatment interaction for corticosterone (A), ACTH (B), and BDNF (C) levels.
- Figure 7.
Effect of social isolation on body weight and anhedonia in control rats. A, Experimental protocol in non-pilo and pilo rat groups. In the control (non-pilo) group (top part of the time axis) rats were assigned at day 0 to isolated, handled, and paired groups. Anhedonia was assessed two weeks and six weeks later. During week 7, animals were killed for the analysis of corticosterone, ACTH, and BDNF levels. In the pilo group (bottom part of the time axis), animals were injected with pilo at day 0 and assigned to isolated, handled, and paired groups. Four weeks later, rats were equipped with wireless EEG transmitters, and recordings started one week later for three weeks. B, Evolution of the average body weight over seven weeks in control (non-pilo) rats for the three isolated, handled, and paired groups. The isolated group significantly gained less weight. C, In control rats, isolated animals already showed anhedonia during the first evaluation (two weeks after separation) as compared to paired animals. Interestingly, handled animals showed increased sweet water consumption as compared to the paired group. The same result was found during the second evaluation period six weeks after group assignment. Data are mean ± SEM; *p < 0.05, **p < 0.01, and ***p < 0.001 in comparison with the isolated group; #p < 0.05, ##p < 0.01, and ###p < 0.001 in comparison with the handled group.
- Figure 8.
Effect of social isolation on corticosterone, ACTH, and BDNF levels in control rats. A, Social isolation increased corticosterone levels by 7 U in isolated rats as compared to handled and paired animals. B, Social isolation increased ACTH levels by 100 U in isolated rats as compared to handled and paired animals. C, Social isolation decreased BDNF levels by 0.4 U in isolated rats as compared to handled and paired animals. The effect of isolation was significant for the three biomarkers, the CIs being far from the null value. The overlap of the distributions between handled and paired animals suggests a lack of difference between the two conditions.
- Figure 9.
Distribution of seizures per week for each animal. The average seizure frequency (seizures per hour) for each recording week is shown for (A) isolated (n = 11), (B) handled (n = 12), and (C) paired rats (n = 6). Note that the scale of seizure frequency in the isolated group is one order of magnitude higher than the other two groups. Two animals (out of 11) in the isolated group had a seizure frequency similar to that found in paired or handled animals (0.03/h). The three groups displayed stability (despite some individual variability) over the three weeks of recordings.
- Figure 10.
Social isolation increases spontaneous seizures by a factor of 16 in rats. A, The seizure frequency [number of spontaneous recurrent seizures (SRS) per hour], (B) duration, and (C) severity are shown for isolated, handled, and paired rats (n = 11, n = 12, and n = 6). Isolated rats displayed a very severe epileptic phenotype as compared to the other groups. Handled and paired groups showed a similar phenotype.




Tables
- Table 1.
Statistical analysis of the effects of mice groups (grouped/isolated) and treatment (veh and pilo) on body weight and sucrose preference
Data Data structure
(normality test)Type of test Power Body weight
(a)Yes ANOVA with repeated measures
Post hoc test: Bonferroni testGroup effect:
F(3,20) = 2.23,
p = 0.11
Time effect:
F(5,100) = 128.08,
p < 0.0001
Interaction:
F(15,100) = 1.18,
p = 0.29
(CI = 95%)Anhedonia
Presocial isolation
(b)Yes ANOVA with repeated measures
Post hoc test: Bonferroni testGroup effect:
F(3,20) = 8.33,
p = 0.001
Time effect:
F(6,120) = 0.20,
p = 0.97
Interaction:
F(18,120) = 0.31,
p = 0.99
(CI = 95%)Anhedonia
Postsocial isolation
(c)Yes ANOVA with repeated measures
Post hoc test: Bonferroni testGroup effect:
F(3,20) = 295.85,
p < 0.0001
Time effect:
F(6,120) = 0.13,
p = 0.99
Interaction:
F(18,120) = 0.36,
p = 0.99
(CI = 95%) - Table 2.
Statistical analysis of the effects of rat groups (isolated/handled/paired) on body weight and sucrose preference
Data Data structure
(normality test)Type of test Power Body weight
(d)Yes ANOVA with repeated measures
Post hoc test: Bonferroni testGroup effect:
F(2,17) = 41.58,
p < 0.0001
Time effect:
F(6,102) = 266.83,
p < 0.0001
Interaction:
F(12,102) = 2.10,
p = 0.02
(CI = 95%)Anhedonia
first week
(e)Yes ANOVA with repeated measures
Post hoc test: Bonferroni testGroup effect:
F(2,12) = 21.66,
p < 0.0001
Time effect:
F(6,72) = 0.11,
p = 0.99
Interaction:
F(12,102) = 0.16,
p = 0.99
(CI = 95%)Anhedonia
last week
(f)Yes ANOVA with repeated measures
Post hoc test: Bonferroni testGroup effect:
F(2,12) = 97.85,
p < 0.0001
Time effect:
F(6,72) = 1.09,
p = 0.37
Interaction:
F(12,72) = 0.13,
p = 0.99
(CI = 95%)
In this issue