

Article Figures & Data
Figures
- Figure 1.
Chronically-implanted optic fibers enable light delivery to V1, ACC, and dHC. Optic fibers (200 µm in diameter; illustrated by the black rectangle) were implanted for delivery of 450-nm wavelength “blue” light to stimulate PV-INs, resulting in the suppression of excitatory output. The expected volume of suppression is a region of tissue 1.5 mm in diameter (illustrated by the blue circle; Weible et al., 2014). AP: anterior (+) or posterior (–) to bregma; DV: ventral to the cortical surface; ML: lateral to the midline.
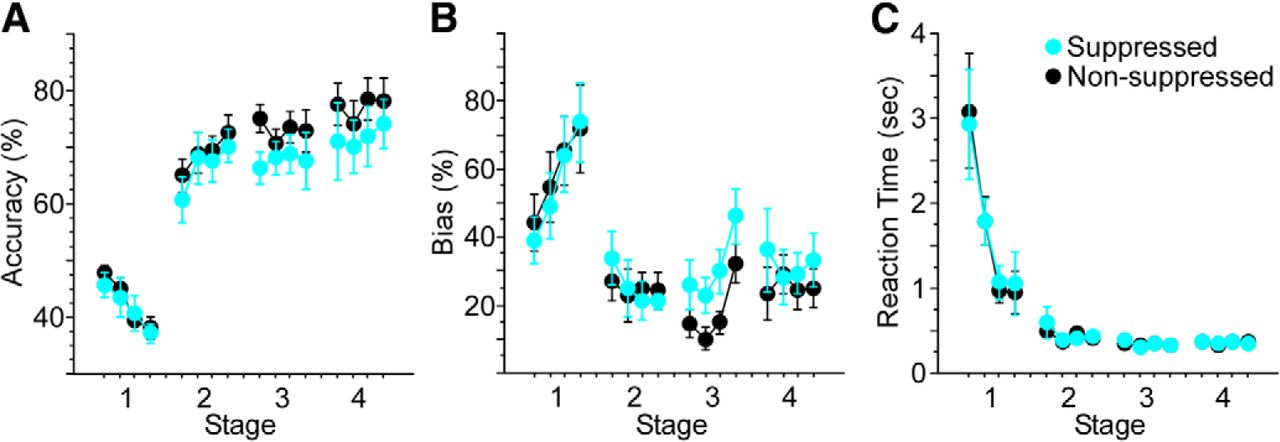
- Figure 2.
Accuracy and RT performance measures recapitulate changes observed with human skill learning. Control mice acquired the visual spatial discrimination task without interleaved suppression trials. A, The decrease in RT seen as accuracy increases approximates the power function found with human skill learning. B–D, Accuracy, bias, and RT measures are plotted by the 4 d of each stage. Response bias trended lower over the three stages, and RT decreased significantly (bias: df = 11, χ2 = 18.5, p = 0.07; RT: df = 11, χ2 = 61.3, p < 0.0001). Analyses for each stage included 4 d of training. Stage 1 included the first 4 d of training. Stage 2 included the first 4 d following performance of 65% correct responses in a 50-trial block. Stage 3 included the 4 d following performance of 85% correct responses in a 50-trial block.
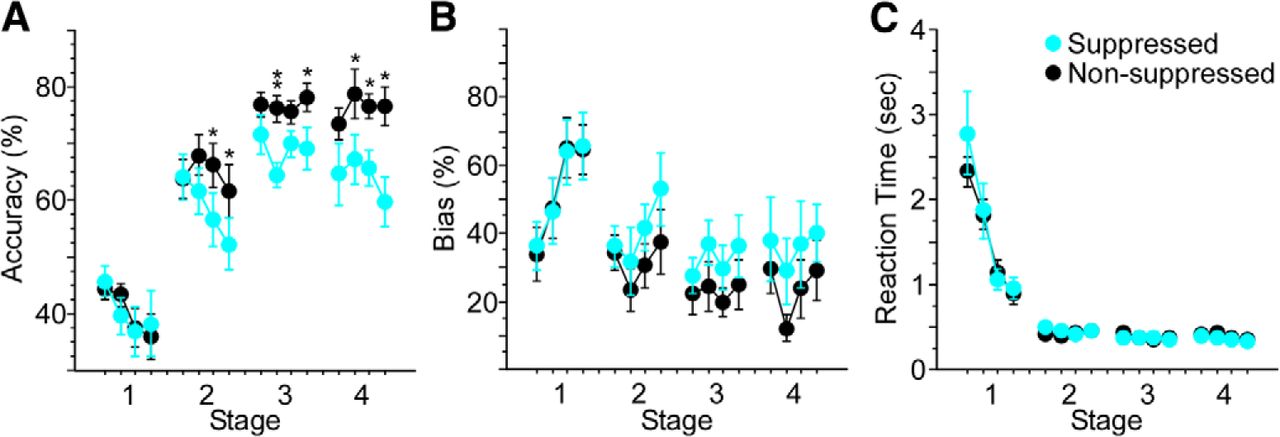
- Figure 3.
V1 suppression significantly reduces accuracy and increases response bias and RT. Light was delivered to V1 to suppress excitatory activity on 20% of trials through stage 4. A, Suppression reduced accuracy across stages compared with non-suppressed trials (Friedman’s, df = 1, χ2 = 30.3, p < 0.0001). B, Response bias increased on suppressed versus non-suppressed trials (Friedman’s, df = 1, χ2 = 36.1, p < 0.0001). C, Suppression produced a small but significant increase in RT across stages (Friedman’s, df = 1, χ2 = 6.6, p = 0.01). Analyses for each stage included 4 d of training. Stage 1 included the first 4 d of training. Stage 2 included the first 4 d following performance of 65% correct responses in a 50-trial block. Stage 3 included the first 4 d following performance of 85% correct responses in a 50-trial block. Following stage 3, correction trials were reduced gradually to 0%, at which point mice received an additional 4 d of overtraining (stage 4); *p < 0.05, **p < 0.01.
- Figure 4.
ACC suppression significantly reduces accuracy and increases response bias. Light was delivered to ACC to suppress excitatory activity on 20% of trials through stage 4. A, Suppression reduced accuracy across stages compared with non-suppressed trials (Friedman’s, df = 1, χ2 = 9.6, p = 0.002). B, Response bias increased on suppressed versus non-suppressed trials (Friedman’s, df = 1, χ2 = 4.6, p = 0.033). C, Suppression did not significantly affect RT across days of training. Analyses for each stage included 4 d of training. Stage 1 included the first 4 d of training. Stage 2 included the first 4 d following performance of 65% correct responses in a 50-trial block. Stage 3 included the first 4 d following performance of 85% correct responses in a 50-trial block. Following stage 3, correction trials were reduced gradually to 0%, at which point mice received an additional 4 d of overtraining (stage 4); *p < 0.05, **p < 0.01.
- Figure 5.
Suppression of dHC modestly reduces response accuracy. Light was delivered to dHC to suppress excitatory activity on 20% of trials through stage 4. A, Suppression reduced accuracy across stages compared with non-suppressed trials (Friedman’s, df = 1, χ2 = 4.8, p = 0.03). Neither response bias (B) nor RT (C) changed significantly with suppression. Analyses for each stage included 4 d of training. Stage 1 included the first 4 d of training. Stage 2 included the first 4 d following performance of 65% correct responses in a 50-trial block. Stage 3 included the first 4 d following performance of 85% correct responses in a 50-trial block. Following stage 3, correction trials were reduced gradually to 0%, at which point mice received an additional 4 d of overtraining (stage 4).
- Figure 6.
Decreases in accuracy grow over time with suppression of ACC and V1, but not dHC. Suppression effect size was calculated by subtracting accuracy of suppressed trials from non-suppressed trials. The size of the suppression effect increased significantly across days for V1 and ACC mice (Friedman’s, df = 15, χ2 = 62.4, p < 0.0001 and df = 15, χ2 = 25.7, p = 0.04, respectively), but not dHC mice. Differences in effect size were significant between groups during stages 3 and 4 (Kruskal–Wallis, df = 2, p = 0.002 and df = 2, p < 0.0001, respectively), with effect size in V1 exceeding that of ACC during stages 3 and 4 (Mann–Whitney, z = –2.7, p = 0.006 and z = –2.4, p = 0.02, respectively), and ACC exceeding that of dHC during stage 4 (Mann–Whitney, z = –2.4, p = 0.02).
- Figure 7.
Suppression effects on accuracy are trial specific. A, Control mice and mice undergoing V1, ACC, and dHC suppression learned to stages 2 and 3 criteria in a comparable number of trials (accuracy criteria: >65% and >85% correct responses in a 50-trial block, respectively). Trials to stage 2 indicated by the white line bisecting each bar. Control mice did not undergo suppression over the course of training, but were implanted with fibers targeting V1, ACC, or dHC. During stage 4, suppression was performed in V1, ACC, or dHC mice and compared with effects seen in controls with matching fiber placements undergoing suppression for the first time. The results demonstrate that suppression over the course of training in V1 (B), ACC (C), or dHC (D) did not have a subsequent effect on suppression performed after mice reached the >85% criterion.
- Figure 8.
Suppression increases RT following errors. Errors during training were signaled by an increase in screen luminance that persisted for 1 s. RT on correct responses was longer following errors than following correct responses. Suppression further lengthened RTs following errors but had no effect on RT following correct responses. These patterns were observed for mice from each suppression group, with performance on suppressed trials indicated by blue bars, and non-suppressed trials by black bars. A, In V1, suppression lengthened RTs following errors during stages 2 and 4 (dashed black lines; Wilcoxon, z = –2.7, p = 0.006 and z = –2.4, p = 0.01, respectively). B, In ACC, suppression produced longer RTs during stage 2 (dashed black line; Wilcoxon, z = –2.3, p = 0.02). C, In dHC, suppression following an error produced longer RTs during stage 3 (dashed black line; Wilcoxon, z = –2.8, p = 0.004). Dashed gray line: increased RT on non-suppressed trials. Solid black line: increased RT following error versus correct trials, within either suppressed or non-suppressed conditions; *p < 0.05, *p < 0.01.


Tables
V1 ACC dHC Control Stage 1 50 50 50 50 Stage 2 69.5 ± 0.09 65.4 ± 0.02 65.5 ± 0.01 78.1 ± 0.02 Stage 3 47.5 ± 0.01 26.7 ± 0.04 35.8 ± 0.03 30.0 ± 0.03 Stage 4 0 0 0 0 All values % ± SE.
In this issue


