

Article Figures & Data
Figures
- Figure 1.
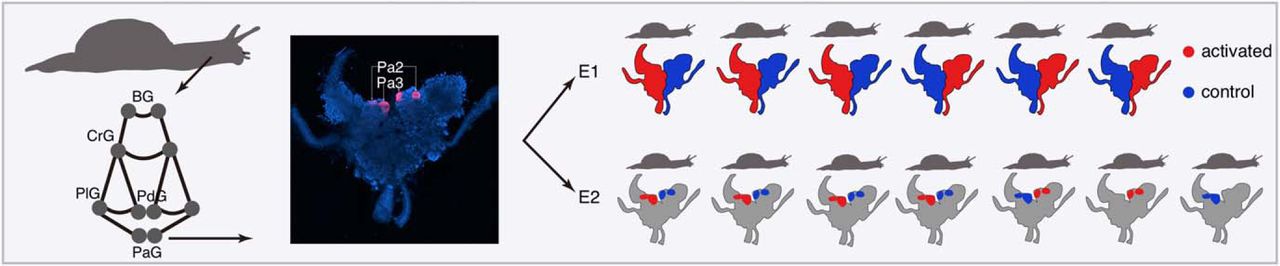
Experimental design. Left, Silhouette of the snail H. lucorum and the schematic representation of its nervous system showing the five pairs of ganglia: buccal ganglia (BG), cerebral ganglia (CrG), pedal ganglia (PdG), pleural ganglia (PlG), and PaG. The visceral ganglion was not used in experiments and was not shown. Middle, Fluorescence microscopy image of the PaG (blue) with two giant interneurons used in E2 (Pa2/3) shown in pink. Right, Schematic representation of two stimulation experiments conducted using the left or right PaG (E1) or a surgically dissected medial part of the PaG containing the Pa2/3 interneurons (E2). Extended data Figures 1-1, 1-2 showed the quality of the assembled snail neuronal transcriptome and the snail sample distribution based on the RNA-Seq measurements, respectively.
- Figure 2
Differential expression after the neuronal stimulation. A, Heat map showing expression levels as standard-normalized RPKM values of 422 DE contigs classified as DE in at least one of the two experiments. Purple boundaries indicate contigs showing significant expression differences in each experiment. B, up, Scatter plot showing the amplitude and the direction of expression differences of the 422 DE contigs in E1 and E2 as log2-transformed fold changes (logFC). The colors indicate significant expression differences in one or both experiments. Down, Zoomed in area of the upper plot shaded in gray.
- Figure 3.
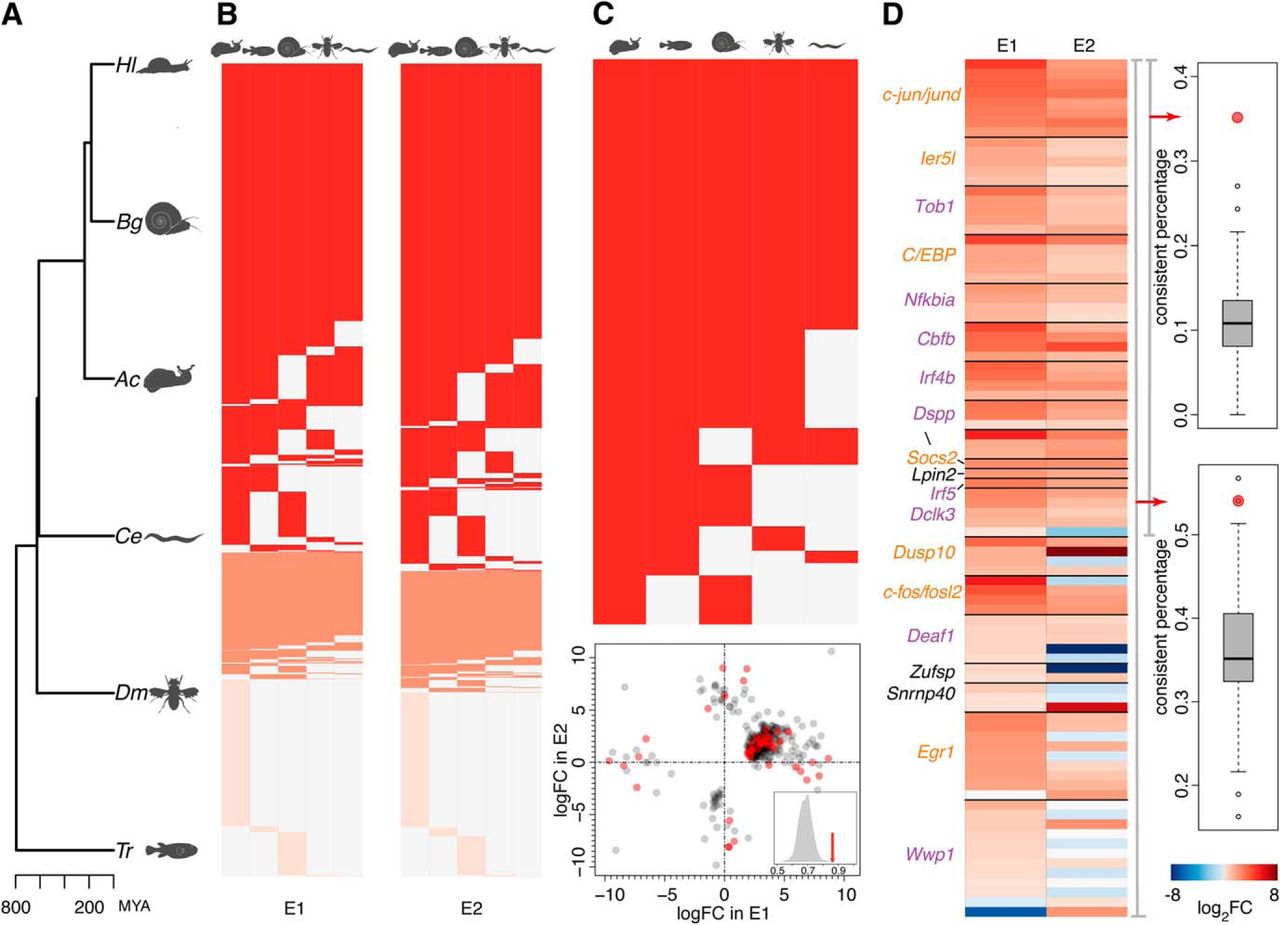
Annotation of expressed contigs. A, Phylogenetic tree showing the relationship between the snail H. lucorum (Hl) and the five species used in the contig annotation: B. glabrata (Bg), A. californica (Ac), C. elegans (Ce), D. melanogaster (Dm), and T. rubripes (Tr). MYA, million years ago. B, Snail contigs annotated and expressed in E1 (left) and E2 (right). The colors indicate contigs mapped to one species (light red); contigs mapped to multiple species, but inconsistently annotated among them (coral); and contigs mapped to multiple species and consistently annotated among them (red). C, up, 46 DE contigs consistently mapped to 37 proteins in multiple species. Down, Scatter plot showing the amplitude and the direction of expression differences of 422 DE contigs in E1 and E2 (the same as in Fig. 2B) with the 46 DE contigs shown in red. The inset shows the percentage of upregulated non-DE contigs mapped to the 37 proteins (red arrow) and the percentage expected by chance (gray distribution). D, left, Heat map showing the log2-transformed fold changes between activated and control samples in E1 and E2. The fold changes are shown for all contigs mapped to the 20 proteins, independent of the significance of the difference. Colors of protein names indicate known IEGs (orange) and stimulus response and immune response genes (purple). Right, Percentage of proteins showing a consistent difference direction based on no <80% of all mapped contigs in both experiments (upper) or within one experiment (lower). The red dots show the observed percentage and gray boxplots show the distributions of percentages expected by chance. Extended data Figure 3-1 showed the expression regulation of all the 37 consistently annotated proteins.
- Figure 4.
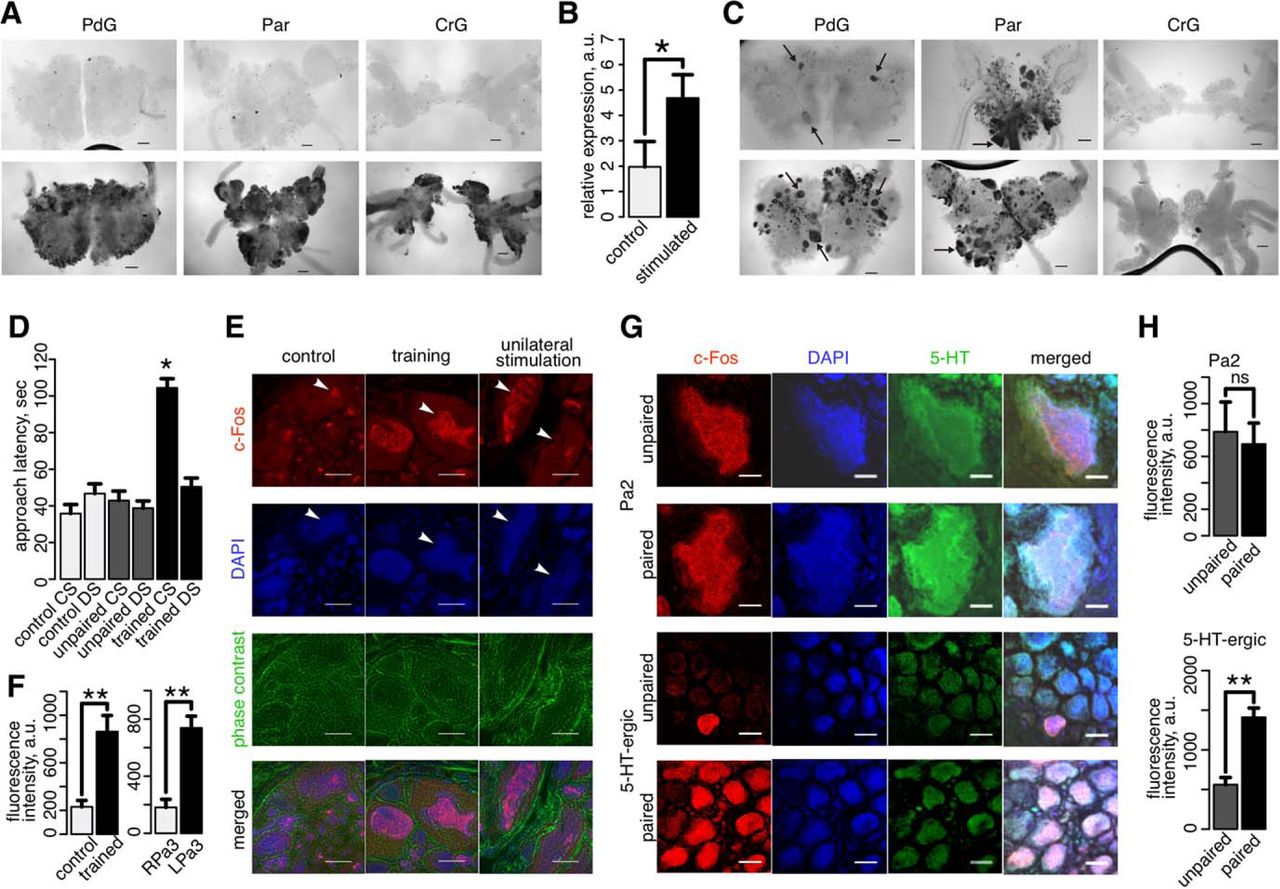
Expression of the snail c-Fos homolog. A, The in situ hybridization pattern of the c-fos/fosl2 probe in three parts of the snail nervous system, PdG, Par, and CrG after the stimulation by the bath application of 5-HT for 2 h (lower panel) and in the non-stimulated controls (upper panel). B, Expression of c-fos (mean ± SEM) in non-stimulated control parts of PaG (control, n = 5) and 5-HT activated parts of PaG (stimulated, n = 4) measured by RT-qPCR. The asterisk (*) indicates the significance of one-sided Mann–Whitney test, p < 0.05. C, Localization of neurons projecting to the anal nerve revealed by the backfill with neurobiotin (upper panel), and the in situ hybridization pattern of the c-fos/fosl2 probe after the stimulation of the anal nerve (lower panel). Arrows mark activated neurons projecting to the anal nerve revealed by the backfill. Scale bar = 200 μm. D, The approach latency of snails (in seconds) from control, CS-US unpaired, and CS-US paired training groups (n = 7) for different stimuli: CS (carrot), DS (cabbage). The asterisk indicates the significance of the difference in CS stimulus effect between the CS-US paired group and all the other conditions (Mann–Whitney test, Bonferroni corrected p < 0.05). E, IHC images showing the fluorescent staining by the mouse monoclonal antibodies against conserved amino acid regions within human c-Fos protein (red); the general nuclear marker DAPI (blue); the phase contrast microscopy image (green); and a merged image. The images show sections of the PaG network taken from control snails (control), from snails subjected to the behavioral training using taste aversion (CS-US paired, training), and from the unilaterally stimulated semi-intact snail CNS preparations (unilateral stimulation). The arrowheads indicate the location of the giant Pa2 interneuron in control and training experiments. In the unilateral stimulation experiment, the arrowheads show Pa3 interneurons from the stimulated (left) and non-stimulated (right) sides of the PaG network. Scale bar = 50 μm. F, Fluorescence intensity (mean ± SEM) measured in the outlined nuclei of Pa2 neurons from control snails (n = 5) and trained snails (CS-US paired training, n = 5; left), as well as from right non-stimulated (RPa3) and left stimulated (LPa3) Pa3 neurons in the unilateral stimulation experiment (n = 5; right). The asterisk (**) indicates the significance of one-sided Mann–Whitney test, p < 0.005. G, IHC images showing the fluorescent staining by the mouse monoclonal antibodies against conserved amino acid regions within human c-Fos protein (red); the general nuclear marker DAPI (blue); anti-serotonin antibody (5-HT, green); and a merged image. The images show sections containing Pa2 neurons of PaG (upper two panels) and serotoninergic (5-HT-ergic) neurons of PdG (lower two panels) taken from snails subjected to CS-US paired behavioral training (paired) and CS-US unpaired presentations (unpaired). Scale bar = 20 μm. H, Fluorescence intensity (mean ± SEM) measured in the outlined nuclei of Pa2 neurons from snails trained using paired stimuli (CS-US paired training, n = 5) and snails trained using unpaired stimuli (n = 5; upper panel), as well as in serotoninergic neurons from PdG of snails trained using paired and unpaired stimuli (n = 5, lower panel). The symbols indicate the significance of one-sided Mann–Whitney test, **p < 0.005; ns, non-significant.

Tables
Sample ID Experiment Hemisphere Condition Individual Sample1 E1 Right Control 1 Sample2 E1 Left Activated 1 Sample3 E1 Right Control 2 Sample4 E1 Left Activated 2 Sample5 E1 Right Control 3 Sample6 E1 Left Activated 3 Sample7 E1 Left Control 4 Sample8 E1 Right Activated 4 Sample9 E1 Left Control 5 Sample10 E1 Right Activated 5 Sample11 E1 Left Control 6 Sample12 E1 Right Activated 6 Sample13 E2 Right Activated 7 Sample14 E2 Right Control 8 Sample15 E2 Left Activated 8 Sample16 E2 Left Control 9 Sample17 E2 Right Activated 9 Sample18 E2 Right Control 10 Sample19 E2 Left Activated 10 Sample20 E2 Right Control 11 Sample21 E2 Left Activated 11 Sample22 E2 Left Control 12 Sample23 E2 Right Control 13 Sample24 E2 Left Activated 13 Sample ID Read length (nt) Total reads Mapped reads Mapped rate (%) Sample1 100 47132146 28173764 59.78 Sample2 100 10237649 6171779 60.29 Sample3 100 8472972 5174050 61.07 Sample4 100 32281924 19199711 59.48 Sample5 100 11572132 7005917 60.54 Sample6 100 40469603 24695241 61.02 Sample7 100 40876298 24490556 59.91 Sample8 100 19487663 11845560 60.78 Sample9 100 4677121 2798683 59.84 Sample10 100 16178231 9788917 60.51 Sample11 100 4742934 2913221 61.42 Sample12 100 6208915 3810534 61.37 Sample13 100 12194698 7185438 58.92 Sample14 100 15605531 9151020 58.64 Sample15 100 10636031 5895842 55.43 Sample16 100 11168095 6623440 59.31 Sample17 100 1181972 754320 63.82 Sample18 100 26521969 16231015 61.2 Sample19 100 25234534 15249538 60.43 Sample20 100 11450444 6902634 60.28 Sample21 100 38410752 22487496 58.54 Sample22 100 11772575 7275845 61.8 Sample23 100 36248990 21424916 59.1 Sample24 100 17470225 10952305 62.69 Sample ID Total read pairs Read length (nt) SampleO1 31378888 101 SampleO2 31246438 101 SampleO3 26933069 101 SampleO4 28013479 101 SampleK1 13543270 101 SampleK2 24181331 101 SampleK3 28520249 101 SampleK4 45234073 101 SampleS1 4594007 251 SampleS2 2917579 251 SampleS3 5189873 251 Contig ID Sequence of the probe Length GC content 1398029 TCGACCATGCTTTGCTTTTGGCTCCCATTCTGCATCAGAATATTCCG 47 46.81% Gene Primer direction Sequence Product length c-fos Forward 5′-TTACACCCCCA
TTCATCCGC-3′138 Reverse 5′-AATACGTCCCC
AGCGAACTG-3′β-Actin Forward 5′-AGTGCTTGCCT
TGTATGCCT-3′185 Reverse 5′-AACTTAAGCCC
CTTCCTGCC-3′Antibodies Made in Dilution Conjugate Source RRID c-Fos antibody Mouse 1:250 Santa Cruz sc-8047 AB_627253 Santa Cruz sc-166940 AB_10609634 Anti-serotonin Rabbit 1:1000 Sigma-Aldrich S5545 AB_477522 Anti-mouse Horse 1:500 Biotinylated Vector Labs BA-2000 AB_2313581 Anti-rabbit Donkey 1:500 Alexa Fluor 488 Invitrogen A-21206 AB_2535792 Streptavidin 1:500 Alexa Fluor 568 Invitrogen S-11226 AB_2315774 DAPI 1:500 Invitrogen D1306 AB_2629482 RT-qPCR for 5-HT activation experiment (Fig. 4B) Behavioral test for control, unpaired trained and paired trained snails using CS or DS (approach time latency in seconds; Fig. 4D) Control Stimulated Control CS Control DS Unpaired CS Unpaired DS Trained CS Trained DS 5.53 2.99 23.3 60.7 36.7 42 112.7 45.3 2.73 6.5 58.7 57.7 57.7 33.7 112.7 54 1.11 NA 45.3 41.3 41.3 28.7 83 31.3 0.24 3.21 26 64.3 49.3 51.7 109 38.7 0.25 6.03 36.7 34 16.7 39 90.7 60.7 37.3 40.3 44.7 25.3 120 56.3 23.3 28.7 54 51 102.7 66.7 Fluorescence intensity of c-Fos in Pa2 2 h after training (Fig. 4F) Fluorescence intensity of c-Fos in Pa3 after unilateral stimulation (Fig. 4F) Fluorescence intensity of c-Fos in Pa2 2 h after training (Fig. 4H) Fluorescence intensity of c-Fos in serotoninergic neurons 2 h after training (Fig. 4H) Control Trained Stimulated Control Unpaired Paired Unpaired Paired 283.3 819.7 735.7 284.7 603.3 1274.7 355.7 1789 332.7 1223 976 38.7 1449.3 536.3 766.3 1344 71.3 470.3 637 310 1181.7 736 459 1511 131.7 698.3 498.3 214.3 347.7 582.7 788.3 1329.7 328.7 1100.3 844.7 58.7 352.7 339.3 436.3 1082
Extended Data Code 1
The script includes major procedures we used to perform the analyses. It is executed in Shell or R environment. Specifically, this script performed transcriptome assembly, quality examination of the assembled transcriptome, expression level quantification and normalization. Post-quantification analytical steps were also contained in the script, including global pattern exploration by MDS, differential expression analysis, and contig annotation. Download Extended Data 1, TXT file.
Extended Data Figure 1-1
Assessment of snails’ transcriptome assembly. Curves represented empirical cumulative distributions of lengths, GC contents, and ORF percentages of all contigs in the transcriptome assembly. Note contigs longer than 2-k bp were not shown in the length distribution to avoid an elongated tail for visualization. Q1, Q2, and Q3: first, second, and third quartiles, respectively. Download Extended Data 1, TIF file.
Extended Data Figure 1-2
Overall patterns of snail samples. A, B, Global patterns across snail samples revealed by MDS analyses based on the expressed contigs in E1 (A) and E2 (B). Different shapes of dots indicated different individuals in each experiment. Colors showed the two groups: red, activated group; blue, control group. Download Figure 2, TIF file.
Extended Data Figure 3-1
Expression regulation of 37 consistently annotated proteins. Heat map showing the log2-transformed fold changes between activated and control samples in E1 and E2 for all contigs corresponding to the 37 consistently annotated proteins derived from the annotation of DE contigs. Protein names colored in red indicated the 20 proteins with more than 80% of their contigs showing upregulation in activated samples. Download Figure 3-1, TIF file.
In this issue


