

Article Figures & Data
Figures
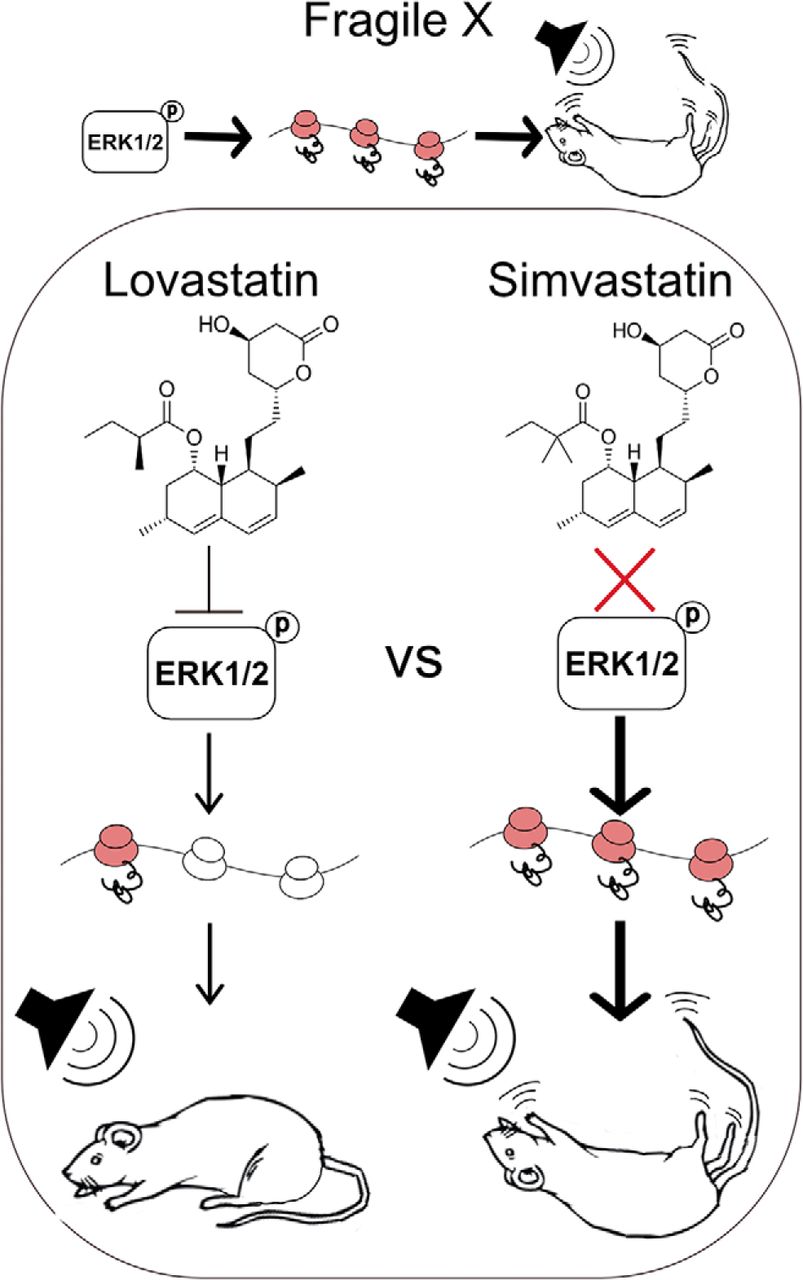
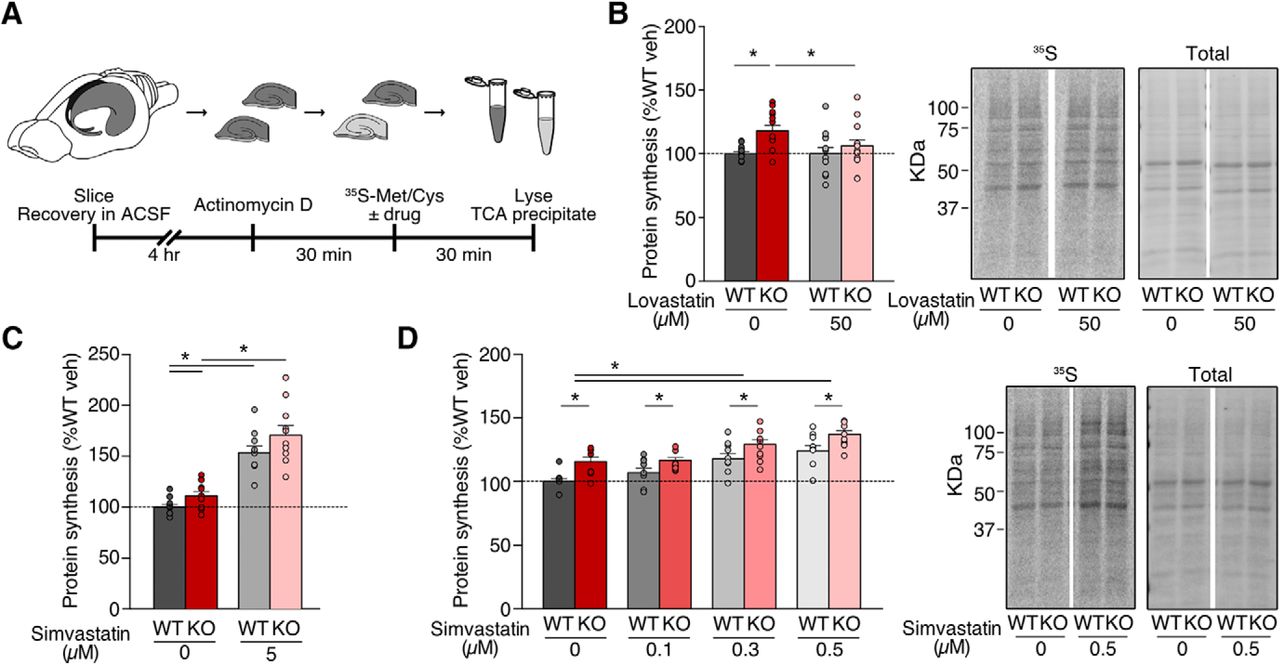
- Figure 1.
Simvastatin exaggerates excessive protein synthesis in the Fmr1-/y hippocampus. Slices were prepared from WT and Fmr1-/y hippocampi and incubated in vehicle, lovastatin, or simvastatin at different concentrations. A, Schematic shows time course for metabolic labeling experiments of hippocampal slices. B, Lovastatin significantly decreases protein synthesis in Fmr1-/y slices to WT levels (ANOVA genotype *p = 0.0106; Sidak’s WT veh vs KO veh *p = 0.0032, KO veh vs KO lova *p = 0.0368; n = 12). C, Simvastatin raises protein synthesis in both WT and Fmr1-/y slices at 5 μM (ANOVA treatment *p < 0.0001, genotype *p = 0.0294; Sidak’s WT veh vs 5 μM *p = 0.0001, KO veh vs 5 μM *p < 0.0001; n = 10). D, Simvastatin raises protein synthesis at 0.1–0.5 μM, exaggerating the excessive protein synthesis phenotype (ANOVA treatment *p < 0.0001, genotype *p = 0.0068; Sidak’s WT veh vs 0.3 μM *p = 0.0002, WT veh vs 0.5 μM *p < 0.0001, KO veh vs 0.3 μM *p = 0.0035, KO veh vs 0.5 μM *p < 0.0001, WT veh vs KO veh *p = 0.0005, WT 0.1 μM vs KO 0.1 μM *p = 0.0406, WT 0.3 μM vs KO 0.3 μM *p = 0.0115, WT 0.5 μM vs KO 0.5 μM *p = 0.0038; n = 9). Representative samples were run on SDS-PAGE gels and transferred to membranes. Example phosphorimages of 35S-labeled proteins and total protein staining of the same membrane are shown. Error bars = SEM. N = littermate pairs. Figure Contributions: Melania Muscas and Susana R. Louros performed the experiments and analyzed the data.
- Figure 2.
Simvastatin does not reduce ERK1/2 or mTORC1 activation in the Fmr1-/y hippocampus. A, Diagram shows the potential impact of simvastatin on Ras-ERK1/2 and Rheb-mTOR-signaling pathways. B, Fmr1-/y slices incubated with 50 µM lovastatin show a significant reduction in ERK1/2 phosphorylation (ANOVA genotype *p = 0.0146; Sidak’s KO veh vs KO lova *p = 0.0048; n = 19). C, Simvastatin treatment does not reduce ERK1/2 phosphorylation in Fmr1-/y or WT slices (ANOVA treatment p = 0.8761, genotype p = 0.7010; n = 11). D, Simvastatin treatment does not reduce phosphorylation of p70S6K in WT or Fmr1-/y slices (ANOVA treatment p = 0.6206, genotype p = 0.2860; n = 10). Representative bands were cropped from original blots as indicated by blank spaces. Original blots are shown in Extended Data Figure 2-1. Error bars = SEM. N = littermate pairs. Figure Contributions: Melania Muscas performed the experiments and analyzed the data.


Tables
Figure Data structure Statistical test Sample size Statistical data Figure 1B, metabolic labelling of protein synthesis with 50 μM lovastatin/vehicle Normally distributed Two-way RM ANOVA N = 12per group Genotype: p = 0.0106 WT veh vs Fmr1 KO veh Normally distributed Sidak’s post hoc N = 12per group CI: –0.2916 to –0.06786, p = 0.0032 WT 50 μM lovastatin vs Fmr1 KO 50 μM lovastatin Normally distributed Sidak’s post hoc N = 12per group CI: –0.1716 to 0.05214, p = 0.3516 Fmr1 KO vehicle vs Fmr1 KO 50 μM lovastatin Normally distributed Sidak’s post hoc N = 12per group CI: 0.007476 to 0.2312, p = 0.0368 Figure 1C, metabolic labelling of protein synthesis with 1–5 μM simvastatin/vehicle Normally distributed Two-way RM ANOVA N = 10per group Treatment:p < 0.0001, genotype: p = 0.0294 WT veh vs KO veh Normally distributed Sidak’s post hoc N = 10per group CI: –0.3188 to 0.09835, p = 0.3451 WT veh vs KO veh Normally distributed Paired t test N = 10per group CI: 0.008558 to 0.2119, p = 0.0366 WT veh vs WT 5 μM simvastatin Normally distributed Sidak’s post hoc N = 10per group CI: –0.7435 to –0.3263, p = 0.0001 Fmr1 KO veh vs Fmr1 KO 5 μM simvastatin Normally distributed Sidak’s post hoc N = 10per group CI: –0.8045 to –0.3873, p < 0.0001 Figure 1D, metabolic labelling of protein synthesis with 0.1–0.5 μM simvastatin/vehicle Normally distributed Two-way RM ANOVA N = 9per group Treatment: p < 0.0001, genotype: p = 0.0068 WT veh vs Fmr1 KO veh Normally distributed Sidak’s post hoc N = 9per group CI: –0.2483 to –0.06400, p = 0.0005 WT veh vs WT 0.3 μM simvastatin Normally distributed Sidak’s post hoc N = 9per group CI: –0.2760 to –0.07980, p = 0.0002 WT veh vs WT 0.5 μM simvastatin Normally distributed Sidak’s post hoc N = 9per group CI: –0.3394 to –0.1432,p < 0.0001 Fmr1 KO veh vs Fmr1 KO 0.3 μM simvastatin Normally distributed Sidak’s post hoc N = 9per group CI: –0.2334 to –0.03724,p = 0.0035 Fmr1 KO veh vs Fmr1 KO 0.5 μM simvastatin Normally distributed Sidak’s post hoc N = 9per group CI: –0.3121 to –0.1159,p < 0.0001 WT 0.1 μM simvastatin vs Fmr1 KO 0.1 μM simvastatin Normally distributed Sidak’s post hoc N = 9per group CI: –0.1874 to –0.003152,p = 0.0406 WT 0.3 μM simvastatin vs Fmr1 KO 0.3 μM simvastatin Normally distributed Sidak’s post hoc N = 9per group CI: –0.2057 to –0.02143,p = 0.0115 WT 0.5 μM simvastatin vs Fmr1 KO 0.5 μM simvastatin Normally distributed Sidak’s post hoc N = 9per group CI: –0.2210 to –0.03669,p = 0.0038 Figure 2B, phospho/total ERK1/2 with 50 μM lovastatin/vehicle Normally distributed Two-way RM ANOVA N = 19per group Genotype: p = 0.0146 (Continued) WT veh vs Fmr1 KO veh Normally distributed Sidak’s post hoc N = 19per group CI: –0.02577 to 0.1893,p = 0.1539 Fmr1 KO veh vs Fmr1 KO lovastatin Normally distributed Sidak’s post hoc N = 19per group CI: 0.04797 to 0.2630,p = 0.0048 Figure 2C, phospho/total ERK1/2 with 0.1–0.5 μM simvastatin/vehicle Normally distributed Two-way RM ANOVA N = 11per group Genotype: p = 0.7010, treatment: p = 0.8761 Figure 2D, phospho/total p70S6K with 0.1–0.5 μM simvastatin/vehicle Normally distributed Two-way RM ANOVA N = 10per group Genotype: p = 0.2860, treatment: p = 0.6206 Figure 3B, AGS incidence with 3 mg/kg simvastatin WT veh vs Fmr1 KO veh Non-normal distribution Two-tailed Fisher’s exact test N = 12per group CI: 0.002672 to 0.3437, p = 0.0028 WT simvastatin vs Fmr1 KO simvastatin Non-normal distribution Two-tailed Fisher’s exact test N = 12per group CI: 0.002918 to 0.3808, p = 0.0028 Fmr1 KO veh vs Fmr1 KO simvastatin Non-normal distribution Two-tailed Fisher’s exact test N = 12per group CI: 0.1915 to 5.221, p > 0.9999 Figure 3C, AGS severity distribution scores with 3 mg/kg simvastatin WT veh vs Fmr1 KO veh Non-normal distribution Mann–Whitney test N = 12per group CI: 0.000 to 2.000, p = 0.0028 Fmr1 KO veh vs Fmr1 KO simvastatin Non-normal distribution Mann–Whitney test N = 12per group CI: –1.000 to 1.000, p = 0.9510 Figure 3D, AGS latency with 3 mg/kg simvastatin Fmr1 KO veh vs Fmr1 KO simvastatin Normally distributed Unpaired two-tailed t test N = 12per group CI: –11.56 to 43.11,p = 0.2388 Figure 3E, AGS incidence with 50 mg/kg simvastatin WT veh vs Fmr1 KO veh Non-normal distribution Two-tailed Fisher’s exact test KO veh: n = 14WT veh: n = 12 CI: 0.004960 to 0.5143, p = 0.0053 WT simvastatin vs Fmr1 KO simvastatin Non-normal distribution Two-tailed Fisher’s exact test KO simva: n = 11WT simva:n = 13 CI: 0.006556 to 0.7356, p = 0.0233 Fmr1 KO veh vs Fmr1 KO simvastatin Non-normal distribution Two-tailed Fisher’s exact test KO veh: n = 14 KO simva: n = 11 CI: 0.2988 to 7.531, p = 0.6968 Figure 3F, AGS severity scores with 50 mg/kg simvastatin WT veh vs Fmr1 KO veh Non-normal distribution Mann–Whitney test KO veh: n = 14WT veh: n = 12 CI: 0.000 to 3.000, p = 0.0036 Fmr1 KO veh vs Fmr1 KO simvastatin Non-normal distribution Mann–Whitney test KO veh: n = 14 KO simva: n = 11 CI: –3.000 to 0.000, p = 0.2254 Figure 3G, AGS latency with 50 mg/kg simvastatin Fmr1 KO veh vs Fmr1 KO simvastatin Normally distributed Unpaired two-tailed t test KO veh: n = 14 KO simva: n = 11 CI: –11.41 to 8.739,p = 0.7794 Figure 3H, AGS incidence with 100 mg/kg lovastatin WT veh vs Fmr1 KO veh Non-normal distribution Two-tailed Fisher’s exact test KO veh: n = 16WT veh: n = 15 CI: 0.01126 to 0.4341, p = 0.0032 WT lovastatin vs Fmr1 KO lovastatin Non-normal distribution Two-tailed Fisher’s exact test KO lova: n = 14WT lova:n = 17 CI: 0.06948 to 3.440, p = 0.6358 (Continued) Fmr1 KO veh vs Fmr1 KO lovastatin Non-normal distribution Two-tailed Fisher’s exact test KO veh: n = 16 KO lova: n = 14 CI: 1.538 to 42.32, p = 0.0136 Figure 3I, AGS severity distribution scores with 100 mg/kg lovastatin WT veh vs Fmr1 KO veh Non-normal distribution Mann–Whitney test KO veh: n = 16n = WT veh: n = 15 CI: 0.000 to 3.000, p = 0.0064 Fmr1 KO veh vs Fmr1 KO lovastatin Non-normal distribution Mann–Whitney test KO veh: n = 16 KO lova: n = 14 CI: –3.000 to 0.000, p = 0.0204 Figure 3J, AGS latency with 100 mg/kg lovastatin Fmr1 KO veh vs Fmr1 KO simvastatin Normally distributed Unpaired two-tailed t test KO veh: n = 16 KO lova: n = 14 CI: 3.595 to 31.07,p = 0.0176
In this issue


