

Article Figures & Data
Figures
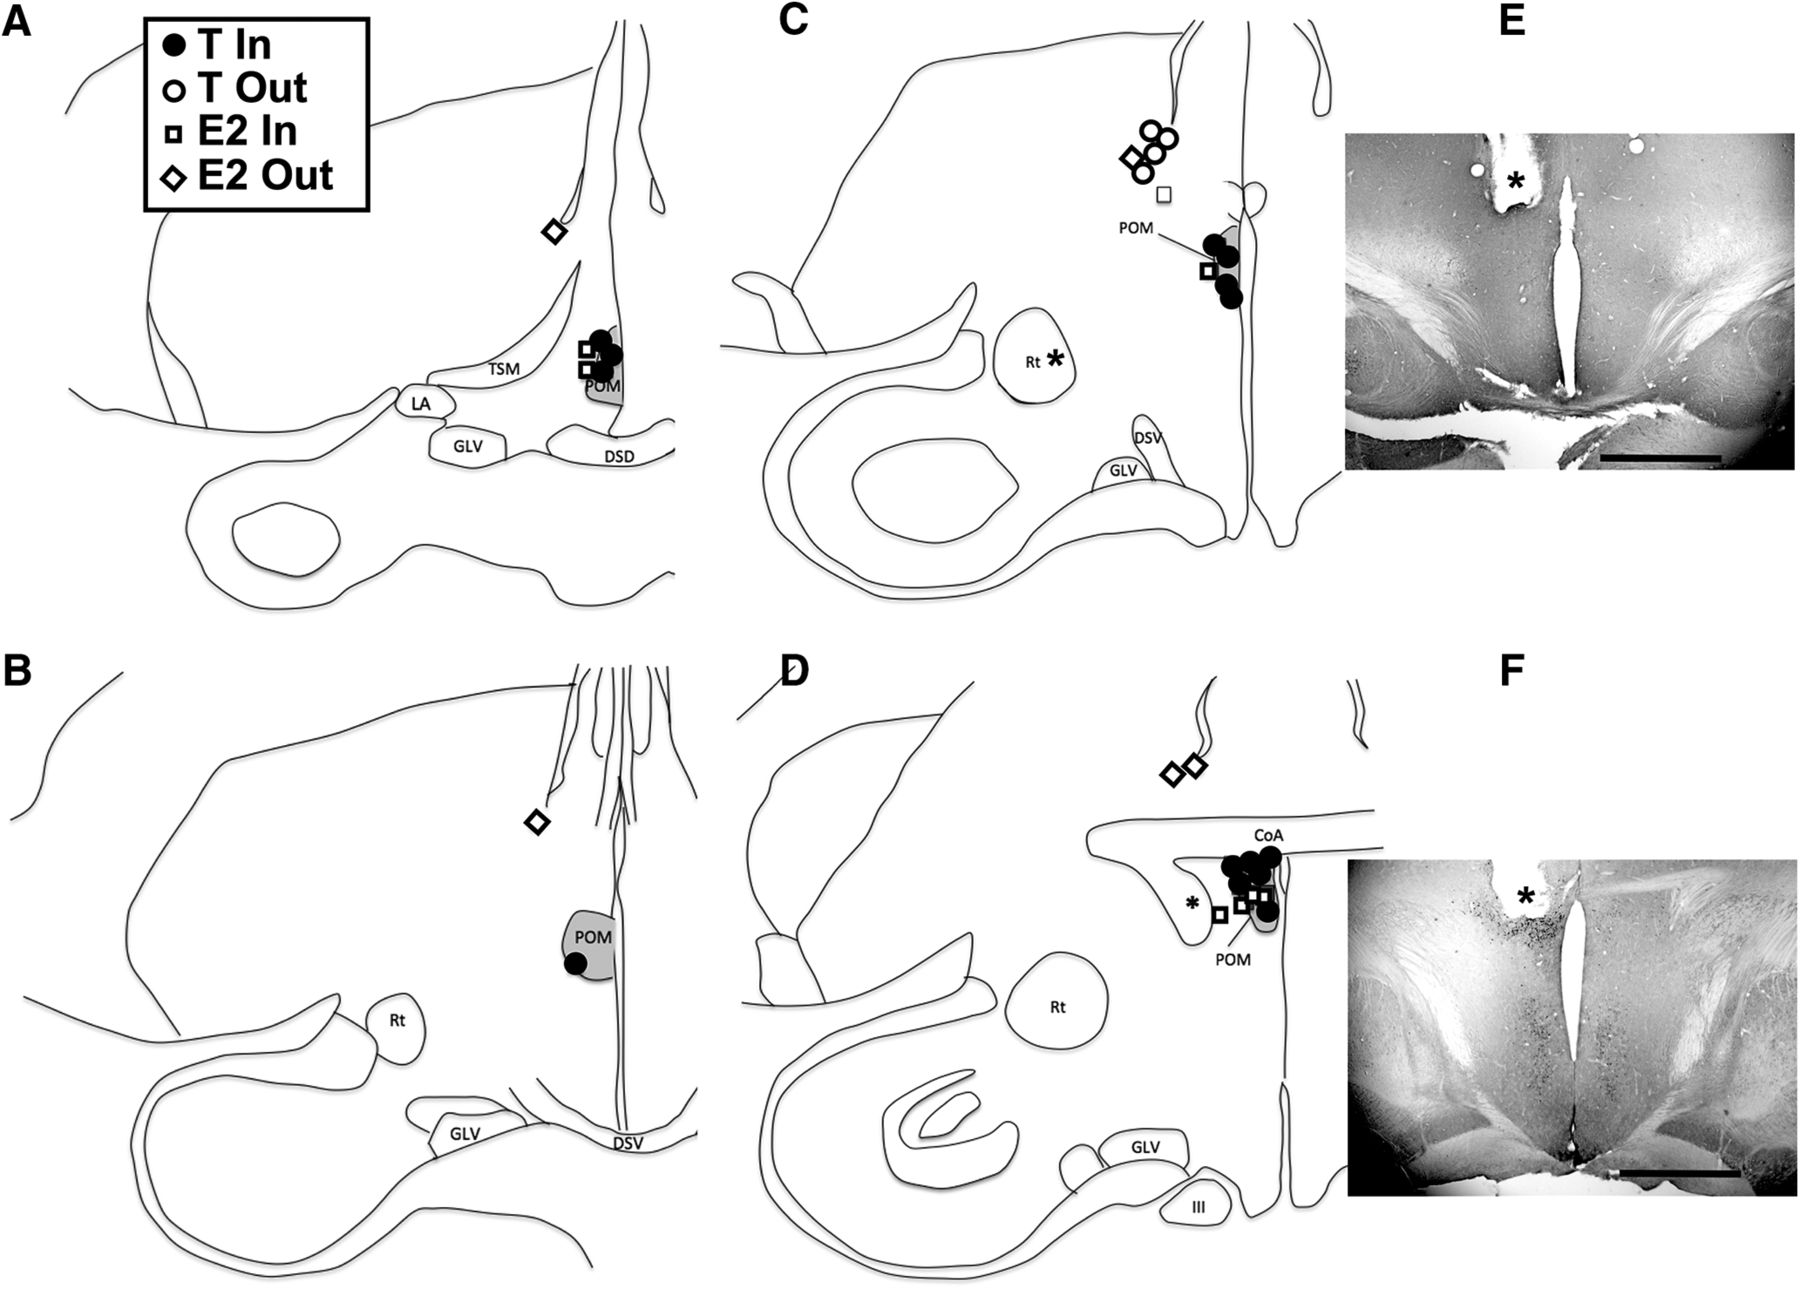
- Figure 1.
Semi-schematic maps illustrating the implant locations and their content. Panels A–D are presented in a rostral to caudal order. The inset shows the content of the implants (T or E2) and whether they were considered to be located in or out of POM. One E2 implant associated with an asterisk was considered in POM but was located in a plane caudal to the plane illustrated in D. E, F, Photomicrographs of two brain sections immunostained for aromatase, one with an implant outside (dorsal) to POM (E) and one with an implant within the boundaries of the nucleus (F). The asterisk indicates the tip of the implant and the magnification bar is 1 mm in both cases. The induction of aromatase in the POM by T is clearly visible at the tip of the implant in F. III: third nerve (nervus oculomotorius); CoA: commissura anterior; DSD: decussatio supraoptica dorsalis; DSV: decussatio supraoptica ventralis; GLV: nucleus geniculatus lateralis, pars ventralis; LA: nucleus lateralis anterior thalami; POM: medial preoptic nucleus (nucleus preopticus medialis); Rt: nucleus rotundus; TSM: tractus septopallio-mesencephalicus. Figure Contributions: Laura Vandries, Samar Ghorbanpoor, and Gilles Cornez performed the experiment. Laura Vandries and Jacques Balthazart analyzed the data.
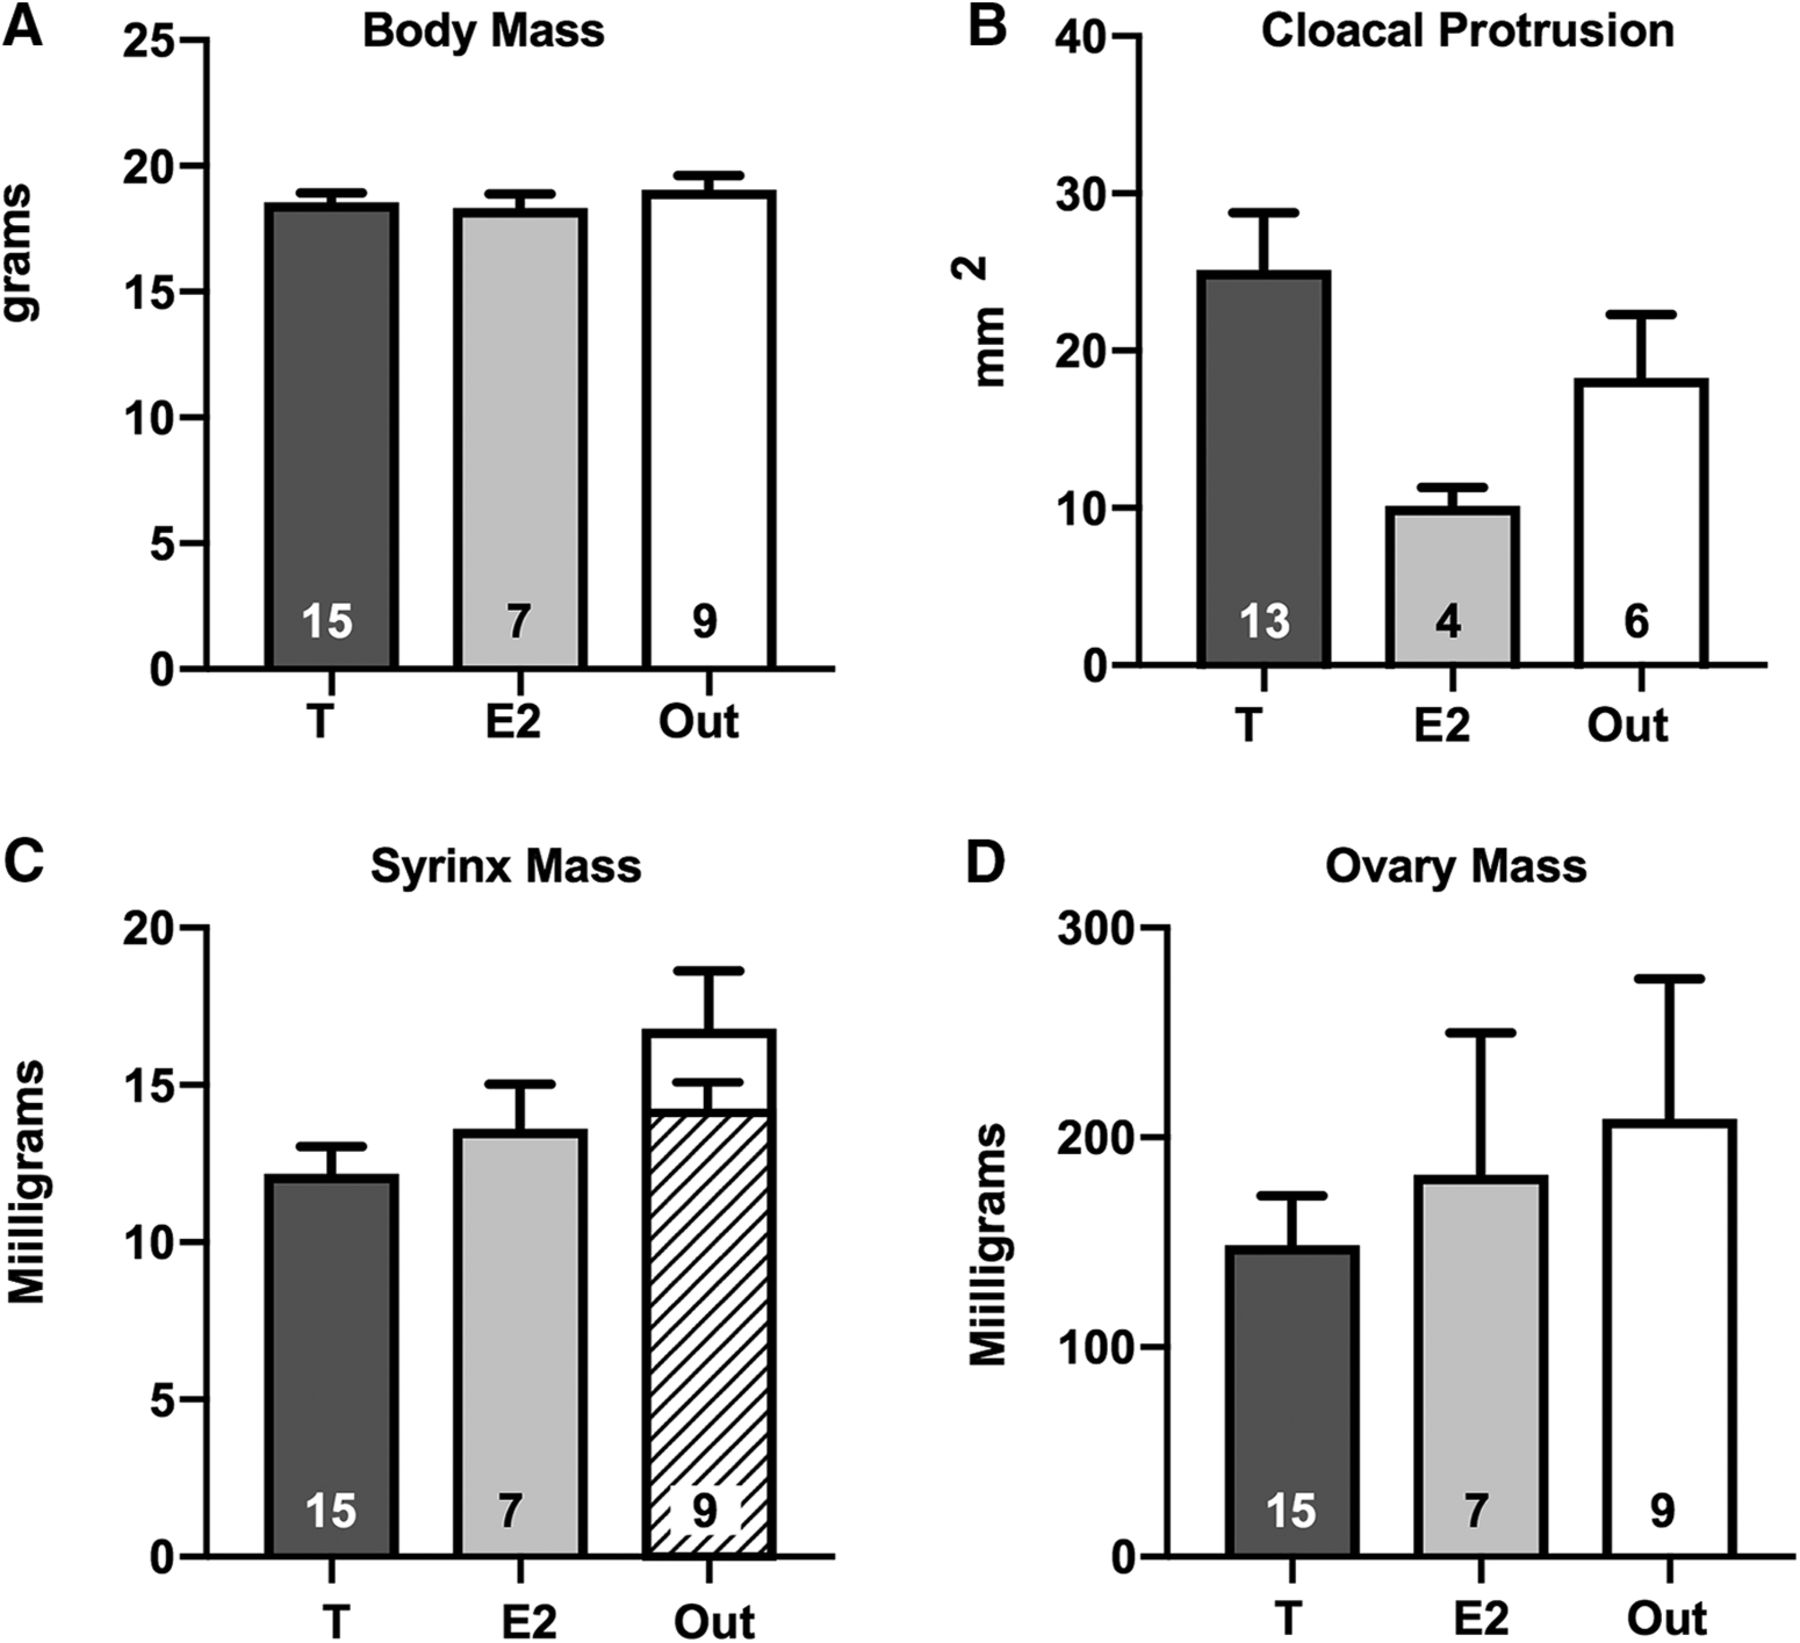
- Figure 2.
Mean ± SEM of all morphologic measures collected in the three groups of females at the end of the experiment. No significant difference could be detected among the three groups in body mass (A), cloacal protrusion (B), nor ovary mass (D) except for syrinx mass (C), but this difference disappears when two outliers in the Out group are removed (hatched bar; see text). The number of available data points is indicated in each case at the bottom of the corresponding bar. Figure Contributions: Laura Vandries, Samar Ghorbanpoor, Gilles Cornez, and Olesya Shevchouk performed the experiment. Laura Vandries and Jacques Balthazart analyzed the data.
- Figure 3.
Representative sonograms illustrating the songs produced by females treated with T or E2 implanted in or out of POM. Birds in the Out group only produced very short songs, usually consisting in the repetition of a single syllable (A, B). E2 (C–E) or T (F–H) implanted in POM increased the duration of some but not all songs that consisted in some cases of multiple syllables. H, One of the most complex songs seen in the T in POM groups. Figure Contributions: Laura Vandries, Gilles Cornez, and Jacques Balthazart analyzed the data.
- Figure 4.
Summary of all measures of songs produced during 2 h of recording on days (d) 7, 14, and 28 after implantation of the steroids in the brain. The figure shows from top left to bottom right the number of songs per recording session of 2 hours (A), the average duration of these songs (B), the percentage of time that females spent singing (C) and then the maximum frequency (D), the 90% range of the bandwith (E) and the average entropy (F) of these songs. Data were analyzed by two-way GLM mixed-effect analysis with the three groups as independent factor and the three recording days as repeated factor and the results are schematically reported above each graph (Trt, treatment; time, time after implantation; Int, interaction; *p < 0.05). Significant effects were followed by post hoc Tukey tests whose results are indicated by letters above the bars (a = p < 0.05 compared to the corresponding Out group). The asterisk above a bar refers to time effects and indicates a significant difference with the D7 point. The number of available data points is indicated in each case at the bottom of the corresponding bar. Figure Contributions: Laura Vandries and Jacques Balthazart analyzed the data.
- Figure 5.
Mean (±SEM) volumes of the POM as identified by the dense cluster of ARO-ir cells (A), and of nucleus HVC as identified in Nissl-stained sections (B) and by the dense cluster of DCX-ir cells (C) in females treated with T or E2 implanted in or out of POM on the ipsilateral (left bar in each pair) or contralateral (right bar in each pair) side. Data were analyzed by two-way GLM mixed-effect analysis with the three groups as independent and the two sides of the brain as repeated factor and the results are schematically reported above each graph (TRT, treatment; SIDE, brain side with respect to the implant; INT, interaction; **p < 0.01, ***p < 0.001). Results of Tukey post hoc tests comparing the three groups on each brain side are indicated by letters (a,b = p < 0.05 compared to the Out and E2 group, respectively, on the same brain side). The number of available data points is indicated in each case at the bottom of the corresponding bar. Figure Contributions: Laura Vandries, Samar Ghorbanpoor, and Olesya Shevchouk performed the experiment. Laura Vandries and Jacques Balthazart analyzed the data.
- Figure 6.
Representative photomicrographs of the preoptic area (A, B) or of the song control nucleus HVC (C, D) illustrating the main experimental effects. Panels in the top row show the preoptic area stained for aromatase in a female with a T implant on the right side showing the aromatase induction (A) or in a female of the Out group showing basal aromatase expression (B). Panels in the bottom row show nucleus HVC stained for DCX in a female with a T implant in POM (C) and an Out bird (D) illustrating the increase by T in POM of the density of DCX-ir cells in HVC. Magnification bars are 500 µm in both cases and refer to both panels on the same row. Figure Contributions: Laura Vandries and Samar Ghorbanpoor performed the experiment. Laura Vandries and Jacques Balthazart analyzed the data.
- Figure 7.
Correlation between the volumes of HVC as measured in Nissl-stained sections (B) and by the dense cluster of DCX-ir cells. Data were separately analyzed for volumes measured on the side ipsilateral or contralateral side to the steroid implants. The graph illustrates the significant regression line and the 95% confidence intervals. Figure Contributions: Laura Vandries and Jacques Balthazart analyzed the data.
- Figure 8.
Mean (±SEM) densities (numbers/mm3) of fusiform (A, C, E) and multipolar (B, D, F) DCX-ir cells in HVC (A, B) and in area directly ventral (C, D) or lateral (E, F) to this nucleus in the three experimental groups on the brain side ipsilateral and contralateral to the steroid implants. Data were analyzed by two-way GLM mixed-effect analysis with the three groups as independent and the two sides of the brain as repeated factor and the results are schematically reported above each graph (TRT, treatment; SIDE, brain side relative to implant; INT, interaction; *p < 0.05). Significant effects of treatments were followed by Tukey post hoc tests whose results are expressed as follows: b = p < 0.05 by comparison with the E2 group. The number of available data points is indicated in each case at the bottom of the corresponding bar. Figure Contributions: Laura Vandries, Samar Ghorbanpoor, and Olesya Shevchouk performed the experiment. Laura Vandries and Jacques Balthazart analyzed the data.
- Figure 9.
Mean (±SEM) densities (numbers/mm3) of PNN (A), of PV-ir cells (B), of PV-ir cells surrounded by PNN (C) and percentage of PNN present around PV-ir cells (D) in the three experimental groups on the side ipsilateral and contralateral side to the steroid implants. Data were analyzed by two-way GLM mixed-effect analysis with the three groups as independent and the two sides of the brain as repeated factor and the results are schematically reported above each graph (TRT, treatment; SIDE, brain side relative to implant; INT, interaction). No significant effect was detected. The number of available data points is indicated in each case at the bottom of the corresponding bar. Figure Contributions: Laura Vandries and Gilles Cornez performed the experiment. Laura Vandries and Jacques Balthazart analyzed the data.


Tables
- Table 1.
Mean ± SEM and number of observations for each separate set of out data (T and E2 birds), and results of the two-way GLM mixed-effect analysis of these data (F and associated probabilities)
Variable T out E2 out T vs E2 Days Interaction Mean ± SEM (n) Mean ± SEM (n) F, p F, p F, p Number of songs D7 27.7 ± 17.6 (4) 122 ± 57 (5) D14 37.5 ± 30.8 (4) 83.8 ± 38.9 (5) D28 31.7 ± 12.3 (4) 17.0 ± 11.9 (5) F = 1.204,
p = 0.308F = 1.783,
p = 0.216F = 1.961,
p = 0.177Song duration D7 0.34 ± 0.11 (4) 0.28 ± 0.12 (5) D14 0.35 ± 1.12 (4) 0.39 ± 0.10 (5) D28 0.44 ± 0.02 (4) 0.28 ± 0.11 (5) F = 0.245,
p = 0.629F = 0.303,
p = 0.674F = 0.809,
p = 0.465% Time singing D7 0.41 ± 0.22 (4) 1.61 ± 0.77 (5) D14 0.53 ± 0.38 (4) 1.13 ± 0.52 (5) D28 0.40 ± 0.17 (4) 0.22 ± 0.15 (5) F = 1.123,
p = 0.324F = 2.013,
p = 0.187F = 1.792,
p = 0.203Maximum frequency D7 3553 ± 328 (3) 4095 ± 239 (3) D14 3580 ± 342 (3) 3727 ± 439 (4) D28 3972 ± 403 (4) 4176 ± 213 (3) F = 0.189,
p = 0.678F = 0.682,
p = 0.484F = 0.519,
p = 0.614Bandwidth D7 1104 ± 167 (3) 1885 ± 834 (3) D14 1128 ± 97(3) 2156 ± 1185 (4) D28 947 ± 141 (4) 1268 ± 329 (3) F = 1.036,
p = 0.348F = 0.499,
p = 0.612F = 0.349,
p = 0.715Mean entropy D7 2.98 ± 0.21 (3) 3.29 ± 0.39 (3) D14 2.85 ± 0.24 (3) 2.93 ± 0.15 (4) D28 2.74 ± 0.16 (4) 2.92 ± 0.10 (3) F = 0.524,
p = 0.496F = 4.037,
p = 0.128F = 1.875,
p = 0.245Variable T out E2 out T vs E2 ipsilateral-contralateral Interaction POM volume ipsilateral
contralateral0.06 ± 0.01 (4)
0.05 ± 0.01 (4)0.02 ± 0.02 (3)
0.02 ± 0.01 (3)F = 3.022, p = 0.142 F = 0.811,
p = 0.408F = 0.227,
p = 0.653HVC volume Nissl ipsilateral
contralateral0.10 ± 0.02 (4)
0.11 ± 0.02 (4)0.14 ± 0.02 (4)
0.12 ± 0.02 (4)F = 0.810, p = 0.403 F = 0.516,
p = 0.499F = 1.507,
p = 0.265HVC volume DCX ipsilateral
contralateral0.11 ± 0.03 (4)
0.10 ± 0.02 (4)0.10 ± 0.02 (5)
0.10 ± 0.01 (5)F = 0.053, p = 0.824 F = 1.032,
p = 0.343F = 0.002,
p = 0.967Fusiform DCX in HVC ipsilateral
contralateral86.2 ± 12.3 (4)
64.5 ± 10.7 (4)56.0 ± 6.9 (5)
53.6 ± 4.6 (5)F = 3.559, p = 0.101 F = 5.143,
p = 0.058F = 3.302,
p = 0.112Multipolar DCX in HVC ipsilateral
contralateral152.0 ± 35.2 (4)
142.0 ± 30.7 (4)151.4 ± 9.7 (5)
144.4 ± 8.0 (5)F = 0.001, p = 0.976 F = 1.715
p = 0.232F = 0.053,
p = 0.824Fusiform DCX vtr. HVC ipsilateral
contralateral11.2 ± 3.1 (4)
10.0 ± 2.6 (4)7.8 ± 0.8 (5)
7.8 ± 2.6 (5)F = 1.099, p = 0.329 F = 0.110,
p = 0.750F = 0.110,
p = 0.750Multipolar DCX vtr. HVC ipsilateral
contralateral19.0 ± 3.8 (4)
18.5 ± 2.6 (4)23.0 ± 2.8 (5)
21.4 ± 2.1 (5)F = 1.255, p = 0.300 F = 0.161,
p = 0.700F = 0.044,
p = 0.839Fusiform DCX lat. HVC ipsilateral
contralateral13.0 ± 3.5 (4)
13.2 ± 2.5 (4)7.4 ± 0.7 (5)
10.8 ± 2.4 (5)F = 1.848, p = 0.216 F = 1.401,
p = 0.275F = 1.043,
p = 0.341Multipolar DCX lat. HVC ipsilateral
contralateral8.0 ± 1.3 (4)
6.5 ± 1.0 (4)7.8 ± 1.5 (5)
8.6 ± 1.3 (5)F = 0.369, p = 0.562 F = 0.123,
p = 0.736F = 1.332,
p = 0.286PNN density ipsilateral
contralateral36.7 ± 7.0 (3)
58.0 ± 22.1(3)34.8 ± 20.4 (5)
46.4 ± 22.6 (5)F = 0.070, p = 0.800 F = 0.835,
p = 0.396F = 0.072,
p = 0.796PV-ir density ipsilateral
contralateral106.3 ± 17.1 (3)
104.0 ± 0.0 (3)116.6 ± 17.6 (5)
143.0 ± 25.7 (5)F = 1.289, p = 0.278 F = 0.308,
p = 0.589F = 0.439,
p = 0.520PV+PNN density ipsilateral
contralateral6.0 ± 3.5 (3)
11.3 ± 3.9 (3)7.6 ± 6.4 (5)
10.4 ± 4.6 (5)F = 0.003, p = 0.957 F = 0.618,
p = 0.462F = 0.059,
p = 0.815% PNN with PV ipsilateral
contralateral21.3 ± 14.9 (3)
22.7 ± 5.4 (3)2.2 ± 2.2 (5)
44.4 ± 23.1 (5)F = 0.006, p = 0.938 F = 1.744,
p = 0.213F = 1.537,
p = 0.238
In this issue


