

Article Figures & Data
Figures
- Figure 1.
Model simulations showing that error minimization leads to an optimal target-response gain <1. A, Mean absolute error (Eq. 2) as a function of the response gain for three different target ranges [ΔT±50° (yellow), ΔT±30° (red), and ΔT±15° (blue)], with additive, p(ε) = N(0,σε) Gaussian noise. Simulations were obtained by uniformly randomly picking 200 target locations from each target range and generating responses according to Equation 1 for 141 gains g ranging from 0 to 1.4 with a fixed additive noise standard deviation of 10.0°. The mean absolute error is determined for every simulation according to Equation 2. The simulation was repeated 1000 times for each gain, to obtain the average (indicated by bold colored curves) mean absolute error and its standard deviation (indicated by the colored patches). The minimum average mean absolute error is obtained for gains <1. The optimal gains systematically vary with target range (vertical lines). The highest optimal gain (g = 0.89) is found for the largest target range, for which the absolute error varies strongest with gain. B, Single simulations of stimulus-response relations (Eq. 1) for three target ranges at their respective optimal response gains.
- Figure 2.
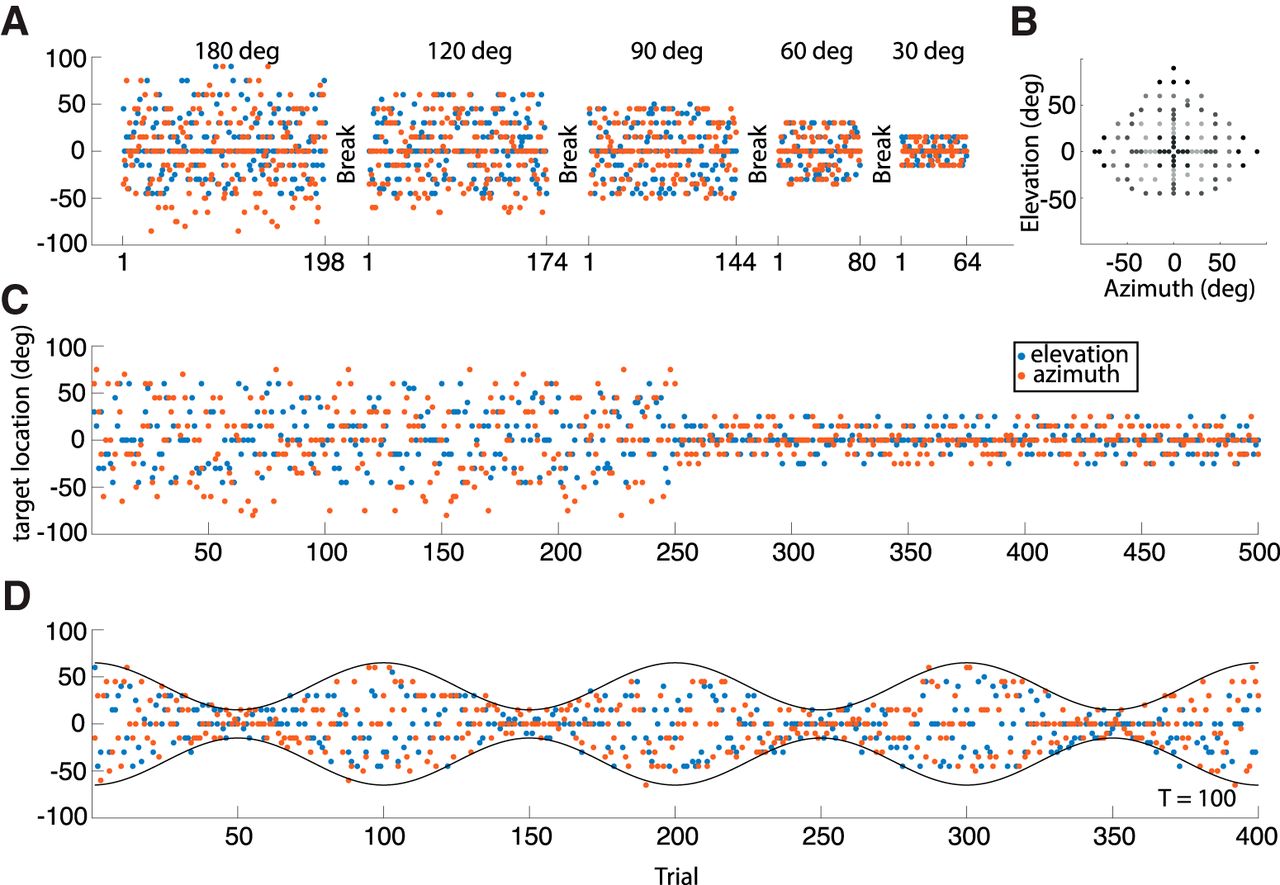
Experimental paradigms. A, C, D, Colored dots indicate stimulus positions, for azimuth (red) and elevation (blue), as a function of trial number. A, Experiment 1: five target blocks, shown in descending order of target-range. B, Distribution of all speakers in the experimental room in double-pole azimuth-elevation coordinates. C, Experiment 2: after 250 trials, the stimulus range acutely changed from a large (±55°) to a small (±25°) range (as shown), or vice versa. D, Experiment 3: the stimulus range changed in a sinusoidal way throughout the experiment (400 trials) from large (±60°) to small (±15°), or vice versa. The panel shows a repetition period p = 100 trials, and phase ϕ = 0.
- Figure 3.
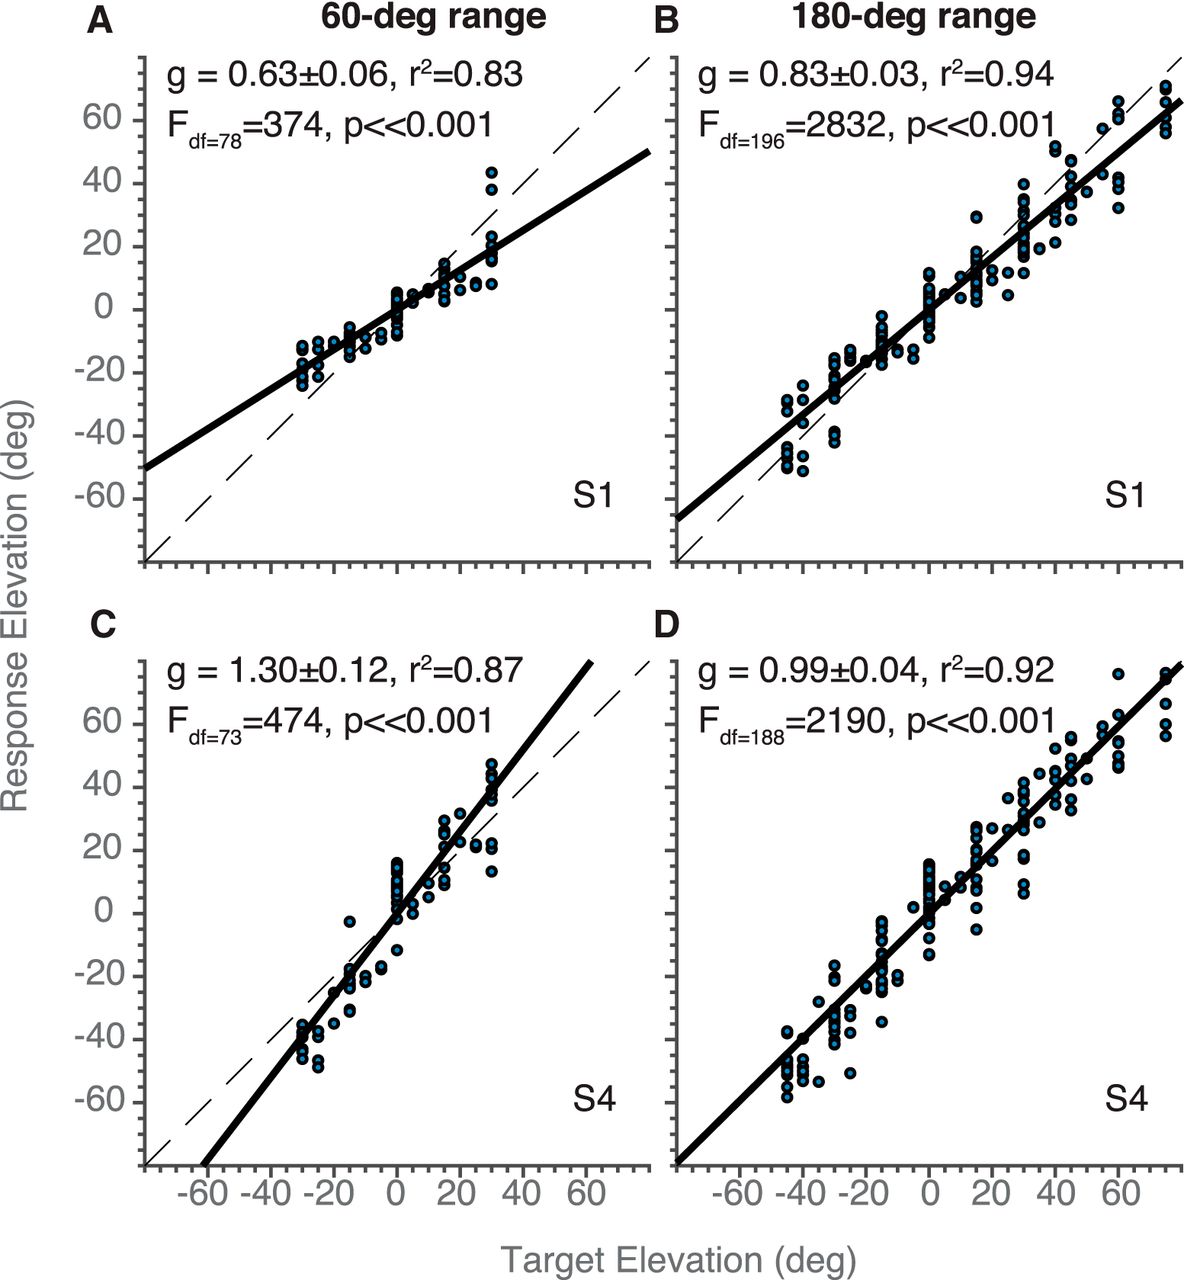
Example stimulus-response plots for experiment 1. Stimulus response plots in elevation for participant S1 (A, B) and S4 (C, D), for the (A, C) 60° and (B, D) 180° target-range blocks presented in decreasing order. Filled circles denote individual localization responses, the black solid line represents the best-fit regression line (Eq. 4), with g the response gain of the fit; the dashed lines indicate the perfect stimulus-response relation (x = y). The insert text depicts the fitted gain, g, including its 95% confidence interval, the r2 between data and fit, and the F and p values for the linear fit, including the degrees of freedom.
- Figure 4.
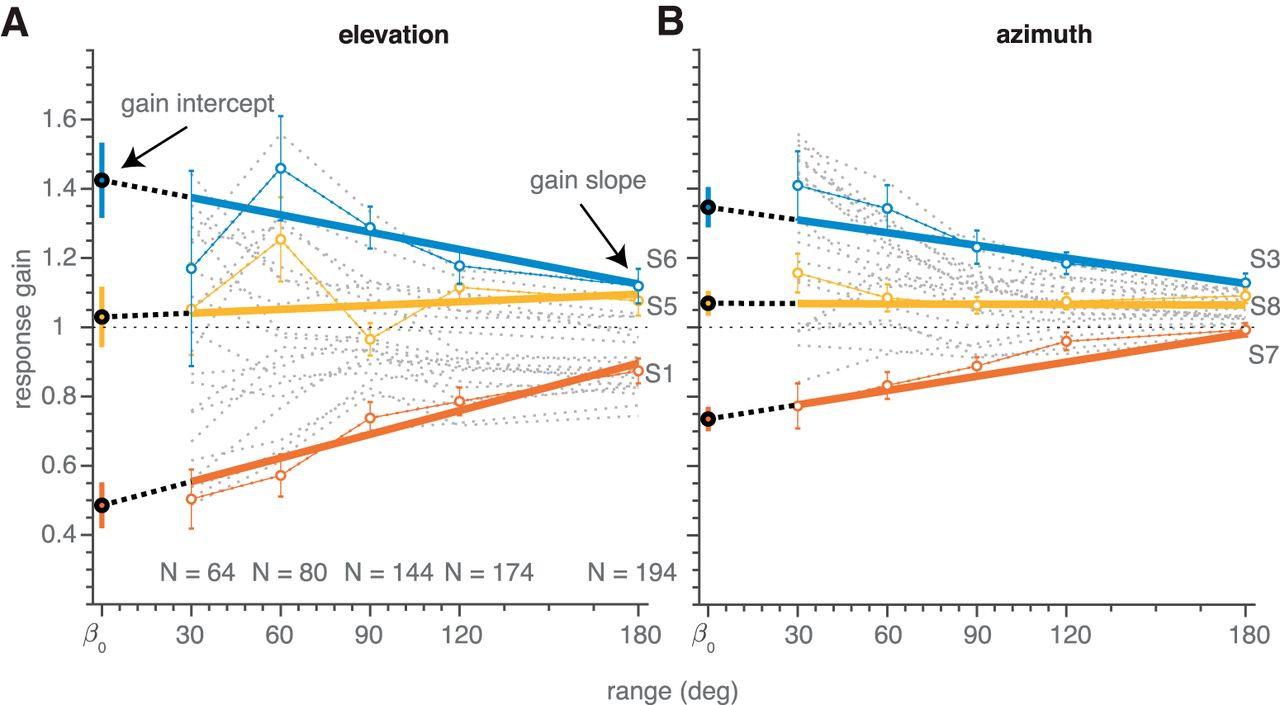
Gain dependence on target range in Experiment 1. Localization gains for all subjects (gray dotted lines) for elevation (A) and azimuth (B) components determined for each target range. Connected colored open circles denote the localization gains for three representative subjects; error bars indicate the 95% confidence interval. Bold colored lines denote the best fit regression lines of Equation 6 through the data of these subjects. Color-filled circles on the ordinate indicate the gain intercepts (β0; Eq. 6).
- Figure 5.
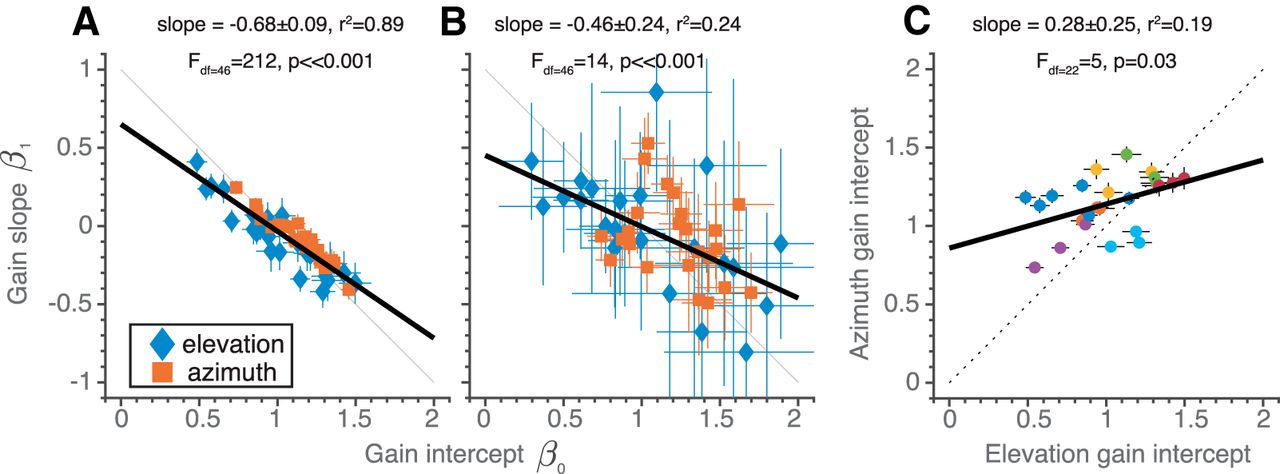
Gain change and narrow-range gain relationships in experiment 1. A, Gain slope, β1, as a function of the gain intercept, β0 (Eq. 6), for both dimensions (azimuth and elevation, denoted in color), all three orderings (narrow-to-broad, broad-to-narrow, random), and all eight participants (N = 48). B, Same analysis as in A, performed for a selected target range of 30°, shared across all blocks ([–15, +15]° for azimuth and elevation). Results are qualitatively similar as in A. C, Gain intercepts for azimuth as a function of gain intercept for elevation. The various colors denote individual subjects. Colored symbols denote best-fit parameters, error bars indicate 95% confidence interval. Bold black lines denote the best fit simple linear regression line through the data. Dotted line in A and B indicates where data would lie if the broad-range gain equals 1. In C, the dotted line indicates the x = y unity line.
- Figure 6.
Gain dependence on target range and trial number in experiment 2. Ongoing response gains (top: elevation; bottom: azimuth) over the course of trials in experiment 2, in which the distribution switched from broad to narrow (A, C), and from narrow to broad (B, D) at trial 250 (vertical dashed lines and target-response distributions at the bottom). The horizontal dashed line indicates gain = 1. Note that the gains for the narrow target range are more variable across subjects than for the broad range. In addition, the variability in elevation gain for the broad range is slightly larger than for azimuth. Also, broad-range elevation gains are smaller than azimuth gains. Thin gray lines: windowed regression results (Materials and Methods). Connected colored open circles denote the localization gains for three representative subjects; error bars indicate the 95% confidence interval. Bold colored lines denote the best fit regression lines of Equation 8 through the data of these subjects.
- Figure 7.
Gain change and narrow-range gain relationships in experiment 2. A, Narrow-range gain as a function of the gain change at the switch (Fig. 6B). Note the high negative correlation between these quantities (compare Fig. 5A). Bold black line denotes the best fit linear relationship. Data are from ten participants, conditions, and response components (N = 40). Colors and symbols denote parameters from both narrow-to-broad and broad-to-narrow blocks and from both dimensions as indicated by the inset. Bold black line denotes the best fit simple linear regression line through the data. Dotted line indicates where data would lie if the broad-range gain equals 1. B, Distributions of the gain slopes, β1, for the narrow and broad target ranges (Eq. 8). A slope around zero means that the gain did not change as a function of trial number. This was true, on average, for responses in the broad range. For the narrow range, however, the gains tended to increase. C, Distributions of the gain intercepts, β0 (Eq. 8). Note the much wider distribution for the narrow target range.
- Figure 8.
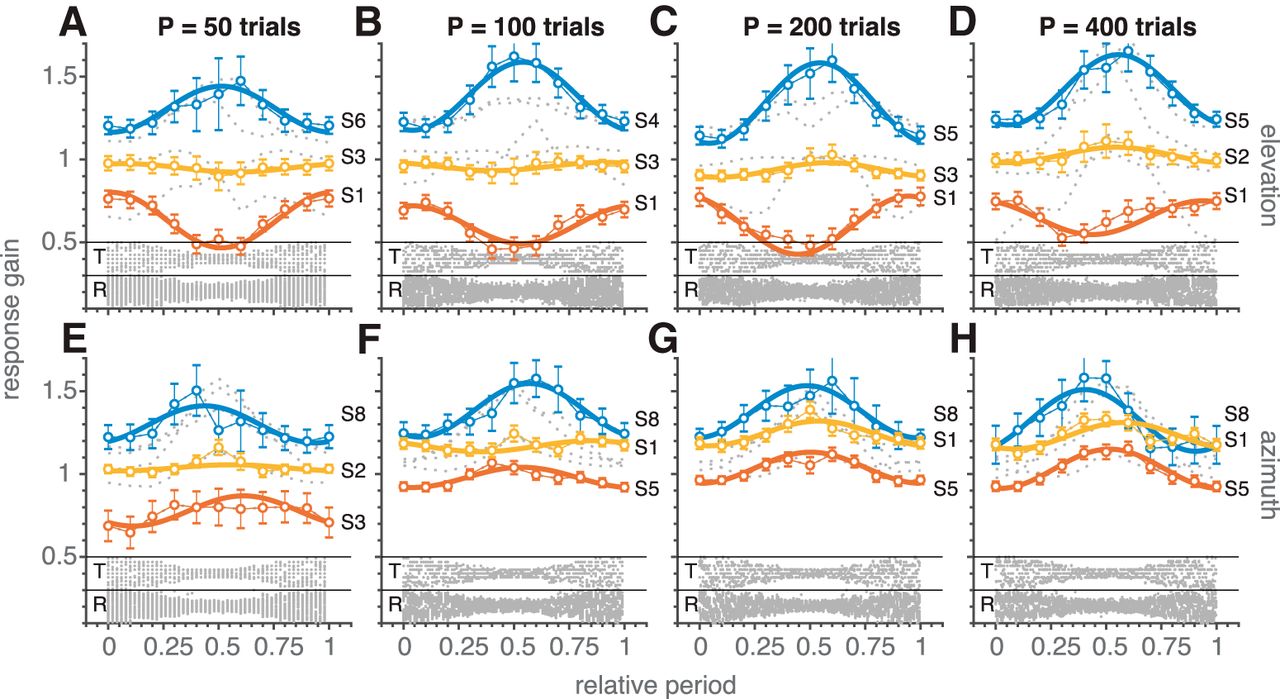
Gain dependence on modulating target range in experiment 3. Dynamic response-gain adjustments according to Equation 10 for all subjects (gray dotted lines: windowed analysis) and periods (P = 50, 100, 200, and 400 trials). Connected colored open circles denote the localization gains for three representative subjects; error bars indicate the 95% confidence interval. Bold colored lines denote the best fit regression lines of Equation 10 through the data of these subjects. The bottom of each panel shows target (T) and response (R) distributions (gray dots), pooled across subjects. Note opposite behavior of response gains for the low- vs. high-narrow gain responders in elevation (top row). The azimuth responses (bottom) are more similar across subjects, as the lowest narrow-range gains remained closer to one.
- Figure 9.
Gain change and narrow-range gain relationships in experiment 3. Gain change (2β1) as a function of the narrow-range gain (β0–β1) for the results of experiment 3 (Eq. 10). Colored symbols denote data from seven participants, four periods, and two response components (N = 56) as indicated by the inset. Bold black line denote the best fit simple linear regression line through the data. Dotted line indicates where data would lie if the broad-range gain equals 1.
- Figure 10.
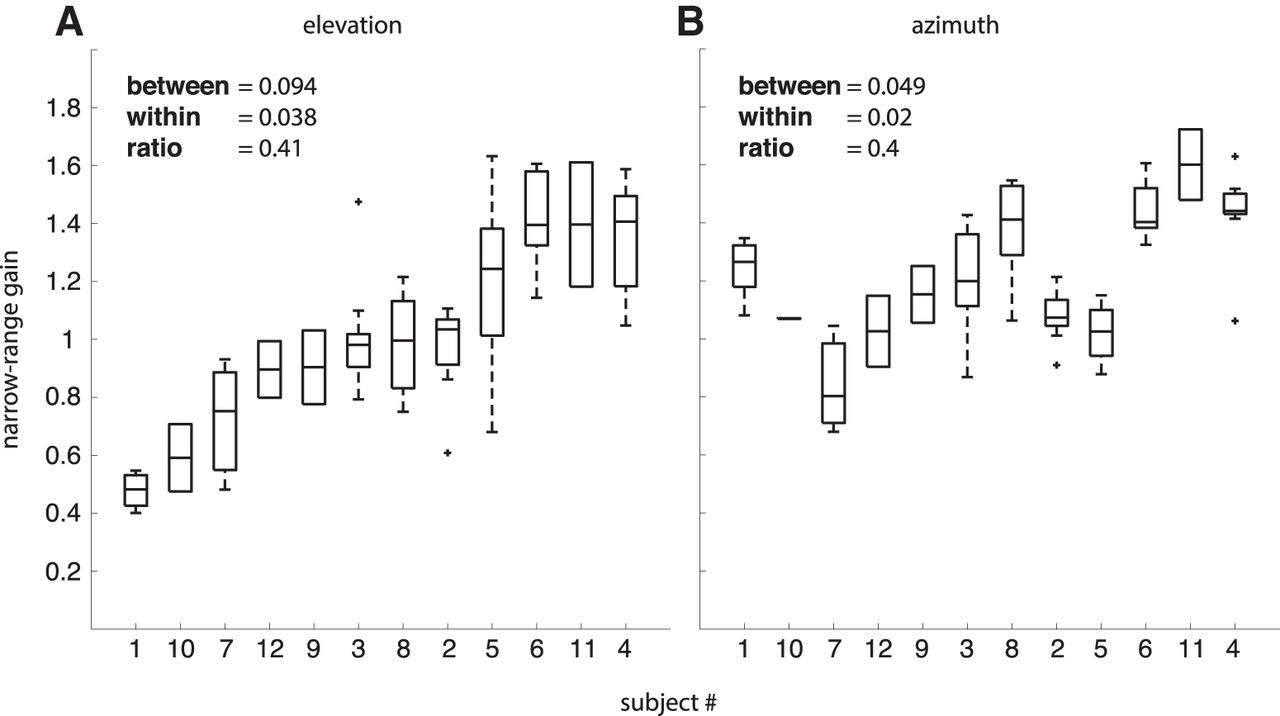
Variability in narrow-range gains. A, Subjects ordered according to the median of their elevation gains. The ratio between intrasubject and intersubject variability is 0.41. B, Same subject ordering as in A for azimuth. The ratio is 0.40. Note that elevation and azimuth results are positively correlated (r = 0.48, N = 72, p < 10−5; compare Fig. 5C). The median, the 25th and 75th percentiles, the most extreme datapoints not considered to be outliers, and the outliers are indicated by the central mark, the edges of the box, whiskers and plus-symbols, respectively.


In this issue


