

Article Figures & Data
Figures
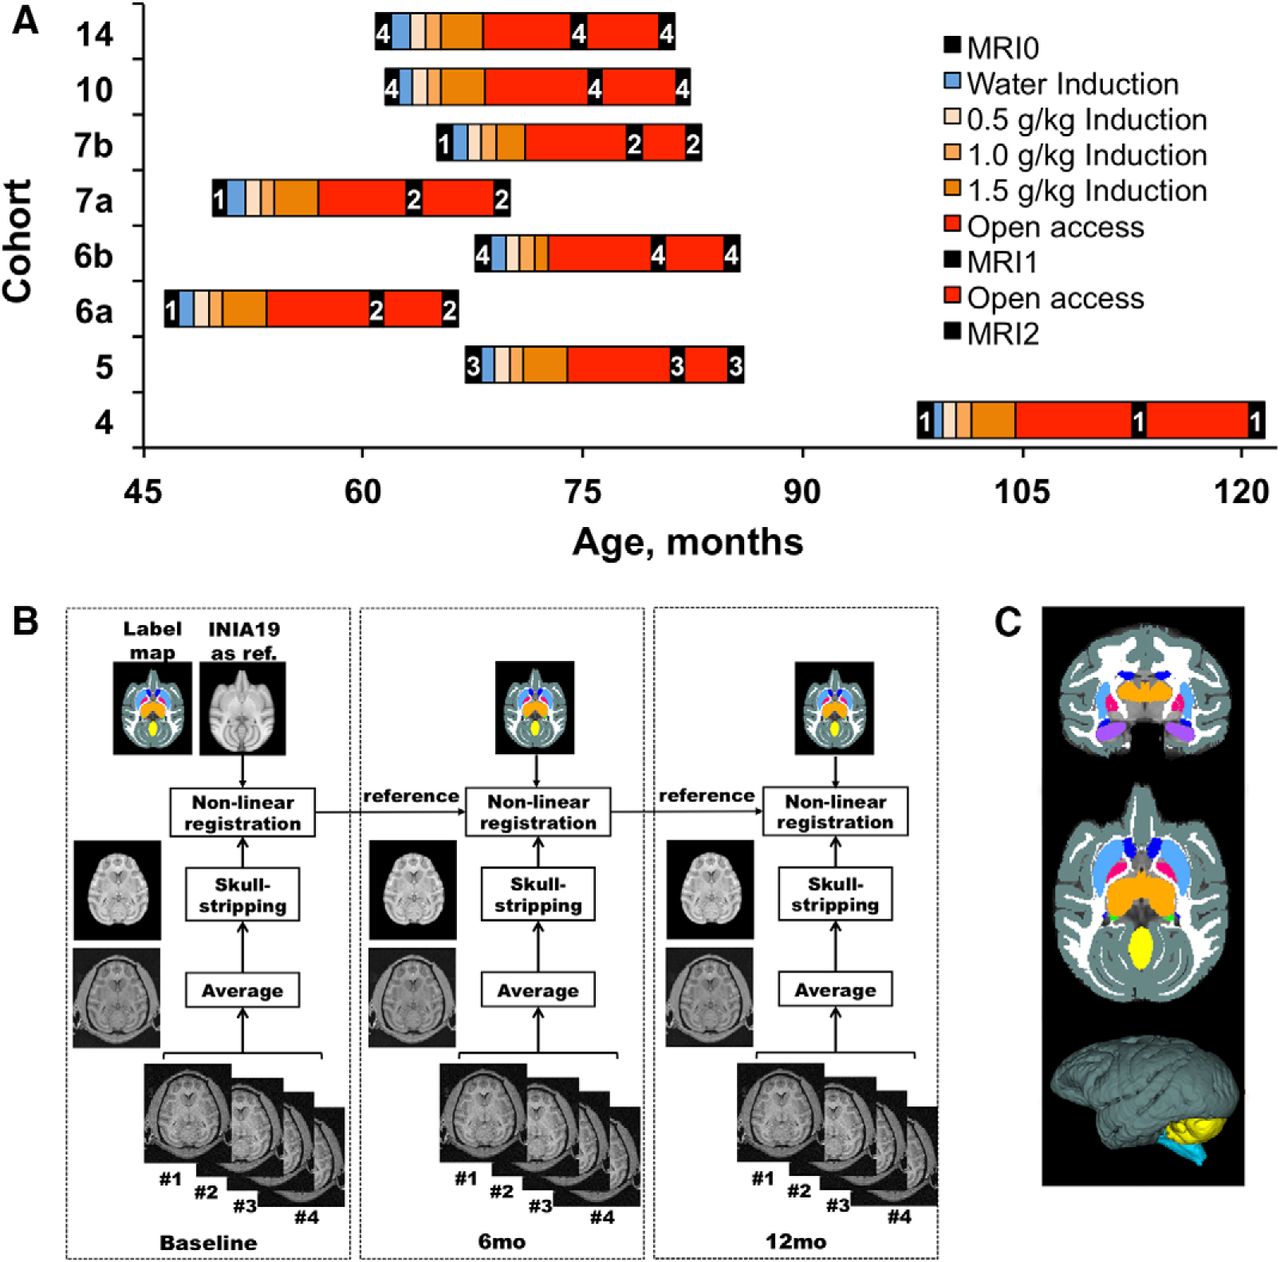
- Figure 1.
A–C, Schematic representations of experimental timeline (A) and MRI data processing (B, C). A, The timelines of the experiment are shown for each of eight cohorts of subjects admitted to and completed the study at different periods from 2008 to 2017. As indicated in the legend, the black squares represent an MRI sessions in the timeline of the experiment, and the numbers within them indicate an MRI protocol used at the time. B, The MR image processing is described in detail in the text (see Materials and Methods). C, Representation of the brain map of the monkey used for segmentation of ROIs in individual subjects (top, coronal; middle, axial; bottom, 3D image showing cortical surface, the cerebellum, and brainstem). The ROIs were labeled in INIA19 template brain.
- Figure 2.
Age-dependent brain growth in the nonhuman primates. A–C, Plots of individual brain volume changes across age in CTR (n = 16), NHD (n = 19), and HD (n = 26) NHPs. The VB of each subject was measured three times, as depicted by empty circles. An individual regression line is drawn across the three VB values for each subject. D, Average VB-by-age linear regression estimated for CTRs, NHDs, and HDs with 95% confidence interval depicted by the shaded area around the line. E, Correlation between age-dependent brain growth (βi) and individual daily ethanol intake averaged across 12 months of drinking. The βi value is based on the slope of the individual regression line, as shown in A–C. The ethanol intake is estimated based on daily consumption of 4% (w/v) ethanol solution averaged across ∼372 drinking sessions with the exception of the induction period (rs = 0-0.41, p < 0.01).
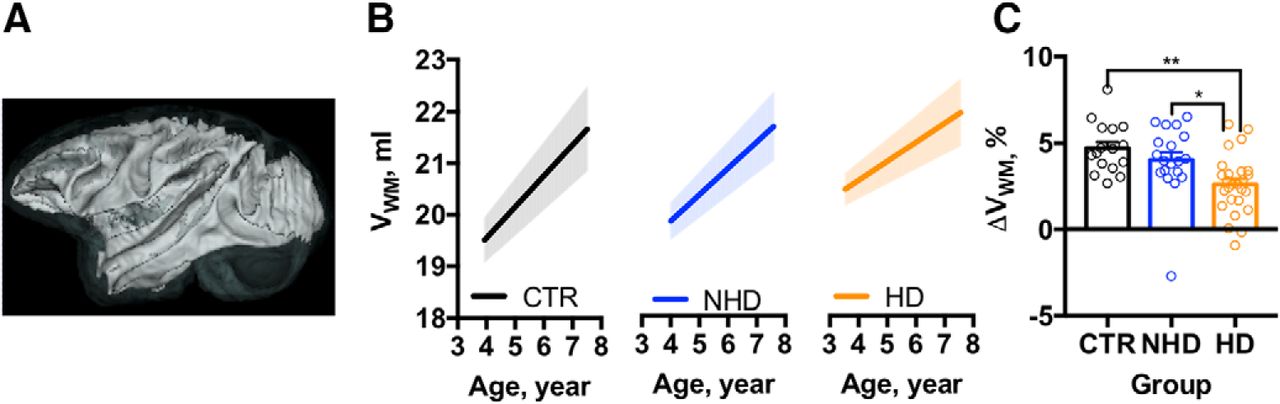
- Figure 3.
Heavy ethanol intake reduces the rate of the white matter growth in NHP brain. A, 3D representation of the cortical white matter in the brain. B, The estimated rate of white matter growth in the control, non-heavy-drinking, and heavy-drinking NHPs. The shadows above and below the regression lines depict the 95% confidence interval. C, The effect of chronic ethanol use on the average change in white matter volume occurred in three groups of subjects from baseline until the end of ethanol/water self-administration. The dots represent change in the volume measured in individual monkeys. Asterisks show the results of Bonferroni post hoc test, where p values adjusted for the multiple comparisons were **p < 0.01 and *p < 0.05.
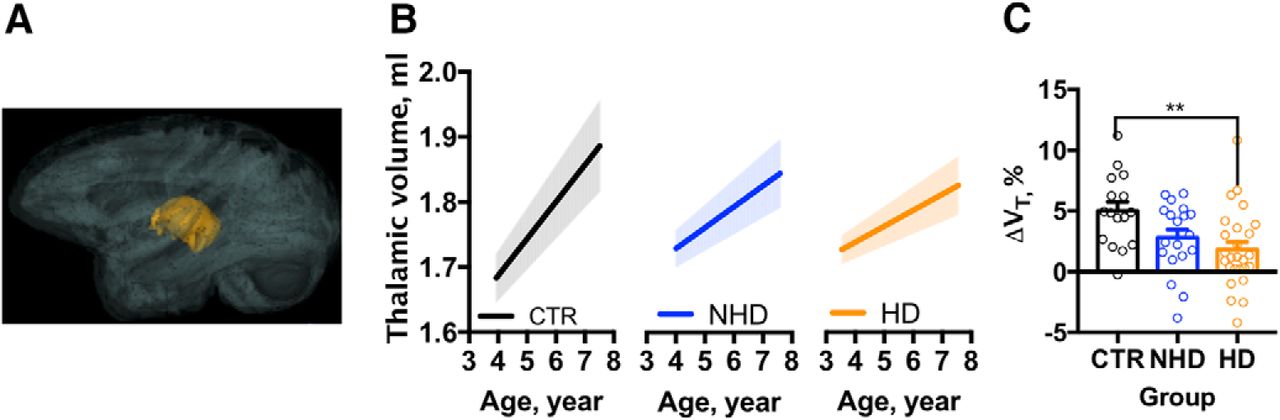
- Figure 4.
Ethanol drinking attenuates thalamic growth in adolescent/early adult NHP. A, 3D representation of the thalamus in the brain. B, The estimated rate of the thalamic growth in the control, non-heavy-drinking, and heavy-drinking NHPs. The shadows above and below the regression lines depict 95% confidence interval. C, The effect of chronic ethanol use on the average change of thalamic volume occurred in three groups of subjects from baseline until the end of ethanol/water self-administration. The dots represent change in the volume measured in individual monkeys. Asterisks show the results of a Bonferroni post hoc test, where p values adjusted for the multiple comparisons were **p < 0.01.


Tables
Protocol MRI system RF coil TR (ms) TE (ms) TI (ms) Voxel size (mm) Flip angle 1 Trio Quadrature knee 2500 4.38 1100 0.5 × 0.5 × 0.5 12 2 TimTrio Quadrature knee (Tim) 2500 3.86 1100 0.5 × 0.5 × 0.5 12 3 Trio 8-Channel knee array 2500 4.38 1100 0.5 × 0.5 × 0.5 12 4 TrioTim 15-Channel knee array 2500 3.86 1100 0.5 × 0.5 × 0.5 12 RF, Radiofrequency. As indicated in the table, the ONPRC MRI system was upgraded throughout the study and different RF coils were used to enhance the signal-to-noise ratio. The parameters of MR image acquisition were adjusted accordingly.
Age (SD), year Ethanol Intake (SE), g/kg/d MRI CTR NHD HD CTR NHD HD 1 4.7 (0.6) 5.1 (0.6) 4.8 (0.8) 0.0 0.0 0.0 2 5.8 (0.6) 6.2 (0.6) 5.9 (0.7) 0.0 1.8 (0.5) 3.3 (0.8) 3 6.3 (0.6) 6.6 (0.6) 6.4 (0.7) 0.0 2.1 (0.4) 3.6 (0.8) One-way ANOVA revealed no significant difference in age at the beginning of the study (MRI 1) among three groups of subjects (F(2,60) = 1.3, p = 0.28). Repeated-measures ANOVA revealed significant effects of MRI (2 vs 3: F(1,43) = 11.3, p < 0.01) and group (NHD vs HD: F(1,43) = 67.9, p < 0.0001) on ethanol intake with no significant interaction (F(1,43) = 0.06, p = 0.8).
Groupa Agea Interaction ROIa F P F p F p WM 4.4 <0.05 405.2 <0.00001 9.6 <0.00001 Thalamus 3.7 <0.05 108.8 <0.00001 8.2 <0.00001 Globus pallidus 1.6 0.2 148.4 <0.00001 3.7 <0.05 Brainstem 1.1 0.3 700.7 <0.00001 3.9 <0.05 Cerebellum 1.6 0.2 120.5 <0.00001 1 0.4 Amygdala 1.6 0.2 12.7 <0.01 3.2 <0.05 Cortex 1.9 0.2 11.4 <0.01 2.2 0.1 Putamen 0.8 0.4 10.8 <0.01 1.9 0.2 Caudate 2.3 0.1 0.7 0.4 0.7 0.5 Hippocampus 1.8 0.2 0.2 0.6 2.3 0.1 The table includes the results of the test for fixed effects used in the LMM3.1: age, group, and age × group interaction. Note that the volume of a single ROI was used as a dependent variable in LMM3.1.
aThe degrees of freedom for the numerator and denominator are 1 and 123 (age), 2 and 96 (group), and 2 and 123 (interaction), respectively. Note that only p values <0.005 were considered significant (adjustment for 10 ROIs included in the analysis).
ROI β SE p 95% CI Cerebellum 0.14 0.01 <0.00001 0.12–0.17 Globus pallidus 0.012 0.001 <0.00001 0.009–0.1 Brainstem 0.16 0.006 <0.00001 0.15–0.018 The table includes the parameters of estimates of fixed effects obtained in the LMM1 with random intercept and fixed effect of age on V of listed ROIs. The rate of volume change is expressed as milliliters per year.
CTR NHD HD ROI β SE p 95% CI β´ SE Adjusted p 95% CI β´ SE Adjusted p 95% CI WM 0.6 0.050 <0.00001 0.5-0.7 −0.07 0.06 0.44 −0.2 to 0.04 −0.25 0.06 <0.00001 −0.4 to −0.13 Thalamus 0.06 0.007 <0.00001 0.04-0.07 −0.02 0.01 <0.01 −0.4 to −0.01 −0.03 0.01 <0.00001 −0.05 to −0.02 The table includes the results obtained with the LMM 3.1 with random intercept and fixed effect of age, group, and their interaction on V of the ROIs. β´ = βNHD or HD-βCTR. The rate of volume change is expressed as milliliters per year. Average estimated age-dependent growth trajectories obtained in the NHD and HD groups were compared with those of the CTR group, with t test and p values adjusted accordingly.
In this issue


