
Main menu

  • HOME
  • CONTENT
    • Early Release
    • Featured
    • Current Issue
    • Issue Archive
    • Blog
    • Collections
    • Podcast
  • TOPICS
    • Cognition and Behavior
    • Development
    • Disorders of the Nervous System
    • History, Teaching and Public Awareness
    • Integrative Systems
    • Neuronal Excitability
    • Novel Tools and Methods
    • Sensory and Motor Systems
  • ALERTS
  • FOR AUTHORS
  • ABOUT
    • Overview
    • Editorial Board
    • For the Media
    • Privacy Policy
    • Contact Us
    • Feedback
  • SUBMIT

User menu

Search

  • Advanced search
eNeuro
eNeuro

Advanced Search


  • HOME
  • CONTENT
    • Early Release
    • Featured
    • Current Issue
    • Issue Archive
    • Blog
    • Collections
    • Podcast
  • TOPICS
    • Cognition and Behavior
    • Development
    • Disorders of the Nervous System
    • History, Teaching and Public Awareness
    • Integrative Systems
    • Neuronal Excitability
    • Novel Tools and Methods
    • Sensory and Motor Systems
  • ALERTS
  • FOR AUTHORS
  • ABOUT
    • Overview
    • Editorial Board
    • For the Media
    • Privacy Policy
    • Contact Us
    • Feedback
  • SUBMIT
PreviousNext
Research ArticleNew Research, Sensory and Motor Systems

Different Inhibitory Interneuron Cell Classes Make Distinct Contributions to Visual Contrast Perception

Jackson J. Cone, Megan D. Scantlen, Mark H. Histed and John H. R. Maunsell
eNeuro 26 February 2019, 6 (1) ENEURO.0337-18.2019; https://doi.org/10.1523/ENEURO.0337-18.2019
Jackson J. Cone
1Department of Neurobiology, University of Chicago, Chicago, IL 60637
  • Find this author on Google Scholar
  • Find this author on PubMed
  • Search for this author on this site
  • ORCID record for Jackson J. Cone
Megan D. Scantlen
1Department of Neurobiology, University of Chicago, Chicago, IL 60637
  • Find this author on Google Scholar
  • Find this author on PubMed
  • Search for this author on this site
Mark H. Histed
2Unit on Neural Computation and Behavior, National Institute of Mental Health, Bethesda, MD 20814
  • Find this author on Google Scholar
  • Find this author on PubMed
  • Search for this author on this site
  • ORCID record for Mark H. Histed
John H. R. Maunsell
1Department of Neurobiology, University of Chicago, Chicago, IL 60637
  • Find this author on Google Scholar
  • Find this author on PubMed
  • Search for this author on this site
  • ORCID record for John H. R. Maunsell
  • Article
  • Figures & Data
  • Info & Metrics
  • eLetters
  • PDF
Loading

Article Figures & Data

Figures

  • Figure 1.
    • Download figure
    • Open in new tab
    • Download powerpoint
    Figure 1.

    Targeting ChR2 to retinotopically defined areas of visual cortex. A, Pseudo-colored intrinsic autofluorescence responses to visual stimuli presented in two locations in a SST-Cre mouse. Magenta and green features represent 2D-Gaussian fits of responses to stimuli at visual field locations depicted in the inset (green: 0° azimuth, –20° elevation; magenta: 25° azimuth, +20° elevation; Gabor SD = 10°). Dashed lines represent horizontal and vertical meridians. A: anterior; M: medial. B, ChR2-tdTomato fluorescence (2D-Gaussian fit) from the same cortical region shown in A. The retinotopic location corresponding to maximal expression was used in all behavioral sessions (shown in inset; 25° azimuth, 0° elevation; Gabor SD = 6.75°). Conventions as in A. C, Representative confocal image of ChR2-tdTomato expression in the visual cortex (V1) of a VIP-Cre mouse. D, Trial schematic of the contrast increment detection task. Following the intertrial interval, a trial begins when the mouse depresses the lever. A visual stimulus could appear from 400–3000 ms following trial onset. The mouse had to release the lever within 700–900 ms after stimulus onset to receive reward. On a randomly selected half of the trials, ChR2-expressing interneurons were illuminated with blue light for 100 ms concurrent with the visual stimulus.

  • Figure 2.
    • Download figure
    • Open in new tab
    • Download powerpoint
    Figure 2.

    PV and SST stimulation impairs, while VIP stimulation improves, contrast increment detection. A, Representative PV mouse behavioral performance from a single contrast increment session. Data are false-alarm corrected performance for trials with (blue) and without (black) activation of PV interneurons as stimulus contrast is varied. Curves are best-fitting Weibull functions that were used to determine detection thresholds (dotted vertical lines) and 95% confidence intervals (solid horizontal lines). B, Summary of PV stimulation effects. Circles depict the contrast increment detection thresholds from individual sessions with (y-axis) and without (x-axis) PV neuron stimulation (five mice, 47 sessions). Filled circles indicate a significant shift in threshold (44/47; bootstrap). C, Representative behavioral performance from a single session in a SST mouse. Same format as A. D, Summary of SST stimulation effects (three mice, 39 sessions; significant threshold difference in 34/39 sessions). Same format as B. E, Representative single session behavioral performance from a VIP mouse. Conventions as in A and C. F, Summary of VIP stimulation effects (three mice 43 sessions; significant threshold difference in 40/43 sessions). Same format as B, D.

  • Figure 3.
    • Download figure
    • Open in new tab
    • Download powerpoint
    Figure 3.

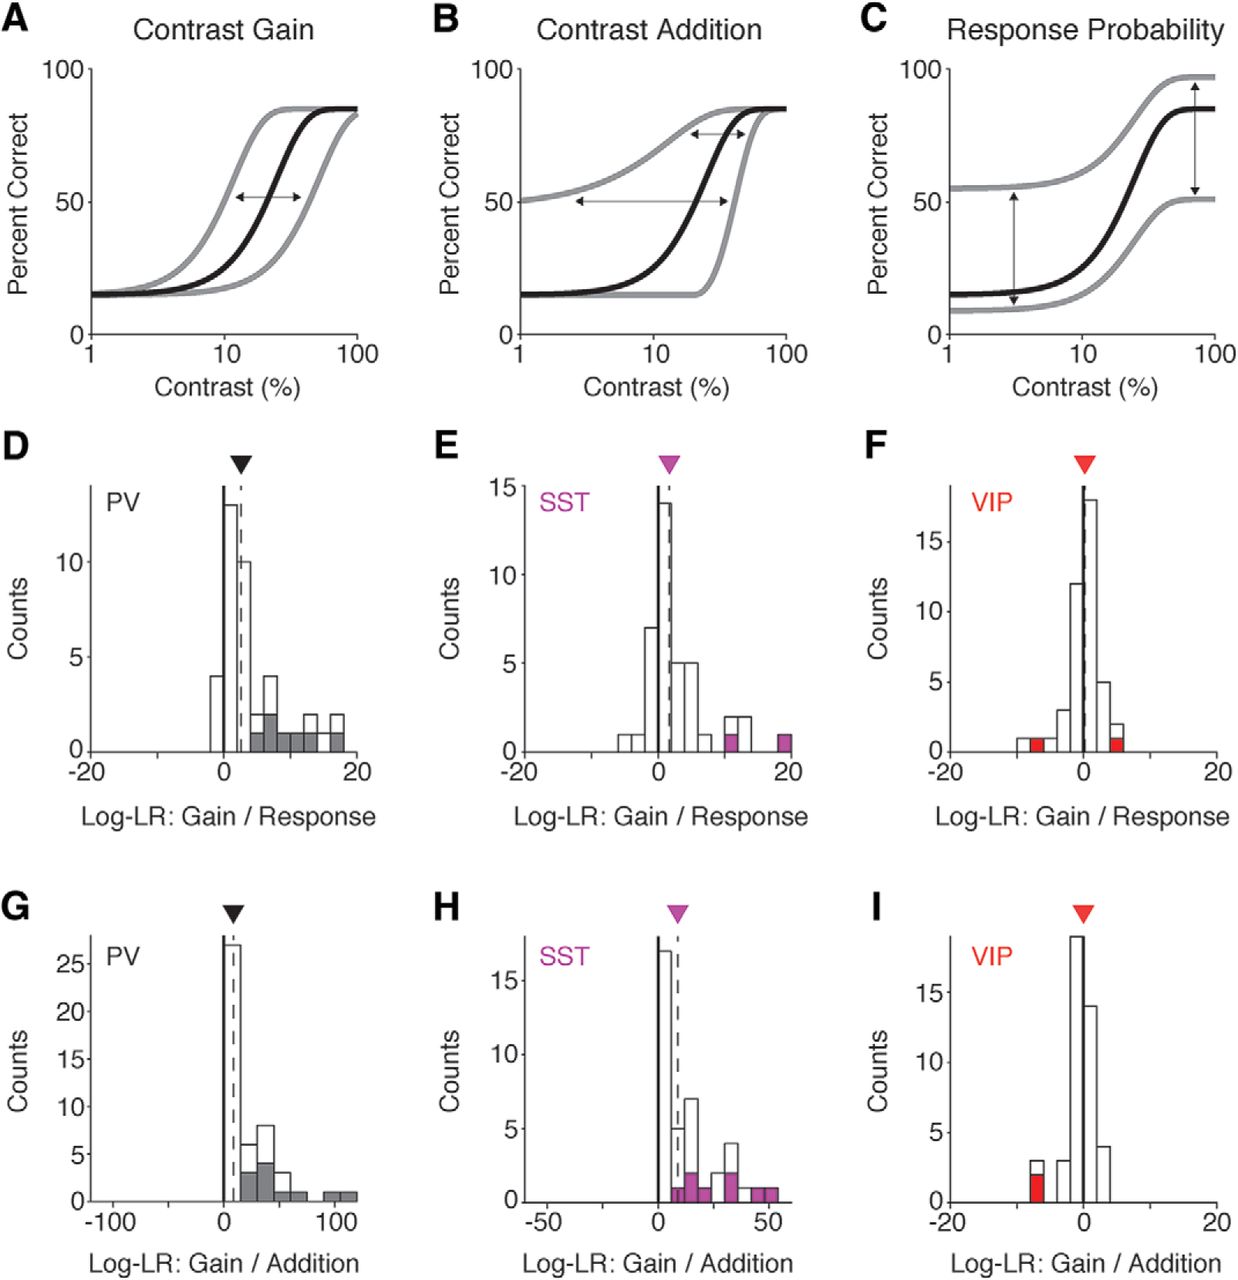
    Optogenetic effects on detection performance are well described by changes in perception rather than response probability. A–C, Hypothetical examples of how optogenetic stimulation of interneurons could impact detection performance. Black line = performance on trials without stimulation. Gray line = impairment/enhancement in performance resulting from interneuron stimulation. Arrows indicate direction and magnitude of shifts in detection performance resulting from optogenetic stimulation. Lapse and false alarm rates have been exaggerated to highlight differences in model predictions. A, If stimulation impacts sensory evidence by causing a multiplicative change in contrast, the psychometric function should shift along the horizontal axis. B, If stimulation adds a fixed increment or decrement to the contrast of the stimulus, the psychometric function should shift primarily at low contrasts. C, If stimulation affects performance by changing the response probability, the psychometric function should shift above the lapse rate or below the false alarm rate. D, Distribution of log-likelihood ratios from individual sessions comparing the contrast gain model to the response probability model in PV mice. E, Same as in D but for SST mice. F, Same as in D but for VIP mice. G, Distribution of log-likelihood ratios from individual sessions comparing the contrast gain model to the contrast addition model in PV mice. H, Same as in G but for SST mice. I, Same as in G but for VIP mice. Thick black lines mark 0, where neither model had a higher likelihood. Downward pointing triangles and dashed lines denote the median of each distribution. Filled boxes are sessions for which the log-likelihood of one model is significantly better than the other model (p < 0.05, bootstrap). Log-LR = log-likelihood ratio. Note the differences in scale for G–I.

  • Figure 4.
    • Download figure
    • Open in new tab
    • Download powerpoint
    Figure 4.

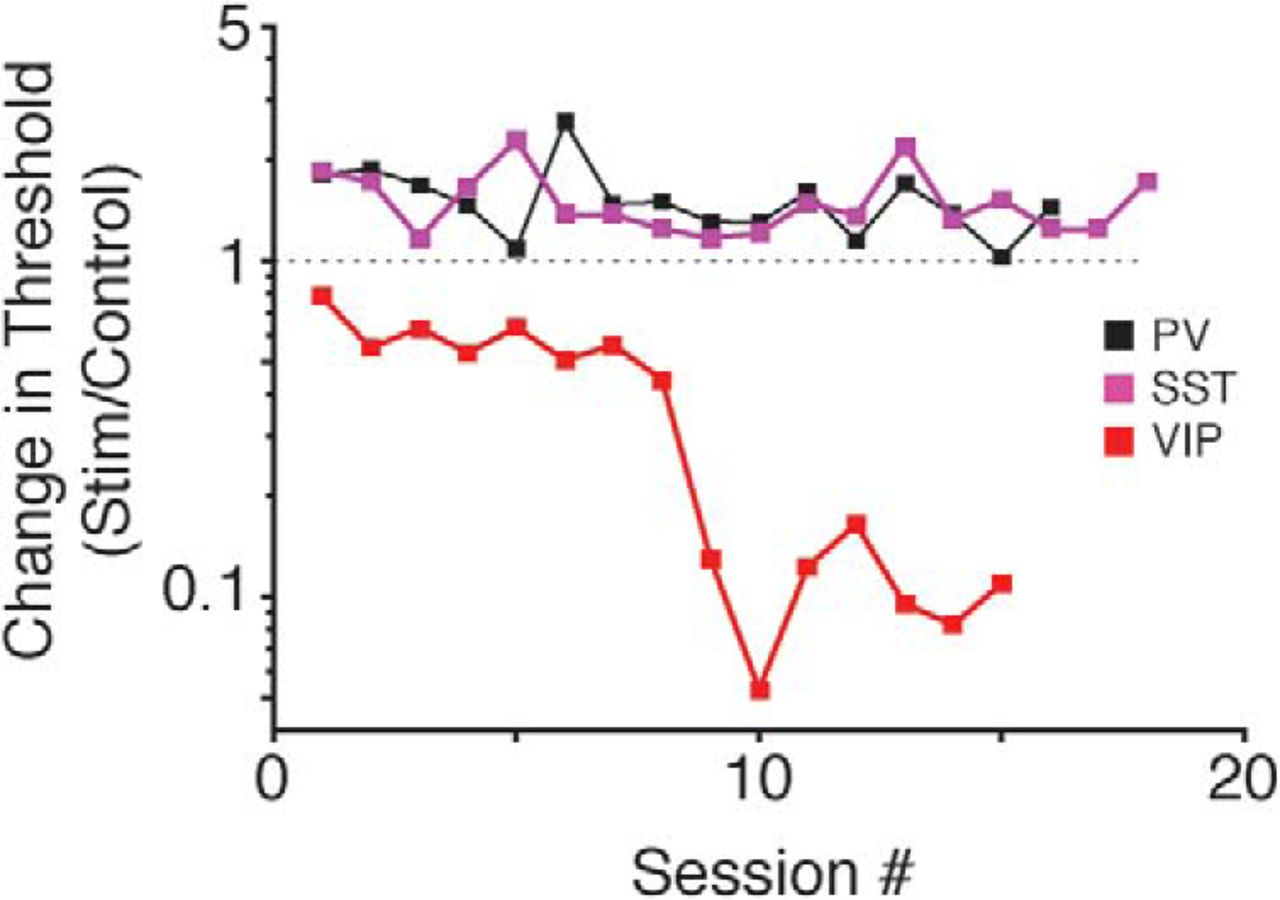
    Stability of optogenetic effects on contrast detection performance. Data from three representative mice showing that extended training does little to mitigate the impairment induced by PV (black) or SST (magenta) stimulation, while VIP (red) performance improves further with training. Squares depict the ratio of thresholds from visual + optogenetic stimulus trials relative to visual only trials for each session. Values greater than one represent a performance impairment and values less than one represent performance improvement.

  • Figure 5.
    • Download figure
    • Open in new tab
    • Download powerpoint
    Figure 5.

    Mice can reliably report optogenetic stimulation of VIP neurons in the absence of a visual stimulus. A, Trial schematic of the optogenetic stimulation detection task. The visual display contained a blank gray screen throughout the session. At a random time 400–3000 ms after trial onset a 100-ms square pulse of blue light was delivered to ChR2-expressing VIP neurons, and the mouse was required to release the lever within the reaction time window to receive reward. B, Representative psychometric performance of optogenetic stimulation detection in a VIP mouse. Dots represent false-alarm corrected performance as the intensity of VIP stimulation varied across trials. The curve is the best-fitting Weibull function, which was used to determine detection threshold (dotted vertical line) and 95% confidence interval (solid horizontal line). C, Same as in B for a second VIP mouse. D, Thresholds are stable across sessions. Top, VIP detection thresholds (95% CI) for 11 sessions from the mouse shown in B. Bottom, VIP detection thresholds (95% CI) for six sessions from the mouse shown in C.

Back to top

In this issue

eneuro: 6 (1)
eNeuro
Vol. 6, Issue 1
January/February 2019
  • Table of Contents
  • Index by author
  • Ed Board (PDF)
Email

Thank you for sharing this eNeuro article.

NOTE: We request your email address only to inform the recipient that it was you who recommended this article, and that it is not junk mail. We do not retain these email addresses.

Enter multiple addresses on separate lines or separate them with commas.
Different Inhibitory Interneuron Cell Classes Make Distinct Contributions to Visual Contrast Perception
(Your Name) has forwarded a page to you from eNeuro
(Your Name) thought you would be interested in this article in eNeuro.
CAPTCHA
This question is for testing whether or not you are a human visitor and to prevent automated spam submissions.
Print
View Full Page PDF
Citation Tools
Different Inhibitory Interneuron Cell Classes Make Distinct Contributions to Visual Contrast Perception
Jackson J. Cone, Megan D. Scantlen, Mark H. Histed, John H. R. Maunsell
eNeuro 26 February 2019, 6 (1) ENEURO.0337-18.2019; DOI: 10.1523/ENEURO.0337-18.2019

Citation Manager Formats

  • BibTeX
  • Bookends
  • EasyBib
  • EndNote (tagged)
  • EndNote 8 (xml)
  • Medlars
  • Mendeley
  • Papers
  • RefWorks Tagged
  • Ref Manager
  • RIS
  • Zotero
Respond to this article
Share
Different Inhibitory Interneuron Cell Classes Make Distinct Contributions to Visual Contrast Perception
Jackson J. Cone, Megan D. Scantlen, Mark H. Histed, John H. R. Maunsell
eNeuro 26 February 2019, 6 (1) ENEURO.0337-18.2019; DOI: 10.1523/ENEURO.0337-18.2019
Twitter logo Facebook logo Mendeley logo
  • Tweet Widget
  • Facebook Like
  • Google Plus One

Jump to section

  • Article
    • Abstract
    • Significance Statement
    • Introduction
    • Materials and Methods
    • Results
    • Discussion
    • Acknowledgments
    • Footnotes
    • References
    • Synthesis
  • Figures & Data
  • Info & Metrics
  • eLetters
  • PDF

Keywords

  • inhibition
  • interneurons
  • mouse
  • psychophysics
  • vision
  • visual contrast

Responses to this article

Respond to this article

Jump to comment:

No eLetters have been published for this article.

Related Articles

Cited By...

More in this TOC Section

New Research

  • A Very Fast Time Scale of Human Motor Adaptation: Within Movement Adjustments of Internal Representations during Reaching
  • Optogenetic Activation of β-Endorphin Terminals in the Medial Preoptic Nucleus Regulates Female Sexual Receptivity
  • Hsc70 Ameliorates the Vesicle Recycling Defects Caused by Excess α-Synuclein at Synapses
Show more New Research

Sensory and Motor Systems

  • What is the difference between an impulsive and a timed anticipatory movement ?
  • Odor Experience Stabilizes Glomerular Output Representations in Two Mouse Models of Autism
  • Neural Response Attenuates with Decreasing Inter-Onset Intervals Between Sounds in a Natural Soundscape
Show more Sensory and Motor Systems

Subjects

  • Sensory and Motor Systems
  • Home
  • Alerts
  • Follow SFN on BlueSky
  • Visit Society for Neuroscience on Facebook
  • Follow Society for Neuroscience on Twitter
  • Follow Society for Neuroscience on LinkedIn
  • Visit Society for Neuroscience on Youtube
  • Follow our RSS feeds

Content

  • Early Release
  • Current Issue
  • Latest Articles
  • Issue Archive
  • Blog
  • Browse by Topic

Information

  • For Authors
  • For the Media

About

  • About the Journal
  • Editorial Board
  • Privacy Notice
  • Contact
  • Feedback
(eNeuro logo)
(SfN logo)

Copyright © 2025 by the Society for Neuroscience.
eNeuro eISSN: 2373-2822

The ideas and opinions expressed in eNeuro do not necessarily reflect those of SfN or the eNeuro Editorial Board. Publication of an advertisement or other product mention in eNeuro should not be construed as an endorsement of the manufacturer’s claims. SfN does not assume any responsibility for any injury and/or damage to persons or property arising from or related to any use of any material contained in eNeuro.