

Article Figures & Data
Figures
- Figure 1.
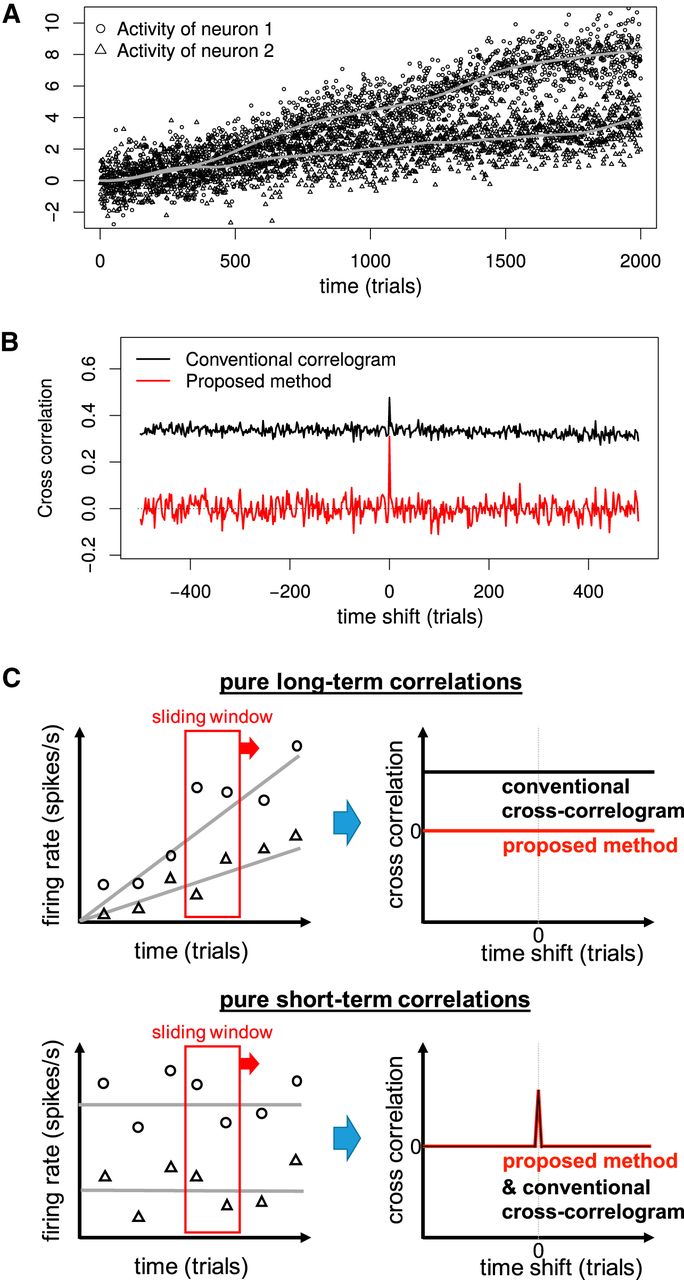
Comparison of conventional cross-correlogram and proposed method. A, Artificial activities of two neurons, simulated as sums of baselines and trial-to-trial noises. The thick gray smooth curves denote time-dependent baselines μ generated by the ARIMA(0,2,1) model, on which the bivariate Gaussian noises were added to generate the neural activities. The added noises have significant spatial or interneuronal correlations but no temporal correlation because intertrial intervals are assumed to be fairly long (≥3 s). B, The estimated cross-correlations for the simulated activities in A by the proposed method (red) and the conventional correlogram (black). Only the proposed method works and shows a proper peak at the origin. C, Schematic illustrations of how the proposed method works for the cases with pure long-term or short-term correlations. The cross-correlation computed within each local window, where the baselines are instantaneously constant, are averaged across sliding windows to capture only short-term correlations whatever the baseline drift is.
- Figure 2.
Comparison of conventional Kalman filter method and proposed method. A, The simulated activities of two neurons (red and blue) for 100 trials with the common sinusoidal baseline trend. The thick gray line denotes the model trend used for the data generation. The activities of two neurons at each time are generated as the sum of the baseline trend and the bivariate Gaussian noises with unit variances and 0.3 correlation coefficient. When we simulated more than two neurons simultaneously, the additional neurons shared the trend but did not have noise correlation (data not shown). Thus, among N simulated neurons, only neurons 1 and 2 have non-zero correlation coefficient, which is to be estimated. B, The residual activities after the removal of the estimated trend by the Kalman filter from the activities in A. C, The noise correlations in the residuals averaged across 100 realizations of the simulated data. The horizontal dotted gray line for the true correlation coefficient (=0.3) indicates that the conventional Kalman filter method does not work when the number of simultaneously simulated neurons are small. The error bars representing the SD demonstrate the large trial-to-trial variability in the results. D, Noise correlations estimated by the proposed method from the same data. The horizontal dotted gray line for the true correlation coefficient (=0.3) indicates that the proposed method always works. The error bars representing the SD demonstrate the small variability in the results. E, The computational time for the conventional Kalman filter method. F, The computational time for the proposed method.
- Figure 3.
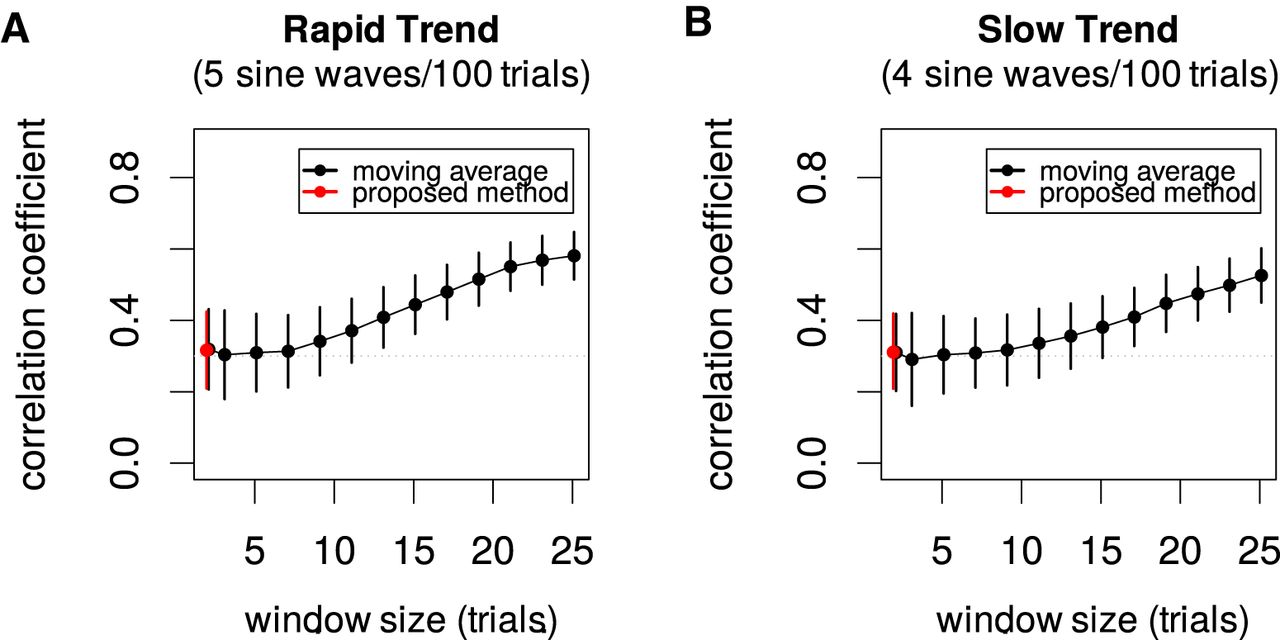
Comparison of conventional moving average method and proposed method. As in Figure 2, the simulated neural activities had the sinusoidal trend with five waves (A) or four waves in 100 trials (B). For the moving average method, the neural activities were first smoothed by the moving average with various window sizes and then the correlation coefficients were computed for the residuals. The mean ± SD of the estimated noise correlations across 100 realizations of the simulated data plotted. The horizontal dotted gray lines for the true correlation coefficient (=0.3) indicate that the biases are prominent for longer window sizes and for rapidly changing trends.
- Figure 4.
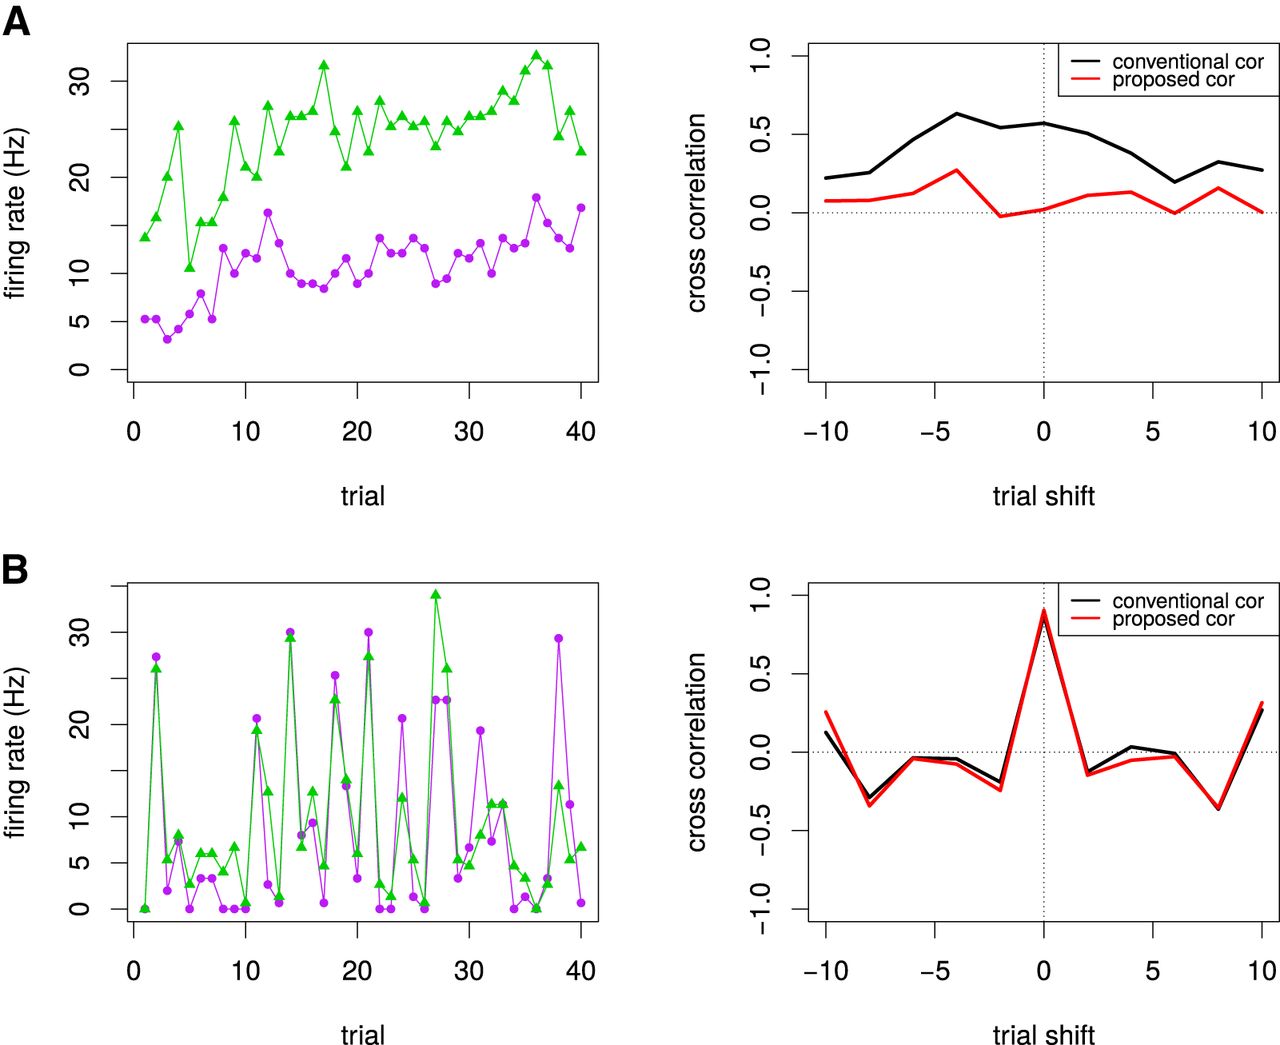
Examples of noise correlations for two V1 neuron pairs. A, For the nonstationary case where the time series for the both neurons show significant drifts (left), the broad cross-correlation was estimated by the conventional cross-correlogram (p = 0.00012 at the origin) but no short-term correlation by the proposed method (p = 0.92 at the origin). B, For the stationary case where the time series for the both neurons do not show significant drifts but the simultaneous activities tend to synchronize, the narrow cross-correlation at the origin was estimated by both the conventional correlogram (p < 105) and the proposed method (p < 105).
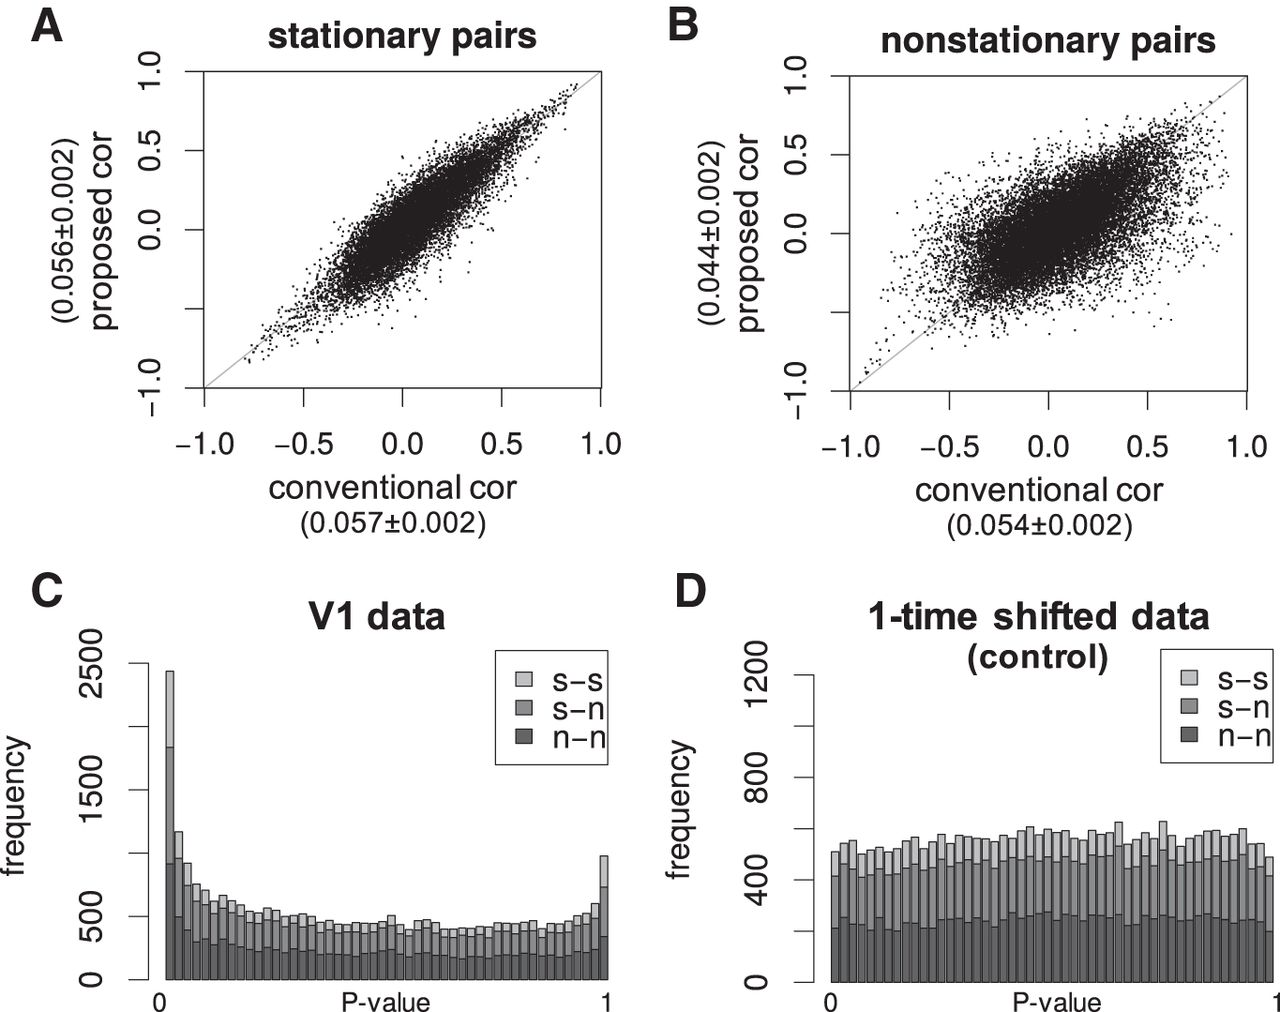
- Figure 5.
Population summary of noise correlations for all recorded V1 neurons. A, The proposed short-term noise correlations plotted against the conventional correlation coefficients for all the simultaneously recorded pairs of stationary V1 neurons (n = 12,931 pairs). The stationary or nonstationary neurons were selected by the statistical serial correlation test for nonstationarity. The numbers along the axes denote the mean ± SEM. B, Same plot for all the simultaneously recorded pairs of nonstationary V1 neurons (n = 18891 pairs). Note that the correlations are highly reproducible located along the diagonal for the stationary neuron pool but not reproducible for the nonstationary neuron pool, suggesting that the proposed method successfully removes long-term noise correlations by detrending. C, The distribution of the p values for the statistical significance of the proposed short-term noise correlations for V1 data. s-s denotes the pair of two stationary neurons. s-n denotes the pair of stationary and nonstationary neurons. n-n denotes the pair of two nonstationary neurons. The non-uniformity of the distribution indicates that the significant short-term correlations for some pairs are not obtained by chance. D, The control distribution of the p values for the same test obtained for the one-time-shifted V1 data that cannot have short-term correlations. The uniform distribution demonstrates that, desirably, the statistical test detects no spurious short-term correlation even if the signals drift in the V1 data. Note that, in contrast, the conventional correlogram in Figure 1B resulted in the non-zero correlations even for time-shifted data.
- Figure 6.
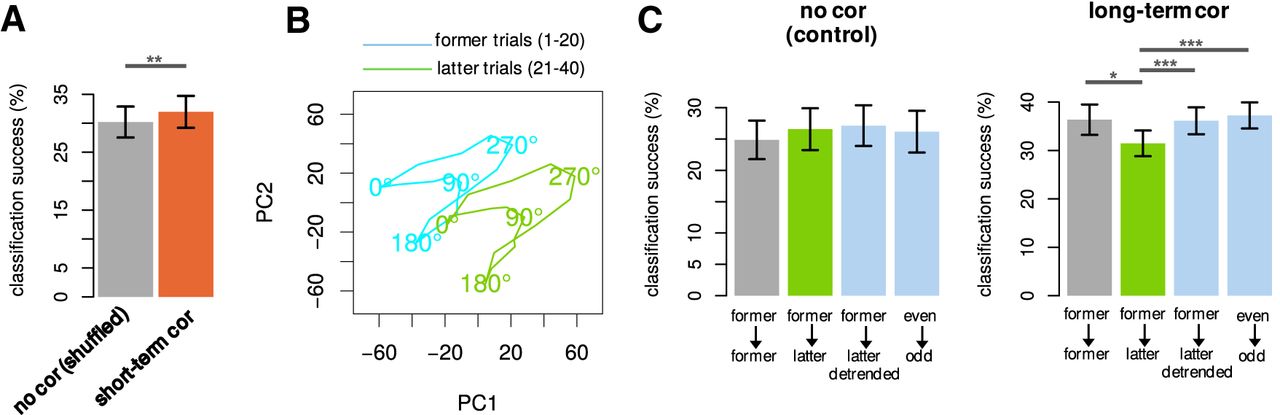
Impacts of short-term and long-term components of correlated activities of V1 neurons. A, The classification success rates in the absence and presence of pure short-term correlations (mean ± SEM). In the presence of pure short-term correlations, the decoding accuracy was slightly improved (p = 0.0044, paired t test, 15 sessions with 134 neurons). Note that the chance level is
 , as 16 stimuli were decoded. B, The baseline drifts, which cause long-term correlations, were visualized by the principal component analysis for the average responses to 16 visual stimuli (tuning curves) of the neurons with significant baseline drifts (to be precise, the same neuron pool as in C, right). The average responses for 1st–20th trials (turquoise blue) and 21th–40th trials (green) demonstrate that the entire activities of neurons shift over trials. C, Decoding accuracy in the absence and presence of pure long-term correlations. The cross-validated classification success rates for four types of learning were compared: (1) when trained by former trials and tested by former trials, (2) when trained by former trials and tested by latter trials, (3) when trained by former trials and tested by latter trials after the respective global means were subtracted for detrending (i.e., centering and equating the means of former and latter trials in B), (4) when trained by even-numbered trials and tested by odd-numbered trials. Note that the conventional sampling of odd-numbered 20 trials (1st, 3rd, 5th,
…
, 39th) included both former and latter trials as a part and, thus, can be inhomogeneous under baseline drifts. No significant difference was observed among four types of learning in the absence of pure long-term correlations, that is, when both short-term and long-term correlations were absent (left, not significant for all pairs, paired t test, 11 sessions with 77 neurons). The significant decrease at the green bar in the presence of pure long-term correlations demonstrates that the long-term correlations do harm for generalization (right, *p < 0.05, paired t test, 23 sessions with 189 neurons). The recovery of the classification success by the detrending or the conventional inhomogeneous sampling (trained by even-numbered and tested by odd-numbered trials) suggests that the brain can decode stimulus information under changing environments by using a sophisticated decoder (***p < 0.001, paired t test).
, as 16 stimuli were decoded. B, The baseline drifts, which cause long-term correlations, were visualized by the principal component analysis for the average responses to 16 visual stimuli (tuning curves) of the neurons with significant baseline drifts (to be precise, the same neuron pool as in C, right). The average responses for 1st–20th trials (turquoise blue) and 21th–40th trials (green) demonstrate that the entire activities of neurons shift over trials. C, Decoding accuracy in the absence and presence of pure long-term correlations. The cross-validated classification success rates for four types of learning were compared: (1) when trained by former trials and tested by former trials, (2) when trained by former trials and tested by latter trials, (3) when trained by former trials and tested by latter trials after the respective global means were subtracted for detrending (i.e., centering and equating the means of former and latter trials in B), (4) when trained by even-numbered trials and tested by odd-numbered trials. Note that the conventional sampling of odd-numbered 20 trials (1st, 3rd, 5th,
…
, 39th) included both former and latter trials as a part and, thus, can be inhomogeneous under baseline drifts. No significant difference was observed among four types of learning in the absence of pure long-term correlations, that is, when both short-term and long-term correlations were absent (left, not significant for all pairs, paired t test, 11 sessions with 77 neurons). The significant decrease at the green bar in the presence of pure long-term correlations demonstrates that the long-term correlations do harm for generalization (right, *p < 0.05, paired t test, 23 sessions with 189 neurons). The recovery of the classification success by the detrending or the conventional inhomogeneous sampling (trained by even-numbered and tested by odd-numbered trials) suggests that the brain can decode stimulus information under changing environments by using a sophisticated decoder (***p < 0.001, paired t test).


Extended Data
Supplementary 1
Supplementary R-code. Download Supplementary 1, TXT file
In this issue


