

Article Figures & Data
Figures
- Figure 1.
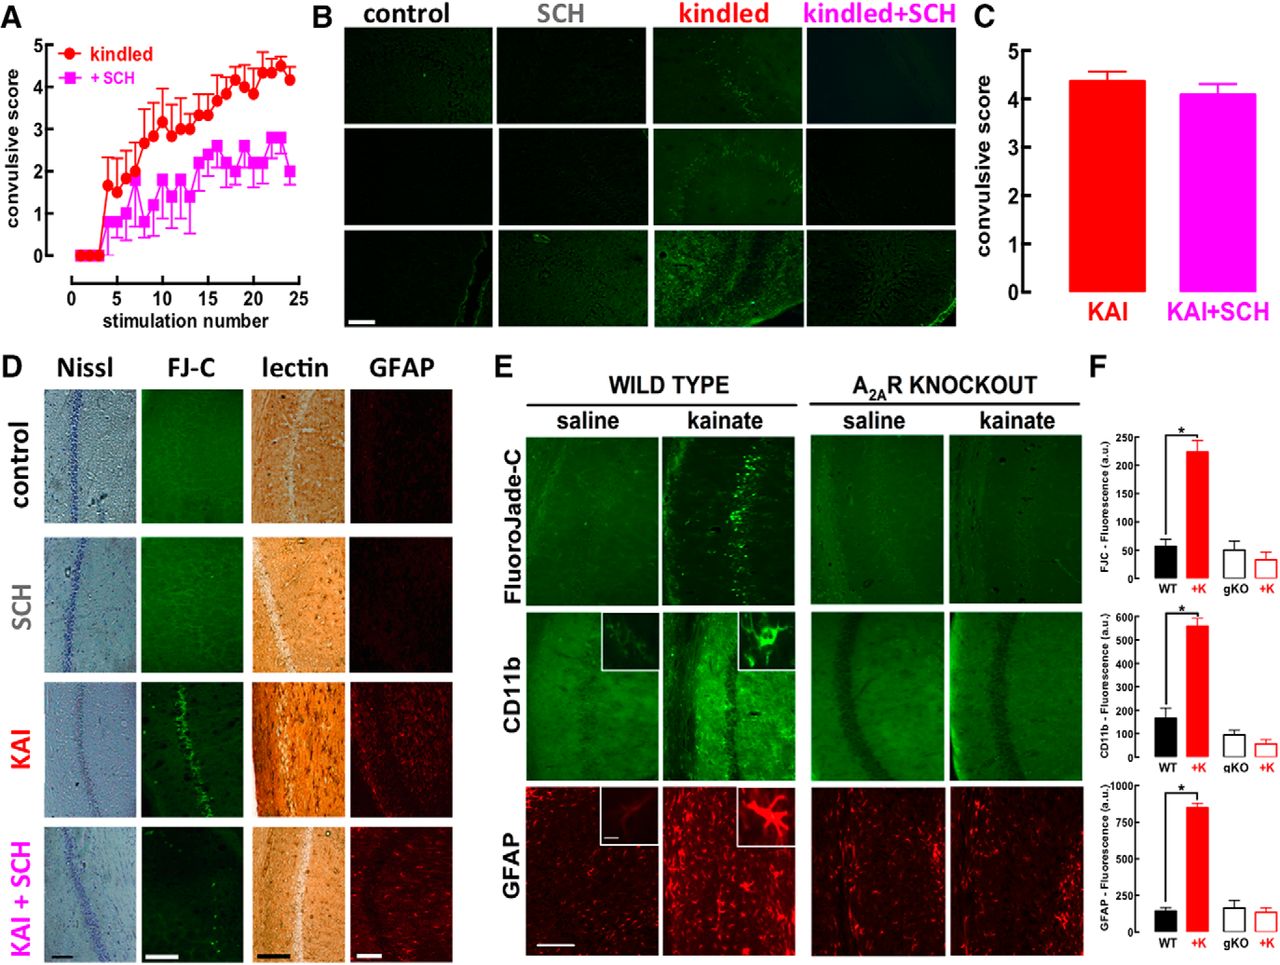
The pharmacological blockade or genetic elimination of adenosine A2AR prevents hippocampal damage caused by either amygdala kindling or kainate administration, while only attenuating the evolution of convulsions. A, Male Wistar rats were implanted with electrodes in the amygdala and stimulation twice daily progressively increased the severity of convulsions until triggering a fully kindled state (n = 7), which was reduced by a selective A2AR antagonist SCH58261 (0.05 mg twice daily; n = 8). B, Rats were killed 5 d after reaching fully kindled state and only the kindled rats treated with saline displayed degenerated cells, identified by FluoroJade-C labeling, in all hippocampal fields, whereas neither control nor SCH58261-treated rats, irrespective of being kindled or not, displayed FluoroJade-C staining. C, On intraperitoneal administration of kainate (KAI, 10 mg/kg; n = 11), rats treated with 0.05 mg/kg of SCH58261 (KAI+SCH, n = 12) displayed a similar pattern of acute convulsions (within 15 min and lasting no >75 min after KAI). D, However, SCH58261 prevented the histologic modifications observed in the hippocampus 24 h after kainate administration, namely, the dispersion of pyramidal cell layer with Nissl staining, the appearance of ruptured cells stained with FluoroJade-C (FJ-C), the modification of microglia staining with tomato lectin, and the increase of the number and density of GFAP-stained element compatible with astrogliosis. E, F, The administration of kainate (35 mg/kg, sc) to wild-type (WT) C57Bl6 mice (n = 11) triggered a convulsive period followed by the appearance of degenerated cells stained with FluoroJade-C together with a microgliosis and astrogliosis concluded from the altered staining of hippocampal sections with CD11b and GFAP, respectively; notably, the same exposure to kainate (+K) of littermates with a genetic deletion of A2AR (A2AR-KO, gKO) triggered a similar intensity of convulsions, which did not evolve into an evident pattern of neurodegeneration, microgliosis, or astrogliosis in the hippocampus after 24 h (n = 10). Calibration bars in each photograph are 100 µm, except the insets, which display higher magnifications of either astrocytes or microglia (calibration bar = 10 µm). Data are mean ± SEM; *p < 0.05 between bars or versus control (saline).
- Figure 2.
A convulsive period triggers an early upregulation of A2AR in glutamate synapses, likely involving a local translation of synaptic A2AR mRNA, and a delayed upregulation of A2AR in modified microglia cells in the hippocampus. A, The immuno-density of the microglia marker CD11b and of A2AR were low in hippocampal sections from saline-treated mice, whereas they were increased and colocated circa 22 h after a convulsive period triggered by the subcutaneous injection of 35 mg/kg kainate (B; confocal images representative of n = 3 mice per group). C, Kainate-induced convulsions triggered an increase of mRNA levels of CD11b and Iba1, characteristic of reactive microglia, only after 12–24 h in mouse hippocampal extracts (n = 6 for each time point). D, In contrast, an increased A2AR density was observed in synaptosomes (purified synapses) as soon as 2 h after kainate injection, whereas an A2AR binding density was only upregulated in total membranes after 24 h in the hippocampus (n = 5 for each determination, except n = 6 at 24 h). E, F, Kainate-induced A2AR upregulation was evident in glutamate synapses, as gauged by the kainate-induced increased A2AR immunoreactivity in hippocampal synaptosomes immuno-positive for vesicular glutamate transporter type 1 (vGluT1; n = 6). G, A2AR mRNA was identified in purified synaptosomes from the hippocampus (HIP), similarly to its presence in rat striatal extracts (STR) of the rat brain (n = 3). H, The synaptic localization of A2AR mRNA was confirmed in a pure axonal preparation from hippocampal neurons cultured in microfluidic chambers, which ensures a physical segregation of axon terminals and cell bodies (n = 2). I, The contribution of the local translation of synaptic A2AR mRNA for the kainate-induced upregulation of A2AR was concluded by the ability of cycloheximide (n = 4) to prevent the increase of A2AR binding density in synaptosomes exposed for 2 h to 5 μM kainate (n = 5). Data are mean ± SEM; *p < 0.05 between bars or versus control (saline, sal).
- Figure 3.
A convulsive period bolsters the function of synaptic A2AR in glutamatergic synapses. A, B, A2AR blockade with SCH58261 (50 nM) did not modified the depolarization-evoked release of glutamate (i.e., on augmentation of extracellular K+ as indicated by the horizontal insert line) from hippocampal synaptosomes from saline-treated mice (left panel, n = 8), but increased glutamate release from synaptosomes collected from convulsing rats 2 h after kainate administration (10 mg/kg, i.p.; right panel, n = 6). C, D, The amplitude of LTP, triggered by high-frequency stimulation (100 Hz for 1 s) of afferent Schaffer fibers, was larger in CA1 synapses from hippocampal slices collected 4 h after the administration of kainate (n = 6) than in saline-treated mice (n = 5). C, Pairs of superimposed fEPSP recorded 10 min before (black and red traces) and 60 min after the high-frequency train (dark or light blue traces) in slices from saline-treated mice (left pair) or 4 h after kainate administration (right pair). D, Time course of average fEPSPs before and after application of the high-frequency train (at time 0) in slices from control mice (black symbols), the aberrantly large LTP in slices collected 4 h after kainate administration (red symbols) and the ability of 50 nM SCH58261 to bring LTP amplitude back to control levels in these slices collected 4 h after kainate injection (orange symbols). This indicates that convulsions-induced aberrant synaptic plasticity is due to overfunctioning of A2AR. Data are mean ± SEM; *p < 0.05 versus control (saline in B; WT – wild type in D); **p < 0.05 comparing kainate versus kainate+SCH58261 in D.
- Figure 4.
Neuronal A2AR are critical to convert the initial convulsions-induced glutamate hyperfunctioning into a subsequent dysfunction and loss of glutamate synapses with the activation of calpains. A, B, Absence of alteration of the high-frequency train (100 Hz for 1 s, applied at time 0)-induced LTP of fEPSP recorded in the CA1 stratum radiatum on stimulation of afferent Schaffer fibers in hippocampal slices collected 4 h after the induction of a convulsive period on subcutaneous administration of 35 mg/kg kainate to mice with a genetic deletion of A2AR selectively in forebrain neurons (fb-A2AR-KO, n = 6). B, C, Likewise, fb-A2AR-KO mice analyzed 24 h after the injection of kainate did not display neuronal damage (FluoroJade-C, FJ-C), microgliosis (CD11b immunoreactivity) or astrogliosis (GFAP immunoreactivity), which was present in “wild-type” littermates (n = 8–10 mice per group). The conversion from the initial convulsions-induced hyperfunctioning of glutamate synapses into neurodegeneration first involved a synaptic dysfunction, as shown (D) by the lower amplitude of LTP in hippocampal slices collected 12 h after the administration of kainate to trigger a convulsive period within the first 75 min (red symbols) compared to saline-treated mice (black symbols; n = 10). E, The kainate-induced reduction of LTP amplitude at 12 h is not present in fb-A2AR-KO mice (n = 7). F, Summary of the time-dependent evolution of the impact of a kainate-induced convulsive period on hippocampal synaptic plasticity: LTP was first bolstered (at 4 h) and later depressed (at 12 h) in a manner strictly dependent on neuronal A2AR (lack of alterations in fb-A2AR-KO). G, H, The evolution from overexcitation to decreased synaptic plasticity caused by kainate-induced convulsions was associated with a loss of synaptic markers, namely, SNAP-25, syntaxin-I and vesicular glutamate transporters type 1 (vGluT1), which was seen 12 h after kainate administration (n = 4), but not after 4 h in wild-type mice (WT; open symbols, n = 4) or in fb-A2AR-KO mice (filled symbols, n = 4). I–K, This putative synaptotoxicity likely involved the recruitment of calpains, which was strictly dependent on the presence of neuronal A2AR: in fact, kainate triggered a decreased immunoreactivity of the calpain substrate, spectrin (I, J), and a parallel increase of the immunodensity of the calpain-derived spectrin breakdown degradation products (SBDP-145–150 kDa) in wild-type but not in fb-A2AR-KO mice (I, K; n = 5 in each group). Data are mean ± SEM; *p < 0.05 between bars or between kainate and saline (SAL) or versus control (100%).
- Figure 5.
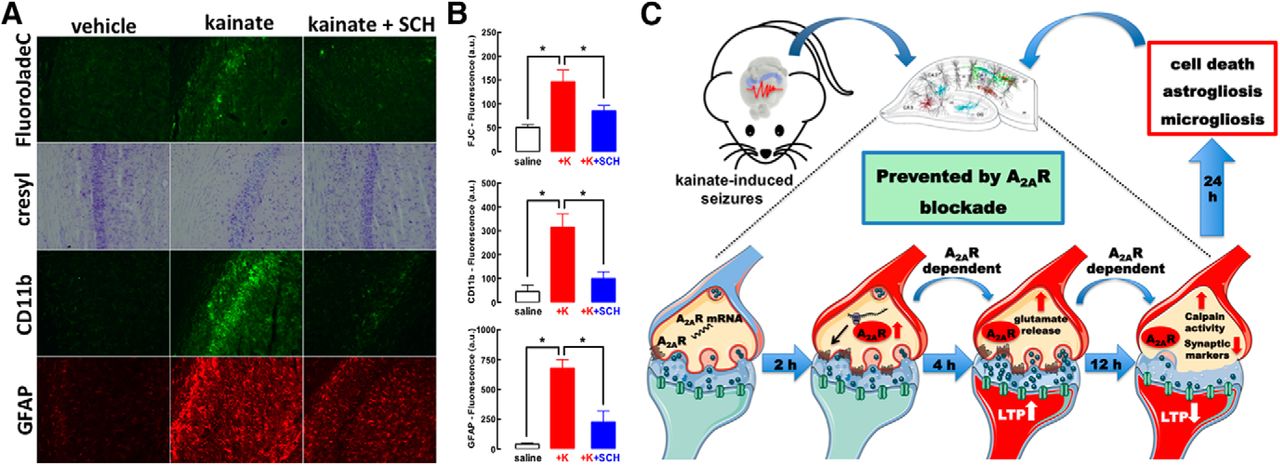
The time window between kainate-induced convulsions and synaptotoxicity and neurodegeneration offers a therapeutic window for A2AR antagonists to prevent convulsions-induced neurodegeneration. A, B, The selective A2AR antagonist SCH58261 (SCH, 0.05 mg/kg) applied intraperitoneally 4 h after kainate-induced convulsions was therapeutically effective to abrogate the emergence of neuronal damage (Nissl staining and FluoroJade-C), microgliosis (CD11b immunoreactivity), or astrogliosis (GFAP immunoreactivity) 24 h after kainate (K) administration (n = 5 mice per group). The data are mean ± SEM; *p < 0.05 between the indicated bars. C, The pharmacological or genetic blockade of A2AR did not affect kainate-induced convulsions but dampened the subsequent neurotoxicity. This neurotoxicity began with a rapid A2AR upregulation in glutamatergic synapses (within 2 h), through local translation of synaptic A2AR mRNA. This bolstered A2AR facilitation of glutamate release and of LTP in CA1 synapses (4 h), triggered a subsequent synaptotoxicity, heralded by decreased synaptic plasticity and loss of synaptic markers coupled to calpain activation (12 h), that predated overt neuronal loss accompanied by astrogliosis and microgliosis (24 h). All modifications were prevented by selective A2AR deletion in forebrain neurons. Overall, this shows that synaptic A2AR critically control the development of convulsions-induced neurodegeneration.


In this issue


