

Abstract
Spontaneous otoacoustic emissions (SOAEs) recorded from the ear canal in the absence of sound reflect cochlear amplification, an outer hair cell (OHC) process required for the extraordinary sensitivity and frequency selectivity of mammalian hearing. Although wild-type mice rarely emit, those with mutations that influence the tectorial membrane (TM) show an incidence of SOAEs similar to that in humans. In this report, we characterized mice with a missense mutation in Tecta, a gene required for the formation of the striated-sheet matrix within the core of the TM. Mice heterozygous for the Y1870C mutation (TectaY1870C/+) are prolific emitters, despite a moderate hearing loss. Additionally, Kimura’s membrane, into which the OHC stereocilia insert, separates from the main body of the TM, except at apical cochlear locations. Multimodal SOAEs are also observed in TectaY1870C/+ mice where energy is present at frequencies that are integer multiples of a lower-frequency SOAE (the primary). Second-harmonic SOAEs, at twice the frequency of a lower-frequency primary, are the most frequently observed. These secondary SOAEs are found in spatial regions where stimulus-evoked OAEs are small or in the noise floor. Introduction of high-level suppressors just above the primary SOAE frequency reduce or eliminate both primary and second-harmonic SOAEs. In contrast, second-harmonic SOAEs are not affected by suppressors, either above or below the second-harmonic SOAE frequency, even when they are much larger in amplitude. Hence, second-harmonic SOAEs do not appear to be spatially separated from their primaries, a finding that has implications for cochlear mechanics and the consequences of changes to TM structure.
- cochlear amplifier
- harmonic distortion
- outer hair cells
- spontaneous otoacoustic emissions
- tectorial membrane
Significance Statement
Aspects of cochlear function can be observed noninvasively by placing a sensitive microphone in the ear canal and recording stimulus-evoked otoacoustic emissions (OAEs). These responses provide information about the operation of the outer hair cells (OHCs), which are required for sensitivity and frequency selectivity, the hallmarks of normal cochlear operation in mammals. In addition to stimulus-related OAEs, spontaneous OAEs are frequently observed in humans as narrow-band signals in the absence of sound. Although wild-type mice are rarely spontaneous emitters, those with an altered tectorial membrane, the accessory structure to which the OHC stereocilia are attached, exhibit a dramatic increase in these phenomena. Determining the underlying basis for this phenotype has the potential to reveal important aspects of cochlear function.
Introduction
In the mammalian cochlea, inner hair cells (IHCs) are the primary sensory receptors and are connected to the vast majority of auditory nerve fibers. Although the more numerous outer hair cells (OHCs) receive <10% of the afferent innervation, most of the efferents descending from the medial olivocochlear complex synapse with OHCs (Spoendlin, 1985) and modulate their function by adjusting a tightly coupled feedback loop. The latter is thought to include the OHCs, the Deiters’ cells that link the OHCs to the underlying basilar membrane (BM), the reticular lamina that interconnects the apices of all hair cells, and the tectorial membrane (TM) that overlies the organ of Corti and into which the tallest OHC stereocilia are embedded (Dallos and Fakler, 2002; Hudspeth, 2014). This feedback system produces cochlear amplification and relies on prestin-based OHC electromotility (Dallos et al., 2008).
The TM extends medially from the limbal zone and terminates laterally as a thickening referred to as the marginal band (Fig. 1A). Several noncollagenous proteins are associated with the striated-sheet matrix within which the larger collagen fibers are embedded. These include CEACAM16, as well as α-tectorin (TECTA) and β-tectorin (TECTB; Goodyear and Richardson, 2018). In addition to the matrix, a covernet is located on the upper surface. In the basal half of the mouse cochlea, Hensen’s stripe presents as a ridge projecting down from the lower surface of the membrane just medial to the IHC stereocilia (Goodyear and Richardson, 2018). Finally, a thickening along the lower surface was originally described by Hardesty (1908), who was able to better control the histologic artifacts that plagued early efforts to examine this structure. Subsequently, Kimura (1966) showed that the tallest OHC stereocilia are inserted into this part of the TM, and thus this region has been referred to as Kimura’s membrane.

A schematic representing tectorial membrane anatomy. A, The WT mouse organ of Corti. B, The TectaY1870C/+ mouse organ of Corti. The drawings are based on anatomical results published by Legan et al. (2005).
At least 33 mutations in TECTA are associated with both dominant (DFNA8/12) and recessive (DFNB21) forms of human hereditary deafness (Hildebrand et al., 2011). Because of this connection to hearing loss, mutants have been created for some of the human mutations in the genes that encode proteins required for the formation of the striated-sheet matrix. In mice lacking Tecta, hearing loss is present across frequency, consistent with loss of amplification and detachment of the TM in its entirety from the organ of Corti (Legan et al., 2000). In contrast, TectaY1870C/+ mice heterozygous for a missense mutation (c.5609A>G, p.Tyr1870Cys) that causes human hereditary deafness (Legan et al., 2005), exhibit a semidominant phenotype. In this mutant (Fig. 1B), the limbal attachment is reduced, Kimura’s membrane separates from the main body of the TM while maintaining contact with the OHC stereocilia, the marginal band and Hensen’s stripe are absent, and collagen fibrils erupt from the upper surface of the membrane. Although the striated-sheet matrix remains near normal in the lateral hair cell region, large holes are prominent throughout (Legan et al., 2005). Despite these changes, the distortion product otoacoustic emissions (DPOAEs) are reduced to a lesser degree than the compound action potentials, which show large threshold shifts.
Our previous work on various TM mutants showed that several exhibited spontaneous otoacoustic emissions (SOAEs), phenomena associated with cochlear amplification and recorded in the ear canal in the absence of acoustic stimulation. SOAEs, as well as stimulus frequency otoacoustic emissions (SFOAEs), are considered by some to originate through a mechanism of coherent reflection, while DPOAEs are dominated by contributions from nonlinear distortion sources (Shera and Guinan, 1999). Although relatively common in humans (Probst et al., 1986), we observed spontaneous phenomena in only ∼6% of our control animals over the ∼10 years that we have been making these recordings. It was, therefore, surprising that 70% of Ceacam16βgal/βgal mice lacking CEACAM16 that were <8 weeks of age (67 of 95 homozygotes) produced SOAEs (Cheatham et al., 2014). In the absence of CEACAM16, the striated-sheet matrix does not form, Hensen’s stripe is absent and large holes appear, especially in the apical portion of the TM. Furthermore, 79% of OtoaEGFP/EGFP mice (34 of 43 homozygotes) lacking OTOANCORIN (OTOA), in which the TM is detached from the limbus, also produce SOAEs (Cheatham et al., 2016). Because of the human hearing problems associated with TM defects and the unusual phenotype discovered in Ceacam16βgal/βgal and OtoaEGFP/EGFP mice, we examined emissions and auditory brainstem responses (ABRs) in TectaY1870C/+ mice and their wild-type (WT) controls. We also further defined the anatomical changes at various positions along the cochlear partition to gain further insights into the active amplification process and how it is controlled.
Materials and Methods
Animals
TectaY1870C mice were on a mixed, variable B6/129S background and were initially acquired from the Freeman Laboratory at Massachusetts Institute of Technology (Cambridge, MA; Sellon et al., 2014). Genotyping was outsourced to Transnetyx. Young male and female mice were tested using OAEs and ABRs between 3 and 9 weeks of age. Animals were excluded from the study if they showed evidence of ear canal anomalies such as extensive wax or inflammation, which was not common. It should also be understood that not all mice were tested with all measures as this can require several hours of testing and multiple doses of anesthesia. This is the reason for the varying numbers of animals in the different plots. All procedures were approved by the Northwestern University Institutional Animal Care and Use Committee, the Animal Welfare and Ethical Review Board at the University of Sussex, and by the National Institute on Deafness and Other Communication Disorders, and were performed in accordance with the UK Animals (Scientific Procedures) Act.
Emission measurements
Following a pinna reflex test, the mouse was anesthetized using ketamine (120 mg/kg, i.p.) and xylazine (10 mg/kg, i.p.), with supplemental injections provided as needed. The animal was then moved into a sound isolation booth and placed on a heating pad. A custom emission probe containing a sensitive microphone (FG-3652-CX, Knowles Electronics, Itasca, IL) was inserted into the ear canal to form a tight seal. After the sound calibration was performed using SysRes (Neely and Stevenson, 1992), the noise floor in quiet was sampled for 3.8 min by performing a spectral average of 40 samples of the canal pressure into a 524,288 point buffer (Cheatham et al., 2014). A fast Fourier transform was performed on the time wave form with a resolution of 96,000/524,288 = 0.183 Hz. The spectrum was then smoothed before integrating energy into windows of 93 Hz. SOAEs <0 dB SPL were not used for analysis. The DPOAEs were generated using two primary stimulus tones, f1 and f2, with a frequency ratio f2/f1 = 1.2. Iso-input functions (or DP-grams) were measured for 21 f2 frequencies ranging from 3 to 47 kHz (step size increasing with f2 frequency) and for the level of f1 (L1) = 50 dB SPL and for the level of f2 (L2) = 35 dB SPL, as well as for L1 = L2 = 70 dB SPL. All signals were generated by using a 24-bit sound card (Card Deluxe) with a sampling rate of 96 kHz. Input–output functions were also acquired at f2 = 12 and f2 = 27 kHz to obtain a threshold, which was defined as the level of f1 required to generate a DPOAE of 0 dB SPL. This approach is similar to that used by the Liberman group (Maison et al., 2010). For these functions, L1 was 10 dB higher than that for L2, and stimuli increased in steps of 5–10 dB. Stimulus delivery and data acquisition were controlled using Emav (Neely and Liu, 1994). SFOAEs were measured between 4 and 38 kHz (step size, 1.172 kHz) using a single probe/suppressor level (50/75 dB SPL, respectively) combination. Probe response was measured alone and in the presence of a suppressor placed 86 Hz below probe frequency, which results in near-complete suppression of the emission (Brass and Kemp, 1993; Keefe et al., 2008). Subtracting the probe response vectors with and without the suppressor provides the SFOAE residual (Dreisbach et al., 1998; Siegel et al., 2001), which corresponds to the total SFOAE amplitude when suppression is complete. For the SOAE suppression experiments, a function generator was used to produce a sinusoid of the desired frequency. The magnitude of this external tone (Text), recorded in the ear canal, was computed in the same way as that for the SOAE. The external tones were also measured in a tubing coupler with a volume that was similar to the mouse ear canal with emission probe inserted. These measurements allowed us to learn whether presentation of the external tone generated distortion in the sound. The latter was not observed for the suppressor levels reported here. Further details are provided in previous publications (Cheatham et al., 2014, 2016).
Measurements of auditory brainstem responses
To assay the impact of TM changes on the input to the IHC stereocilia and ultimately on the output of the cochlea, ABR thresholds (mean ± SEM) were acquired at 12 and 27 kHz, the same f2 frequencies where DPOAE growth functions were also recorded. Following the emission measurements, the mice were outfitted with three subdermal needle electrodes to collect the evoked potentials. Recordings were made at the mastoid, vertex, and also at the shoulder on the side opposite to the mastoid electrode. Only a small amount of tissue was in contact with the vertex and mastoid electrodes to minimize the pickup area (Shaheen et al., 2015). Outputs of the mastoid and vertex electrodes were measured relative to the indifferent electrode in the shoulder region. These responses were differentiated, amplified 1000×, and bandpass filtered (0.3–2.0 kHz). Tone-burst stimuli were 10 ms in duration, including the 1 ms rise/fall times. Signal levels were decreased in 5 or 10 dB steps, and responses were averaged 3000 times to determine the level at which all ABR waves I–IV disappeared into the noise floor. Because the pinna was intact, the speculum was placed at the entrance to the ear canal in a quasi-free-field arrangement. SPLs were determined off-line using a real pinna coupler calibration. In this procedure, a one-eighth inch B&K condenser microphone was placed at the position of the tympanic membrane, which had been removed (Pearce et al., 2001).
Statistical analyses
Data are reported as the means ± SEM. Some statistical comparisons were obtained using a two-tailed Student’s t test and assuming unequal variance between samples (Excel, Microsoft). However, see Figure 3 for results in which we performed a two-way ANOVA using a between-group factor of mouse genotype and a within-group factor of f2 frequency (see Fig. 3A) or stimulus level (see Fig. 3C,D). The results of Bonferroni-corrected post hoc t tests are also provided. Finally, a linear regression was also performed using a least-squares fitting procedure for the data plotted in Figure 5B [Mathematica (Wolfram.com)].
Morphologic analysis
Following the killing of the mice, the cochleae were fixed in glutaraldehyde by immersion for ∼2 h and then postfixed in 1% OsO4 for ∼1 h. Samples were then decalcified, dehydrated, and embedded in epoxy resin. The 1 μm sections were obtained parallel to the modiolar axis of the cochlea such that the ∼4, 8, 20, and 40 kHz locations were obtained in a single section. These locations were designated using the Liberman Laboratory Protocol (Liberman et al., 2015). Sections were then stained with 1% toluidine blue. Further details can be obtained from previous publications (Legan et al., 2005; Cheatham et al., 2014).
Results
TectaY1870C/+ mice produce numerous SOAEs although thresholds are elevated
Inasmuch as previously characterized TM mutants lacking either CEACAM16 (Cheatham et al., 2014) or OTOA (Cheatham et al., 2016) displayed an increase in SOAEs, we initially assayed for this type of emission, as shown in Figure 2. Here SOAE spectra are provided for 3 of the 20 wild-type Tecta+/+ mice that had recordable SOAEs and for 32 of the 51 heterozygous TectaY1870C/+ mice with SOAEs. Notice the striking difference between heterozygous (Fig. 2, red) and WT (Fig. 2, black) mice as to the size and the propensity to produce SOAEs. Although only 6.1% of all WT mice (16 of 262) we have studied independent of genetic background show this behavior, 62.7% of TectaY1870C/+ mice (32 of 51) are spontaneous emitters. In this mutant, SOAEs are generated over a wide frequency range, and the average (±SEM) SOAE frequency (15.4 ± 0.8 kHz; n = 203) is lower than that in WT mice (22.3 ± 0.9 kHz n = 16; p < 0.01). These mutants can also generate large SOAEs. Although some approach 50 dB SPL in magnitude, the average mutant SOAE magnitude was 18.3 ± 0.3 dB SPL (n = 203). In contrast, the average WT magnitude was 14.2 ± 1.4 dB SPL for the small percentage of WT animals with SOAEs (n = 16), which is statistically lower than in heterozygotes (p < 0.01). In fact, the largest SOAE ever recorded in WT mice was 24.5 dB SPL. In addition, TectaY1870C/+ mice produced an average of 6.3 simultaneous SOAEs per ear. This is nearly double that in any other mutant or in any WT control, where an average of 2.1 SOAEs are recorded in a given ear.

SOAE spectra. WT controls with SOAEs are plotted in black; the TectaY1870C/+ mice are in red. To reduce overlap, the traces are arbitrarily shifted vertically.
Because some heterozygotes did not produce measurable SOAEs, we recorded DPOAEs at 2f1-f2, the strongest of the intermodulation distortion components, to quantify the degree to which amplification is reduced. Iso-input functions (also known as DP-grams) are provided in Figure 3A, where both primaries were presented at 70 dB SPL. For these measurements, the reported parameter was f2 frequency and the frequency ratio (f2/f1) remained constant at 1.2. Although TectaY1870C/+ mice have reduced DPOAEs, those animals with SOAEs (red) produce larger DPOAEs than the heterozygotes lacking SOAEs (blue). A two-way ANOVA revealed that the WT controls and the two groups of mutant mice were statistically different from one another (genotype main effect, F(2,56.7) = 219.34). The effect of frequency was also significant (frequency main effect, F(19,1076) = 115.20), as were the interactions between genotype and frequency (F(38,1076) = 5.53). Bonferroni-corrected post hoc t tests (corrected α level, p < 0.003) also revealed that DPOAE magnitudes were statistically different at several f2 frequencies between WT and TectaY1870C/+ mice with SOAEs (5.9–15.5 and 20.5–47.0 kHz), between WT and TectaY1870C/+ mice without SOAEs (4.5–47.0 kHz), and between TectaY1870C/+ mice with and without SOAEs (5.9, 8.9–20.5, and 35.6 kHz).

DPOAEs. A, Average (±SEM) iso-input functions (DP-grams, L1 = L2 = 70 dB SPL) for WT controls (black) and for TectaY1870C/+ mice plotted as two groups: those with (red lines) and those without SOAEs (blue lines). The average (±SEM) noise floor is in gray. B, Difference in dB between the mutants with and without SOAEs and the WT controls. A horizontal line is appended to emphasize that animals with DPOAE reductions greater than ∼25 dB do not produce SOAEs. C, D, DPOAE input–output functions. Results for the TectaY1870C/+ mice are plotted in the following two groups: those with SOAEs (red) and those without SOAEs (blue). The average (±SEM) growth functions for WT controls are in black. C, f2 = 12 kHz; D, f2 = 27 kHz.
The decibel differences between TectaY1870C/+ mice with or without SOAEs versus WT mice is also highlighted in Figure 3B. These functions show the largest difference relative to controls in the mid-frequency region where DPOAEs are the largest. However, heterozygotes lacking SOAEs produce DPOAEs that are reduced to a much greater degree when compared with WT controls. The horizontal line at −25 dB indicates that SOAEs can be recorded in mice with loss of sensitivity but only when reductions in DPOAE level are less than ∼25 dB. Although DP-grams were also collected at a lower level (L1 = 50 dB; L2 = 35 dB; data not shown), these responses were generally in the noise floor for all heterozygotes independent of SOAE generation.
To obtain “thresholds,” growth functions (also known as input–output functions) were recorded (Fig. 3C,D) and used to obtain a measure of sensitivity by defining DPOAE threshold as the level of f1 that generates a DPOAE of 0 dB SPL (Maison et al., 2010). As in Figure 3A, results are provided for Tecta +/+ mice (Fig. 3C,D, black) and for TectaY1870C/+ mice with (Fig. 3C,D, red) or without SOAEs (Fig. 3C,D, blue). The input–output functions show threshold shifts for two primary pairs (i.e., f2 = 12 and 27 kHz). These results are presented as two groups. At f2 = 12 kHz, heterozygous mice with SOAEs have an average DPOAE threshold shift of 22 dB, while those without SOAEs are shifted by 32 dB. Only those TectaY1870C/+ mice with the largest DPOAEs at 2f1-f2, and the smallest threshold shifts, produce SOAEs. In fact, the incidence of SOAEs would have been higher if heterozygous mice with very small DPOAEs, and thus, presumably, having a large decrease in cochlear gain, were not included. A two-way ANOVA showed a genotype main effect (F(2,45.8) = 104.3), a level main effect (F(11,504.1) = 142.2), as well as interactions between mouse genotype and level (F(22,504.2) = 9.3). Subsequent Bonferroni-corrected post hoc t-test (corrected α level, p < 0.004) also indicated that WT animals were statistically different from TectaY1870C/+ mice with SOAEs for L1 between 30 and 75 dB SPL, and at 90 dB SPL. Controls were also different from TectaY1870C/+ mice without SOAEs for L1 between 35 and 90 dB SPL. Finally, the mutant mice with and without SOAEs were statistically different for L1 between 55 and 80 dB SPL. At f2 = 27 kHz (Fig. 3D), threshold shifts increased relative to those at f2 = 12 kHz, but primarily for those heterozygotes with SOAEs. The two-way ANOVA revealed a mouse genotype main effect (F(2,37.3) = 72.1), a level main effect (F(9,335.4) = 80.2), as well as interactions between genotype and level (F(18,335.4) = 5.7). Subsequent Bonferroni-corrected post hoc t tests (corrected α level, p < 0.005) also indicated that WT animals were statistically different from TectaY1870C/+ mice with SOAEs for L1 between 40 and 80 dB SPL, and at 90 dB SPL. Controls were also different from TectaY1870C/+ mice without SOAEs for L1 between 50 and 90 dB SPL. There was, however, no statistically significant difference between the two groups of mutant mice at any stimulus level for f2 = 27 kHz.
It is unlikely that a difference in age between the two groups of heterozygotes, those with and those without SOAEs, underlies the degree to which they produce SOAEs, as mice with missense mutations in Tecta are not known to have progressive hearing loss, at least during the first 5 months of life (Legan et al., 2014). In addition, the heterozygous mice without SOAEs were younger (28.4 d of age) than heterozygotes with SOAEs (33.1 d of age) and were similar in age to their WT controls (29.7 d of age). We also wish to emphasize that the control data for this strain are similar to previous results obtained for all of the controls used in our previous work on various TM mutants. Specifically, the average (±SEM) DPOAE threshold for the controls in this study at f2 = 12 kHz was 37.5 ± 0.8 dB SPL (n = 16), while that for the Ceacam+/+ controls on a B6 background was 37.2 ± 0.6 dB SPL (n = 21; Student’s t test, p = 0.72). At f2 = 27 kHz, the average (±SEM) WT DPOAE threshold in this report was 45.4 ± 2.0 dB SPL (n = 11), while that for the Ceacam+/+ controls was 45.0 ± 1.5 dB SPL (n = 11; Student’s t test, p = 0.87).
In contrast to the DPOAEs, thresholds obtained using ABRs were shifted by ∼50 dB at all frequencies for all mutants, independent of whether they produced SOAEs or not. This observation is consistent with previous measurements of compound action potential thresholds in this mutant (Legan et al., 2005). For example, WT ABR thresholds (n = 8) at 12 kHz were 18.3 ± 1.2 dB SPL (mean ± SEM), while those for the TectaY1870C/+ animals (n = 15) were 67.8 ± 1.5 dB SPL, with an average threshold shift of 49.5 dB. At 27 kHz, the WT ABR thresholds were 20.7 ± 1.5 dB SPL, while those for the TectaY1870C/+ were 72.5 ± 1.6 dB SPL, resulting in an average threshold shift of 51.8 dB. The greater loss in neural responses relative to the emissions recorded in TectaY1870C/+ mice is thought to relate to an increase in the subtectorial space in the region around the IHC stereocilia (Fig. 1B), resulting in reduced IHC stimulation (Legan et al., 2005).
Anatomical changes in TectaY1870C/+ mice are location dependent
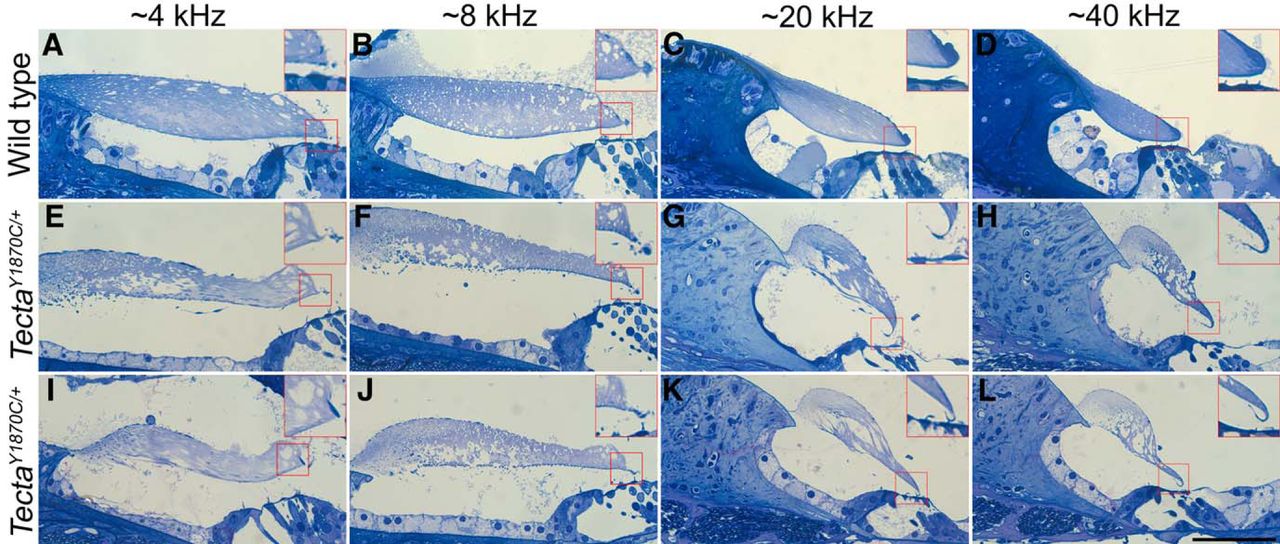
Given the frequency dependence of the threshold shifts, we re-examined the anatomy since the previous publication (Legan et al., 2005) described the structural changes at a single basal location (Fig. 1B, diagrammatic form). Hence, we provide additional information to obtain a better understanding of changes longitudinally along the cochlear spiral. In Figure 4, images from a WT control (Fig. 4A–D) and from two TectaY1870C/+ mice are shown at four locations corresponding to regions that are associated with ∼4, 8, 20 and 40 kHz, according to the Liberman Laboratory protocol. At all locations, the marginal band is detached, the extent of the limbal attachment zone is reduced and holes appear in the striated-sheet matrix within the core of the TM. In addition, and as reported by Legan et al. (2005), Kimura’s membrane is delaminated at both the 20 and 40 kHz locations in heterozygotes (Fig. 4G,H,K,L). The inset in Figure 4K also shows that the OHC stereocilia remain connected to the detached Kimura’s membrane. At the more apical locations (4 and 8 kHz; Fig. 4E,F,I,J), delamination is not obvious. Since the degree to which Kimura’s membrane is detached from the body of the TM varies along the cochlear partition, this anatomical change could contribute to the variability in threshold shifts among the TectaY1870C/+ animals.

A–L, Anatomical changes in the TM. Toluidine blue-stained sections from one WT mouse (A–D) and two TectaY1870C/+ mice (E–H, I–L) at locations along the cochlear spiral associated with regions coding ∼4, 8, 20, and 40 kHz. Boxed regions show 2× enlargements of Kimura’s membrane. Scale bar, L (for A–L), 50 μm.
Multimodal SOAEs are observed TectaY1870C/+ mice
We also examined the relationship between individual emissions and noticed that some SOAE frequencies were integer multiples of a lower frequency SOAE. To distinguish these components, we plotted SOAE magnitude as a function of SOAE frequency for the TectaY1870C/+ animals that produced SOAEs (n = 32). In Figure 5A, SOAEs are plotted as red circles such that “primary” SOAEs associated with higher harmonic/secondary SOAEs appear as filled circles (n = 27). SOAEs lacking associated harmonics are designated as “solo” SOAEs (n = 143) and appear as open red circles in Figure 5A. The blue triangles in Figure 5Adesignate SOAE frequencies that are twice the frequency of a primary SOAE (i.e., second harmonics; 2*SOAE, n = 27). The black squares in Figure 5Arepresent SOAEs with frequencies that are three times that of a primary SOAE frequency (3*SOAE, n = 6). We will refer to SOAEs that are integer multiples of lower-frequency primary SOAEs as harmonic or secondary SOAEs. The number of SOAEs excluding those that appear to be secondary SOAEs (i.e., excluding both second and third harmonic SOAEs) is 170 (Fig. 5A, all red symbols). As a group, primary plus solo SOAEs have an average (±SEM) frequency of 13.5 ± 0.4 kHz and an average magnitude of 18.3 ± 0.9 dB SPL (n = 170). Primary SOAEs with harmonic partners (n = 27) have a lower average frequency of 11.3 ± 0.5 kHz (Student’s t test, p < 0.01) but a larger average magnitude of 35.0 ± 1.4 dB SPL (Student’s t test, p < 0.01). On average (±SEM), the second (third) harmonic SOAE frequencies were 22.7 ± 1.0 kHz (31.3 ± 1.2 kHz), and the magnitudes were 21.5 ± 1.3 dB SPL (15.0 ± 1.8 dB SPL). In addition, the 27 second harmonic SOAEs were on average 13.5 dB down in magnitude from the fundamental primary SOAE and were always lower in level. In contrast, the third harmonics were on average 23.3 dB down.

SOAE Magnitudes. A, SOAE magnitude is plotted as a function of SOAE frequency such that primary SOAEs with harmonic partners appear as solid red circles. The second-harmonic SOAEs (2*SOAE) are the blue triangles, and the third harmonic SOAEs (3*SOAE) are the black squares. Solo SOAEs lacking harmonic partners are plotted as red open circles. B, The magnitudes of second-harmonic SOAEs (2*SOAE) are plotted as a function of SOAE magnitude to emphasize that the largest SOAEs are usually associated with second-harmonic partners. The open red circles, arbitrarily plotted at 0 dB SPL, represent solo SOAEs that are not associated with harmonic partners. The blue triangles represent primary SOAEs that were associated with second-harmonic partners. SOAEs <0 dB SPL were not used for analysis. A regression line (SPL2*SOAE = 4.93 + 0.474*SPLSOAE) is appended to highlight the relationship between the magnitude of the primary SOAE and that of its second-harmonic partner.
Harmonics also appear to be associated with the larger SOAEs, as shown in Figure 5B, where second-harmonic (2*SOAE) magnitude is plotted as a function of SOAE magnitude. Solo SOAE magnitudes (Fig. 5B, open red circles) do not have second-harmonic partners; hence, they are arbitrarily plotted at 0 dB SPL. Primary SOAE magnitudes with harmonic partners are plotted with blue triangles. The average magnitude for primary SOAEs with harmonic partners (35.0 ± 1.4 dB SPL; n = 27; Fig. 5A, filled red circles) was statistically larger (p < 0.001) than for solo SOAEs (14.1 ± 0.01 dB SPL, n = 143; Fig. 5A, open red circles). In addition, there is a general tendency for larger primaries to associate with larger harmonic partners. In fact, one can fit a linear regression line between second-harmonic and primary magnitudes in the form: SPL2*SOAE = 4.93 + 0.474*SPLSOAE. The apparent correlation between primary and secondary SOAE levels (correlation coefficient, r = 0.51) suggests that in cases of low-level solo SOAEs, their “secondary” SOAEs may have fallen below the system noise floor.
Harmonic SOAEs are recorded in regions where DPOAEs and SFOAEs are small or absent
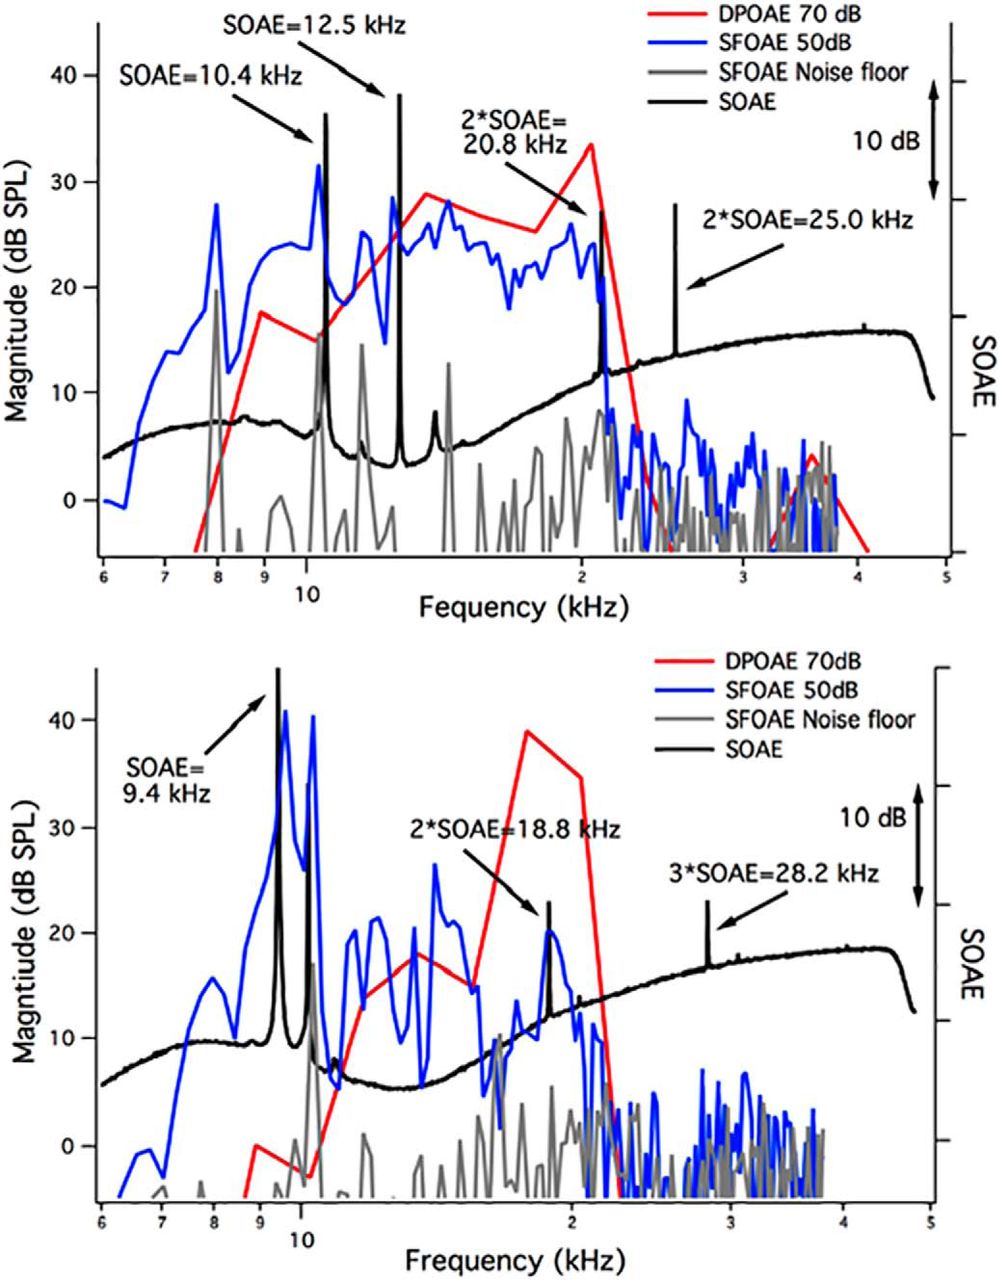
In Figure 6, we provide examples of the SOAE spectra (black) in TectaY1870C/+ mice plotted along with the individual animal’s iso-input function or DP-gram at 70 dB SPL (red) and their SFOAEs collected at 50 dB SPL (blue), along with the noise floor (gray). In Figure 6A, second-harmonic SOAEs (2*SOAE) are associated with primary SOAEs at 10.4 and 12.5 kHz. Notice that the second harmonic at 25.0 kHz lies beyond the high-frequency cutoff of the DP-gram (i.e., at a frequency where amplification is presumably lacking). The high-frequency SFOAEs are also very small or in the noise. In Figure 6B, the primary SOAE at 9.4 kHz is associated with both second and third harmonics, with the latter beyond the high-frequency cutoff of the DP-gram and where the SFOAEs are in the noise. This animal is one of only two examples where the third harmonic was comparable in magnitude to the second harmonic. In all other TectaY1870C/+ mice (n = 19 of a total of 21 animals) with harmonic patterns, the spectra contained only second harmonics. If present, third harmonics were much smaller in magnitude.

SOAEs, DPOAEs, and SFOAEs in TectaY1870C/+ mice. A, B, SOAE spectra (black, right ordinate), individual DPOAEs at 70 dB SPL (red, left ordinate), and individual SFOAEs at 50 dB SPL (blue, left ordinate) are provided for two TectaY1870C/+ mice showing primary and secondary/harmonic SOAEs. The SFOAE noise floor is also appended (gray, left ordinate).
Multimodal SOAEs are not suppressed by nearby external tones
To study the suppressibility of SOAEs, we introduced external tones (Texts) at various levels and frequencies to determine the degree to which they reduced the magnitudes of either primary and/or secondary SOAEs. In Figure 7A, the Text at 9.5 kHz is just above a primary SOAE at 8.8 kHz (46 dB SPL) that has a second-harmonic SOAE partner at 17.6 kHz (27 dB SPL). For all panels in Figure 7, the SOAE spectra obtained in the absence of a suppressor, the alone conditions, are plotted in black. When the external tone was presented at 43 dB SPL (Fig. 7A, blue trace), it had no effect on the primary SOAE or on its second-harmonic partner at 17.6 kHz (2*SOAE). However, at 56 dB SPL (Fig. 7A, green trace), the 9.5 kHz suppressor reduced the SOAE and the 2*SOAE by ∼6 dB. When the Text increased to 59 dB SPL (Fig. 7A, red trace), the primary SOAE was seen only as a ripple in the noise floor, and its second-harmonic partner was eliminated. Because the primary SOAEs associated with second-harmonic partners are large, the level of the external tone must be relatively high to produce any reduction. Hence, the suppressor tone also generated a second-harmonic component in the spectrum (2*Text), although no distortion was observed in coupler measurements.

The use of external tones to suppress SOAEs. A, A Text at 9.5 kHz is introduced just above the primary SOAE at 8.8 kHz (46 dB SPL) and increased in level. The suppressor was not associated with a second harmonic when presented at 43 dB SPL (blue trace), but increasing its level to 56 dB SPL (green trace) and to 59 dB SPL (red trace) generated a 2*Text component at 19 kHz. Changes did not occur in either primary or secondary SOAEs for Text = 43 dB SPL but were observed at both 56 and 59 dB SPL. At 59 dB SPL, the suppressor nearly extinguished the primary SOAE, which is now observed as a small ripple in the noise floor. The SOAE-alone condition is plotted in black. To prevent overlap, the SOAE traces have been shifted vertically. B, Results obtained in the same mouse (i.e., the primary SOAE is 8.8 kHz, the second-harmonic SOAE is 17.6 kHz, but the external tone is now 18.2 kHz at 54 dB SPL). For clarity, the SOAE spectrum obtained in the presence of the Text is shifted horizontally to the right. Minimal changes are observed in the SOAE spectrum when the Text is presented. Because the SOAEs are plotted on an expanded ordinate in this panel, the SOAE at ∼13 kHz is now visible. This component appeared as a small blip in the waveforms shown in A. C, Data from another TectaY1870C/+ mouse where an external tone at 14.4 kHz is introduced at either 38 or 49 dB SPL in an attempt to suppress the second-harmonic SOAE (2*SOAE = 16.0 kHz) associated with the primary SOAE at 8.0 kHz. The SOAE alone is plotted in black, while the SOAEs plus the external tone are in red (Text = 49 dB SPL) and blue (Text = 38 dB SPL). Spectra obtained in the presence of the Text are shifted slightly to the left for clarity.
The corollary of this experiment was then performed in the same animal by introducing a Text at 18.2 kHz, just above the secondary SOAE in frequency, as shown in Figure 7B. No changes were observed when the Text was introduced at 54 dB SPL (i.e., 26 dB SPL larger than the second-harmonic SOAE at 17.6 kHz; Fig. 7B, red trace). In this example, the SOAE spectrum with the Text is shifted horizontally to the right for clarity. A second example appears in Figure 7C, where a relatively large SOAE is recorded at 8.0 kHz (37 dB SPL). A higher-frequency emission also appears at twice the frequency of the lower component (i.e., 2*SOAE = 16.0 kHz; 21 dB SPL). In Figure 7C, the traces in black show the SOAE recorded alone, while the traces in red and blue were obtained in the presence of a Text at 14.4 kHz, which is slightly lower in frequency than the second-harmonic SOAE. The SOAE spectra obtained with the Text are shifted down in frequency (to the left) for clarity. In Figure 7C, the Text at 14.4 kHz failed to reduce the second harmonic when introduced at 38 or 49 dB SPL; in other words, when it was either 17 or 28 dB SPL larger than 2*SOAE. We have used this approach on several ears (n = 9) of this type and were never able to reduce the second-harmonic SOAE with an external suppressor tone either slightly higher or lower in frequency, but much larger in magnitude. These results are consistent with the idea that secondary, higher-frequency SOAEs are likely harmonics of lower-frequency SOAEs. In other words, both the lower frequency “fundamental” SOAE and what appears to be its harmonic partner seem to originate from the same place along the cochlear spiral. This possibility is consistent with the observation that several secondary or harmonic SOAEs have frequencies that lie above the high-frequency cutoffs of the DPOAE and SFOAE iso-input functions collected at 70 and 50 dB SPL, respectively (Fig. 6A,B).
Discussion
The TM as a whole stabilizes the active process, while Kimura’s membrane is the subcomponent essential for OHC transduction
The TM is part of an amplifying, mechanical feedback loop in which OHCs function as prestin-actuated motors (Zheng et al., 2000). When the internal dynamics within the feedback loop are altered, loop gain can be maintained, but stability decreases and SOAEs emerge (Cheatham et al., 2014, 2016). In other words, genetically induced changes to TM properties alter the balance among individual components of this tightly coupled feedback system. Although structural changes in the main body of the TM result in an increased propensity to generate SOAEs, with different alterations producing varied phenotypes, delamination of Kimura’s membrane in TectaY1870C/+ mice produces the greatest number of and largest SOAEs. This observation suggests that the body of the TM evolved to largely damp out spontaneously generated internal vibrations, and that when its influence is removed, the system becomes oscillatory. It seems that only perturbations, such as changes in TM structure, can reveal how difficult it is to maintain stability in the mammalian cochlea where the feedback-induced gain of the OHCs is ∼50 dB (Ryan and Dallos, 1975; Dallos and Harris, 1978; Liberman et al., 2002).
While the TM is a complex structure, hitherto it has been considered as a single element that influences the dynamic mechanical behavior of the cochlea. In TectaY1870C/+ mice, the part of the TM that interacts with OHC stereocilia, Kimura’s membrane, is delaminated from the main body of the TM, allowing us to parcel its role independently from that of the TM proper. For example, alterations in TM anatomy in the TectaY1870C/+ mice, and specifically the delamination between Kimura’s membrane and the core of the TM, have several consequences. First, previous work (Legan et al., 2005) and the current work (DPOAEs) indicate that OHC stereocilia remain coupled to Kimura’s membrane such that OHC motility-based feedback remains operational albeit with a reduction in gain, especially at high frequencies. Second, because the main body of the TM in TectaY1870C/+ mice has little physical contact with the organ of Corti due to delamination of Kimura’s membrane, the TM can no longer provide its normal load to and mechanical influence on the hair bundles of OHCs (Ó Maoiléidigh et al., 2012; Salvi et al., 2015). As a result, SOAEs are observed similar to other TM mutants where internal oscillations are also detected (Cheatham et al., 2014, 2016). We thus suggest that while the principal function of the TM as a whole is to stabilize the high-gain feedback system, its subcomponent, Kimura’s membrane, by itself, is essential for OHC mechanoelectrical transduction by virtue of its intimate contact with the tips of the OHC stereocilia. In other words, shearing motion between reticular lamina and the accessory structure at the attachment point of the OHC stereocilia can be produced by Kimura’s membrane alone. One may then speculate that the evolutionary need for the main body of the TM is to reduce spontaneous oscillations in the high-gain feedback system of the mammalian cochlea.
The ABR data also support the original report on this mutant (Legan et al., 2005), which showed that close apposition between TM and reticular lamina in the IHC region is essential for the appropriate fluid flow in the subtectorial space required for stimulating IHC stereocilia, which are not attached to the underside of the TM (Dallos et al., 1972). Although OHC-mediated feedback persists in TectaY1870C/+ mice, it is reduced, which further decreases the input to IHCs, and their ability to convey information to the CNS. Hence, both compound action potentials (Legan et al., 2005) and ABRs (as reported here) are vastly reduced. The fact that the SOAEs increase when mechanical input to IHCs decreases is again further evidence that IHCs are not the source of these phenomena (Trautwein et al., 1996).
Multimodal SOAEs do not appear to be spatially separated from their primary SOAE partners in animals with a delaminated TM
The observation of multimodal SOAEs in TectaY1870C/+ mice (Figs. 5–7) was not unexpected as human subjects (Burns et al., 1984; Jones et al., 1986; Talmadge et al., 1993; Whitehead et al., 1993) also produce SOAEs identified as cubic difference tones or as integer multiples or harmonics of SOAEs at lower frequencies. Although few studies have addressed this issue, Talmadge et al. (1993) showed that the incidence was low with cubic SOAEs comprising only 3% and harmonic SOAEs only 2% of the 588 SOAEs recorded. In contrast, several emitting TectaY1870C/+ mice produce secondary SOAEs that are predominately integer multiples of lower-frequency SOAEs. In fact, 21 of 32 TectaY1870C/+ mice with SOAEs showed a harmonic pattern. Although we recorded 27 second harmonics and 6 third harmonics, there were only two examples where the third harmonic was similar in magnitude to the second harmonic. In fact, second-harmonic SOAEs were on average ∼14 dB down from their fundamental SOAE partner, while the third harmonic SOAEs were ∼23 dB down. Our data also indicate that secondary/harmonic SOAEs do not appear to originate from a region of the cochlea that coincides with their harmonic frequency. For example, some of these harmonic SOAEs occur above the high-frequency cutoff of the DPOAE iso-input function and in regions where SFOAEs are small or within the noise. This latter observation is consistent with work in human subjects where primary SOAEs are found in regions where SFOAEs are also recorded (Dewey and Dhar, 2017). Given that secondary SOAEs do not appear to be independent of their primary, the number of SOAEs per cochlea should be revised. When harmonic SOAEs (n = 33) are subtracted from the total (n = 203), the number of independent SOAEs (n = 170) per cochlea drops (i.e., to 170/32 = 5.3). This number, however, is still larger than for any other TM mutant characterized to date, as follows: OtoaEGFP/EGFP = 3.4 (Cheatham et al., 2016); Tectb−/− = 1.2 (Cheatham et al., 2018); and Ceacam16βgal/βgal = 2.4 (Cheatham et al., 2014). On average, wild-type animals generate 2.1 SOAEs per cochlea.
Studies on bullfrog sacculus have also demonstrated multimodal SOAEs at 2:1 and 3:1 ratios of SOAE frequencies (Zhang et al., 2015). Although Zhang et al. (2015) report harmonic but not cubic SOAEs, this may reflect the fact that the overlying otolithic membrane was digested, with the result that the hair bundle was free standing. In this condition, there is no bias on the stereocilia in the bullfrog sacculus preparation. However, in our in vivo experiments on mice, SOAEs are recorded from an intact preparation and any bias on the OHC stereociliary bundle induced by attachment to Kimura’s membrane should be reflected in the character of the nonlinearity. In animals with normal hearing, the operating point is positioned where the hair cell transducer function has the steepest slope, which is associated with the production of cubic distortion, especially for cochlear locations with high characteristic frequencies (Russell and Sellick, 1978). The reduction in cubic DPOAEs (2f1-f2) and the predominance of second-harmonic SOAEs in some TectaY1870C/+ mice implies that the nonlinearity becomes more even order or quadratic in nature. This observation suggests that the mechanical influence of the TM on the OHC stereocilia in TectaY1870C/+ mice is altered such that the set point changes and the nonlinearity becomes more quadratic in character, as discussed previously (Frank and Kössl, 1997; Lukashkin and Russell, 1998). In fact, the degree of separation of Kimura’s membrane from the main body of the tectorial membrane (Legan et al., 2005), and the probable elimination of any influence by a second traveling wave in the main body of the TM (Hubbard, 1993; Ghaffari et al., 2007, 2010; Sellon et al., 2014, 2017; Jones et al., 2015), could affect the set point and subsequently reduce sensitivity.
Our use of a Text to suppress SOAEs (Fig. 7) also has implications for cochlear mechanics and how it changes with alterations to the TM. When using a suppressor that was 13 dB greater in magnitude and just above the primary SOAE in frequency, both primary and second-harmonic SOAEs were decreased/eliminated. This latter result is consistent with work on human subjects where SOAEs could be reduced when the suppressor was higher in frequency and 10-20 dB SPL higher in level than the SOAE (Harris and Glattke, 1992). In contrast, we have never been able to reduce harmonic SOAEs by adding a nearby external suppressor tone even when it was as much as 28 dB larger in magnitude. The failure of nearby suppressors to decrease second-harmonic SOAEs implies that these components do not have their own traveling waves. In other words, a second-harmonic SOAE does not induce basilar membrane displacements at its best-frequency place. It should be emphasized, however, that the morphology of the TM in TectaY1870C/+ mice is altered such that Kimura’s membrane separates from the main body of the accessory structure in the region that coincides with the second-harmonic SOAE frequency but probably not with that of the primary SOAE (Fig. 4). This observation suggests that loss of the TM traveling wave and/or its interaction with the BM traveling wave may contribute to the results shown in Figure 7.
SOAE production requires some degree of amplification
The data reported here for TectaY1870C/+ mice also demonstrate that some amplification is required for SOAE production. Similar to the earlier report on OtoaEGFP/EGFP mice (Cheatham et al., 2016) and the data on human subjects (Probst et al., 1991), these additional results confirm that SOAEs do not present in the ear canal if DPOAE threshold shifts are greater than ∼25 dB. In addition, animals lacking prestin, and hence amplification, as well as other TM mutants with DPOAE threshold shifts of more than ∼25 dB, do not produce SOAEs (M. A. Cheatham, unpublished observations). The fact that some degree of amplification-based sensitivity must be retained to generate large/numerous SOAEs is consistent with the notion that SOAEs reflect the active cochlear processes associated with OHC function. Our present results, and those published previously (Legan et al., 2000, 2005, 2014; Russell et al., 2007; Lukashkin et al., 2012; Kammerer et al., 2012; Cheatham et al., 2014, 2016, 2018), also indicate that each TM mutant presents its own individual collection of anatomical and consequent physiological changes. In other words, there is no simple correlation between a particular change in TM structure and the change in propensity to generate SOAEs, particularly their magnitude and spectra. Although Hensen’s stripe is missing, or detached and fragmented, in all mutants tested to date, this structure is prominent in WT mice, but only in the basal half of the cochlea. This longitudinal variation makes it difficult to understand how loss of this structure, by itself, would foster the expression of SOAEs with frequencies as low as 5 kHz. If the loss of Hensen’s stripe were in fact the anatomical correlate of this behavior, SOAEs observed in emitting WT controls should appear at low and not at the high frequencies where they have been observed (average SOAE frequency, 22.3 kHz).
Because various alterations in TM anatomy can ultimately result in similar changes to its internal dynamics, measuring SOAEs provides insights into the interplay between the intrinsic properties of the OHC stereocilia and the mechanical influence exerted by the TM in vivo (Ó Maoiléidigh et al., 2012; Salvi et al., 2015). In thinking about these processes, it is of interest that homeostasis, a process designed to preserve internal constancy using control systems stabilized by feedback loops, is now being incorporated into computer simulations of cochlear function (Milewski et al., 2017). Based on our work in mutant mice, the TM is very much involved in the maintenance of homeostasis (functional equilibrium) and in stabilizing a feedback network, the integrity of which is required for the sensitivity, selectivity, and dynamic range of cochlear responses, the hallmarks of mammalian hearing.
Acknowledgments
We thank Aisha Ahmad for help with data collection and colony management, as well as Trent Nichol for assistance with the ANOVA statistical analysis.
Footnotes
The authors declare no competing financial interests.
This work was supported by The Knowles Hearing Center, The National Institute on Deafness and Other Communication Disorders (Grant DC-000089), and The Wellcome Trust (Grant 087377).
This is an open-access article distributed under the terms of the Creative Commons Attribution 4.0 International license, which permits unrestricted use, distribution and reproduction in any medium provided that the original work is properly attributed.
References
In this issue


