

Article Figures & Data
Figures
- Figure 1.
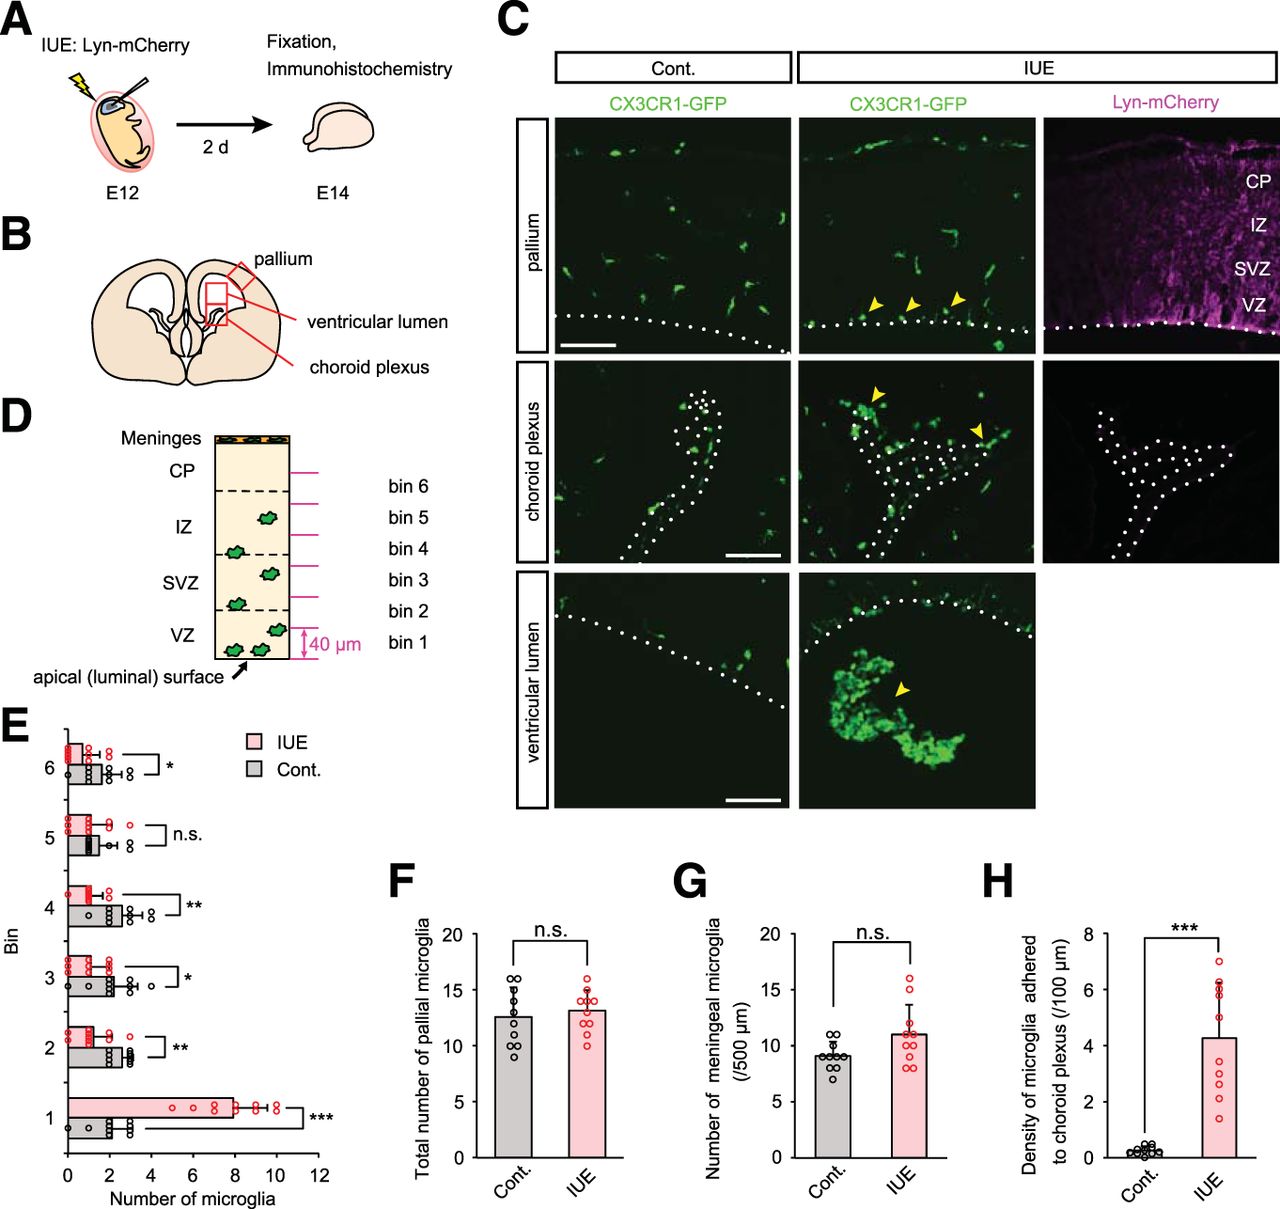
IUE disturbs microglial distribution in the developing cerebral cortex. A, Experimental design of IUE. Plasmid DNA (pEFX2-Lyn-mCherry) was injected into the right lateral ventricle of an E12 CX3CR1-GFP mouse, and then electrical pulses were applied. After 2 d (E14), the brain was fixed and subjected to immunohistochemical analysis. B, Illustration showing the approximate region of pallium, choroid plexus, and ventricular lumen for immunohistochemical analyses. C, Representative immunostaining to detect GFP (CX3CR1) and RFP (Lyn-mCherry) in pallium, choroid plexus, and ventricular lumen of control and IUE brains. Broken lines show the apical surface of the pallium in the top and bottom, and the choroid plexus in the middle. Yellow arrowheads indicate microglia accumulated near the apical surface of the pallium, on the choroid plexus and in the ventricular lumen. Scale bar, 100 µm. D, Bin definition for immunohistochemical analyses is shown. Each section in the cerebral wall was numbered from the ventricle side (bins 1–6, 40 µm each). E–G, Graphs depicting numbers of microglia in each bin (40 µm × 300 µm square; E), the total number within 240 µm from the apical surface of the pallium (F), and the number of meningeal microglia (G). H, Density of microglia adhered to the choroid plexus in control versus IUE brains. For statistical analyses, n = 10 samples obtained from five embryos (2 sections, each) were quantified. One or two littermates per dam were subjected to a series of tests. Data represent mean ± SD. ***p < 0.001, **p < 0.01, *p < 0.05, or n.s., not significant; Mann–Whitney U test.
- Figure 2.
Plasmid DNA injection into the ventricle, without electrical pulses, results in abnormal microglial distribution. A, Representative immunostaining for CX3CR1-GFP in the pallium and choroid plexus of mouse brains subjected to puncture with a glass capillary needle, injection of plasmid DNA (shown as pDNA) into the lateral ventricle, electrical pulses, or injection of Tris-EDTA solution (10 mm Tris-HCl, 1 mm EDTA, pH 8.0) alone without plasmid DNA. Yellow arrowheads indicate microglia accumulated near the apical surface of the cerebral wall or adhered to the choroid plexus. Broken lines show the apical surface of the pallium in the top and the choroid plexus in the bottom. Scale bar, 100 µm. B, C, Graphs depicting the number of microglia positioned in each 40 µm bin (B) and the total number of these cells within 240 µm from the apical surface (C) in brains that were subjected to each procedure. D, Density of microglia adhered to the choroid plexus. For statistical analyses, n = 10 samples obtained from five embryos (2 sections, each) were quantified. One or two littermates per dam were subjected to a series of tests. Data represent mean ± SD. ***p < 0.001, **p < 0.01, *p < 0.05, or n.s., not significant; Steel–Dwass test.
- Figure 3.
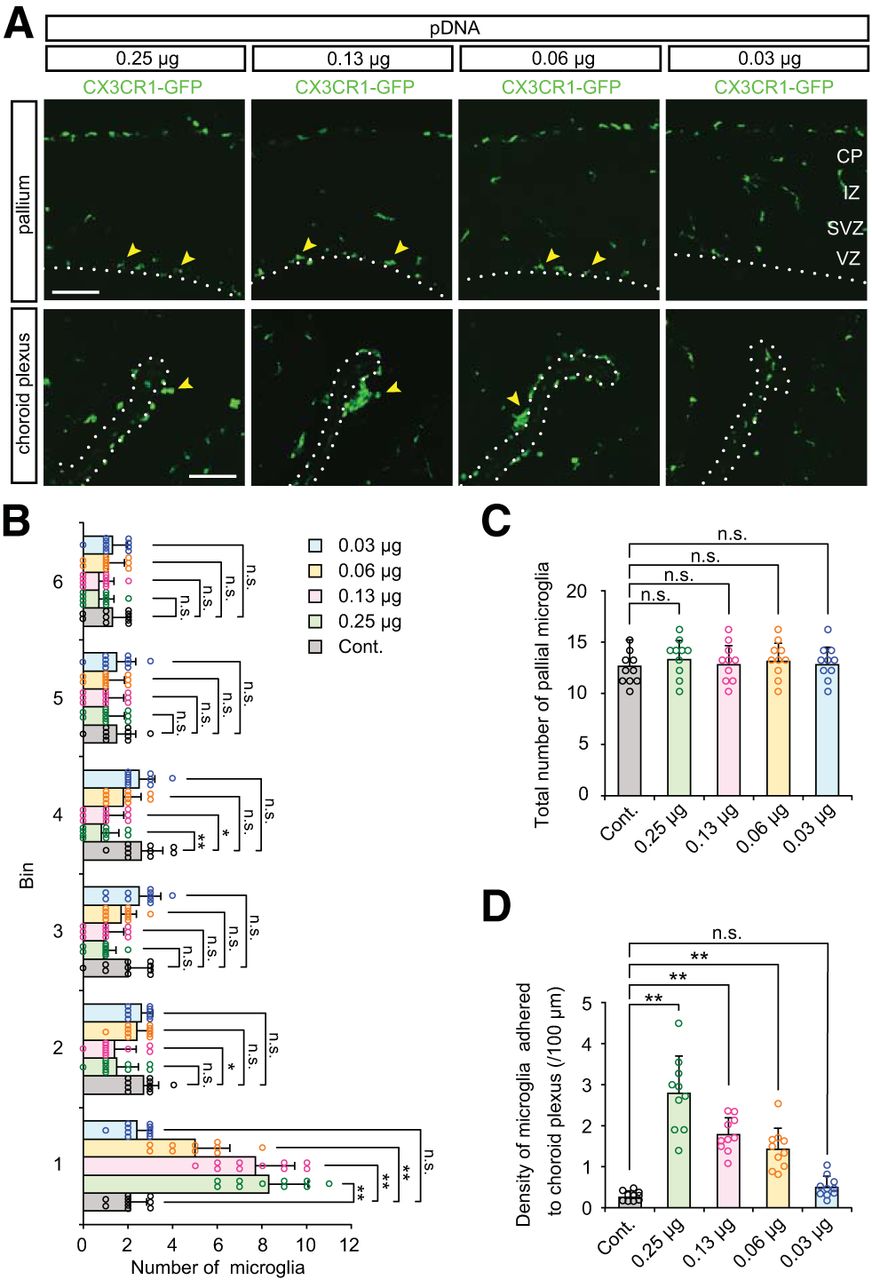
Sensitivity of microglial response to intraventricularly injected plasmid DNAs. A, CX3CR1-GFP immunostaining showing microglial accumulation in brains injected with the indicated amount of plasmid DNA (0.25, 0.13, 0.06, and 0.03 µg). Yellow arrowheads indicate microglia accumulated near the apical surface of the pallium and on the choroid plexus. Scale bar, 100 µm. B, C, Graphs depicting the number of microglia positioned in each 40 µm bin (B) and the total number of these cells within 240 µm from the apical surface (C) in brains that were injected with plasmid DNA. D, Density of microglia adhered to the choroid plexus. For statistical analyses, n = 10 samples obtained from five embryos (2 sections, each) were quantified. One or two littermates per dam were subjected to a series of tests. Data represent mean ± SD. ***p < 0.001, **p < 0.01, *p < 0.05, or n.s., not significant; Steel–Dwass test.
- Figure 4.
Microglia immediately sense plasmid DNAs injected into the ventricle. A, Representative immunostaining of CX3CR1-GFP in E14 brain fixed soon (4 h) after administration of 0.5 µg plasmid DNA. Yellow arrowheads show microglia accumulated near the apical surface of the pallium and on the choroid plexus. Scale bar, 100 µm. B, Graph showing the number of pallial microglia positioned in each 40 µm bin in control and plasmid-injected brains. C, Graph comparing density of microglia adhered to choroid plexus. D, The total number of pallial microglia within 240 µm from the apical surface. For statistical analyses, n = 10 samples obtained from five embryos (2 sections, each) were quantified. Two or three littermates per dam were subjected to a series of tests. Data represent mean ± SD. ***p < 0.001, **p < 0.01, *p < 0.05, or n.s., not significant; Mann–Whitney U test.
- Figure 5.
Intraventricular administration of TLR9 antagonist decreases microglial infiltration induced by plasmid DNA injection. A, Relative expression of TLR9 (normalized against GAPDH) in FACS-isolated CX3CR1- and CX3CR1+ cells derived from the cerebral wall of E14 CX3CR1-GFP mice. Data represent mean ± SD (n = 4 samples obtained from independent experiments; p = 0.0286, Mann–Whitney U test). B, Experimental design for ODN 2088 treatment. ODN 2088 was injected together with plasmid DNA into the lateral ventricle of E12 CX3CR1-GFP mice, and after 2 d (E14) the embryonic brains were fixed. C, Immunofluorescence with anti-GFP antibody, showing the distribution of microglia in the pallium and choroid plexus. Yellow arrowheads indicate microglia aberrantly accumulated on the apical surface of the pallium or in the choroid plexus. Cyan arrowheads show microglia which were almost homogenously distributed in the cerebral wall. Scale bar, 100 µm. D, E, Graphs indicate the number of CX3CR1-GFP+ cells in each 40 µm bin of the pallium (D) and density of microglia directly adhered to the choroid plexus (E), comparing control, only ODN 2088-treated, plasmid DNA-injected, and plasmid DNA + ODN 2088 coinjected brains. F, Graph showing the total number of pallial microglia within 240 µm from the apical surface. G, Double-immunofluorescence for GFP (CX3CR1) and RFP (Lyn-mCherry) in the cortex of IUE E14 brain treated with ODN 2088. Microglia exhibited a normal distribution pattern in the Lyn-mCherry expressing region where IUE succeeded (Movies 1). Scale bar, 100 µm. For statistical analyses in D–F, n = 16 samples obtained from eight embryos (2 sections, each) were quantified. Two or three littermates per dam were subjected to a series of tests. Data represent mean ± SD. ***p < 0.001, **p < 0.01, *p < 0.05, or n.s., not significant; Steel–Dwass test.
- Figure 6.
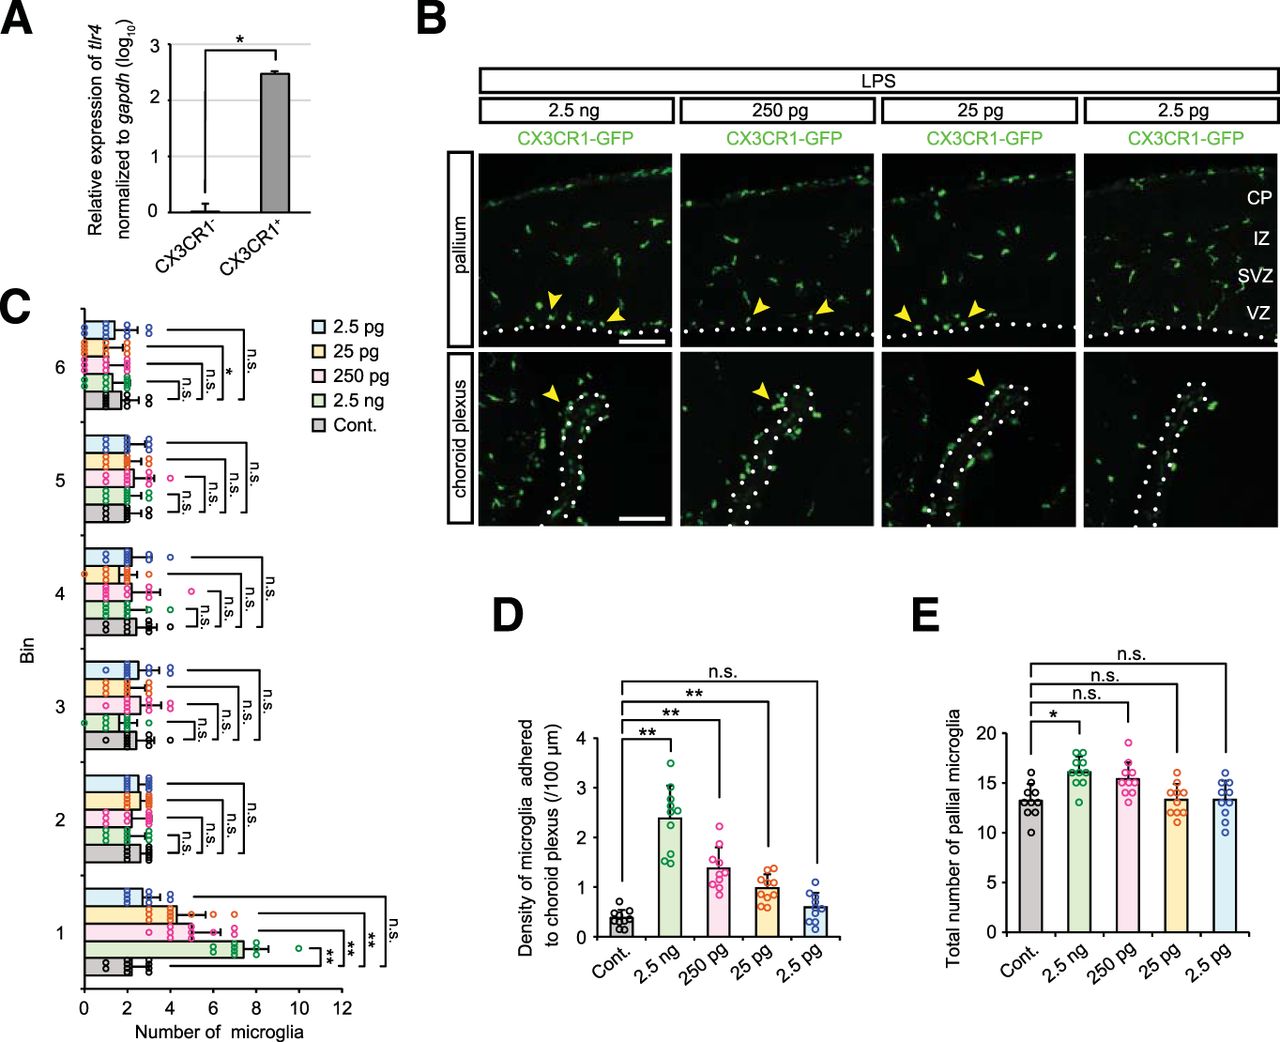
Endotoxins trigger microglial aberrant accumulation. A, Relative expression of TLR4 (normalized against GAPDH) in FACS-isolated CX3CR1− and CX3CR1+ cells derived from the cerebral wall of E14 CX3CR1-GFP mice. Data represent mean ± SD (n = 4 samples obtained from independent experiments; p = 0.0286, Mann–Whitney U test). B, Immunofluorescence with anti-GFP antibody, showing the distribution of microglia in the pallium and choroid plexus in brains injected with the indicated amount of LPS (2.5 ng, 250 pg, 25 pg, and 2.5 pg). Yellow arrowheads indicate microglia accumulated near the apical surface of the pallium and on the choroid plexus. Scale bar, 100 µm. C, D, Graphs depicting the number of pallial microglia positioned in each bin (C) and density of microglia adhered to the choroid plexus (D) in brains treated with various amounts of LPS. E, The total number of pallial microglia within 240 µm from the apical surface. For statistical analyses in C–E, n = 10 samples obtained from five embryos (2 sections, each) were quantified. One or Two littermates per dam were subjected to a series of tests. Data represent mean ± SD. ***p < 0.001, **p < 0.01, *p < 0.05, or n.s., not significant; Steel–Dwass test.
- Figure 7.
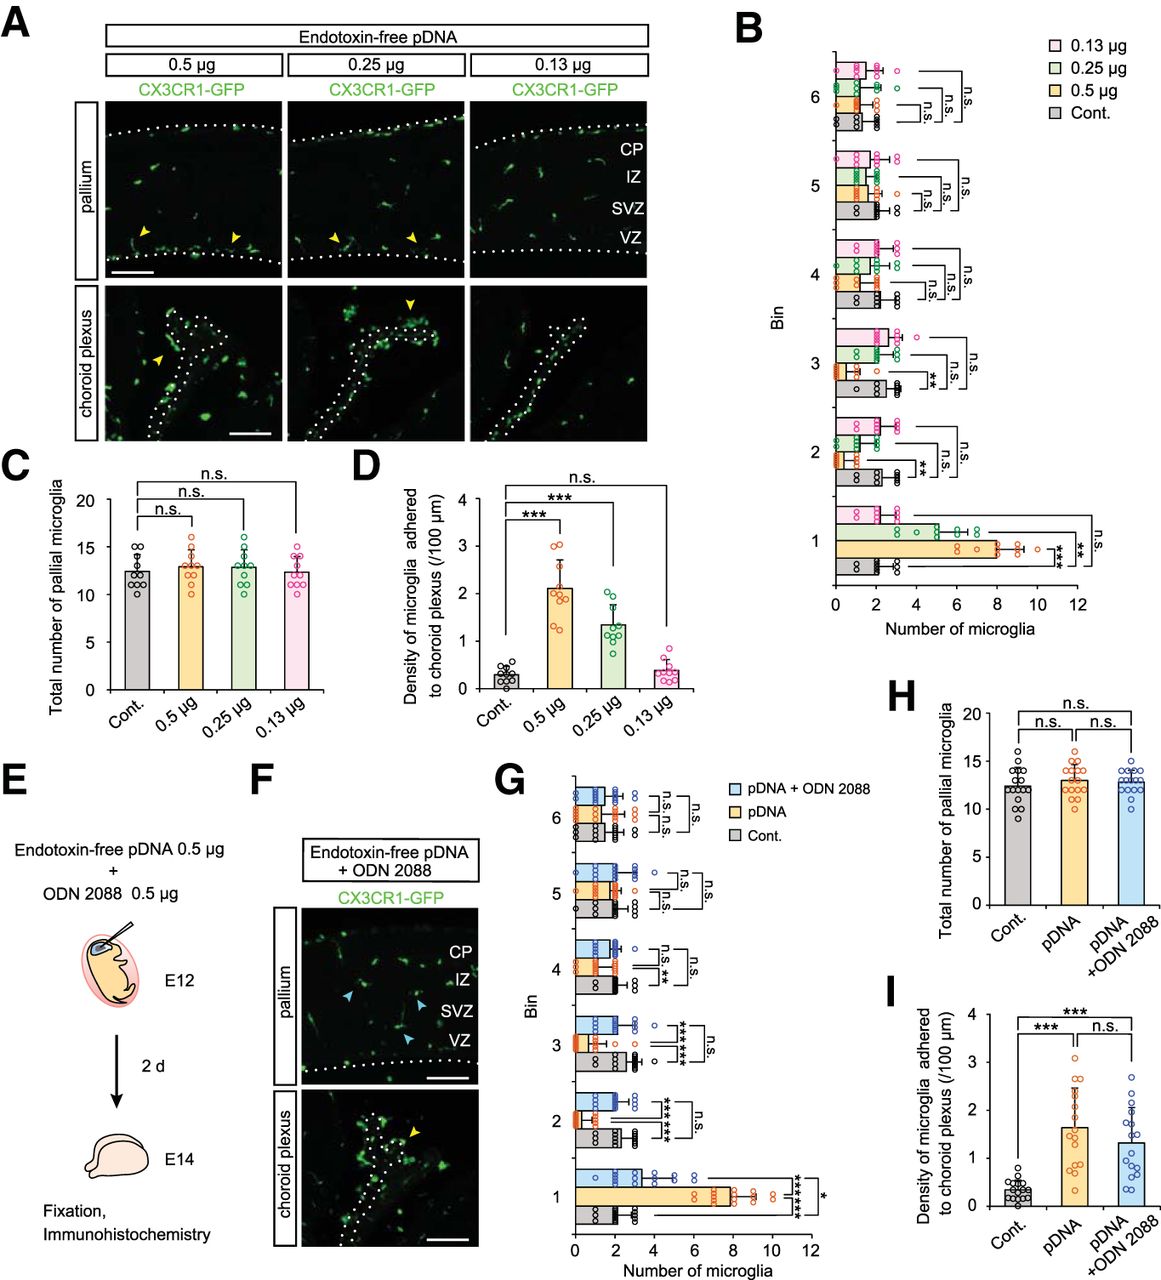
Plasmid DNA itself elicits microglial response via TLR9. A, Immunofluorescence with anti-GFP antibody, showing the distribution of microglia in the pallium and choroid plexus in brains injected with the indicated amount of endotoxin-free plasmid DNA (0.5, 0.25, and 0.13 µg). Yellow arrowheads show microglia accumulated near the apical surface and on the choroid plexus. Scale bar, 100 µm. B, C, Graphs depicting the number of pallial microglia positioned in each 40 µm bin (B) and the total number of these cells within 240 µm from the apical surface (C). D, Density of microglia adhered to the choroid plexus. For statistical analyses in B–D, n = 10 samples obtained from five embryos (2 sections, each) were quantified. Two or three littermates per dam were subjected to a series of tests. Data represent mean ± SD. ***p < 0.001, **p < 0.01, *p < 0.05, or n.s., not significant; Steel–Dwass test (Fig. 7-1). E, Experimental design for administration of ODN 2088 together with endotoxin-free plasmid DNA. F, CX3CR1-GFP immunostaining showing microglial distribution in brains injected with endotoxin-free plasmid DNA and ODN 2088 coinjected brains. Yellow arrowhead indicates microglia adhered to the choroid plexus. Cyan arrowheads show microglia which were almost homogenously distributed in the cerebral wall. Scale bar, 100 µm. G, H, Graphs depicting the number of pallial microglia positioned in each bin (G) and the total number of these cells within 240 µm from the apical surface (H). I, Density of microglia adhered to the choroid plexus. For statistical analyses in G–I, n = 16 samples obtained from eight embryos (2 sections, each) were quantified. Two or three littermates per dam were subjected to a series of tests. Data represent mean ± SD. ***p < 0.001, **p < 0.01, *p < 0.05, or n.s. not significant; Steel–Dwass test (Fig. 7-2).
- Figure 8.
Schematic summary. Schematic illustration showing the mechanism underlying the aberrant distribution of microglia in the cerebral wall of IUE-performed brain. The presence of exogenously derived plasmid DNAs induced microglia to accumulate along the apical surface of the cerebral wall and aggregate in the choroid plexus. This effect was independent of capillary needle puncture of the brain wall, or application of electrical pulses. Such microglial response is mediated by activation of TLR9, which is expressed intracellularly in microglia.


Tables
Graph Data structure Type of test p Fig. 1E Nonparametric Mann–Whitney U test Bin 1: 1.1 × 10⁻⁵
Bin 2: 0.0022
Bin 3: 0.0307
Bin 4: 0.0014
Bin 5: 0.4281
Bin 6: 0.0495Fig. 1F Nonparametric Mann–Whitney U test 0.6835 Fig. 1G Nonparametric Mann–Whitney U test 0.1021 Fig. 1H Nonparametric Mann–Whitney U test 1.1 × 10⁻⁵ Graph Data structure Type of test p Fig. 2B, bin 1 Nonparametric Steel–Dwass Cont vs Puncture only, p = 0.9990;
Cont vs pDNA injection, p = 0.0011;
Cont vs Electrical shock only, p = 0.9973;
Cont vs TE buffer injection, p = 0.9871Fig. 2B, bin 2 Nonparametric Steel–Dwass Cont vs Puncture only, p = 0.9781;
Cont vs pDNA injection, p = 0.0369;
Cont vs Electrical shock only, p = 0.9937;
Cont vs TE buffer injection, p = 0.9996Fig. 2B, bin 3 Nonparametric Steel–Dwass Cont vs Puncture only, p = 1.0000;
Cont vs pDNA injection, p = 0.0055;
Cont vs Electrical shock only, p = 0.9976;
Cont vs TE buffer injection, p = 0.9976Fig. 2B, bin 4 Nonparametric Steel–Dwass Cont vs Puncture only, p = 0.9992;
Cont vs pDNA injection, p = 0.0154;
Cont vs Electrical shock only, p = 0.9964;
Cont vs TE buffer injection, p = 0.9996Fig. 2B, bin 5 Nonparametric Steel–Dwass Cont vs Puncture only, p = 0.9473;
Cont vs pDNA injection, p = 0.1056;
Cont vs Electrical shock only, p = 0.9976;
Cont vs TE buffer injection, p = 1.0000Fig. 2B, bin 6 Nonparametric Steel–Dwass Cont vs Puncture only, p = 0.9998;
Cont vs pDNA injection, p = 0.3261;
Cont vs Electrical shock only, p = 0.9962;
Cont vs TE buffer injection, p = 1.0000Fig. 2C Nonparametric Steel–Dwass Cont vs Puncture only, p = 0.9994;
Cont vs pDNA injection, p = 1.0000;
Cont vs Electrical shock only, p = 0.9969;
Cont vs TE buffer injection, p = 0.9981Fig. 2D Nonparametric Steel–Dwass Cont vs Puncture only, p = 0.9989;
Cont vs pDNA injection, p = 0.0015;
Cont vs Electrical shock only, p = 0.9994;
Cont vs TE buffer injection, p = 0.9913Graph Data structure Type of test p Fig. 3B, bin 1 Nonparametric Steel–Dwass Cont vs 0.25 µg, p = 0.0013;
Cont vs 0.13 µg, p = 0.0013;
Cont vs 0.06 µg, p = 0.0028;
Cont vs 0.03 µg, p = 0.8787Fig. 3B, bin 2 Nonparametric Steel–Dwass Cont vs 0.25 µg, p = 0.0693;
Cont vs 0.13 µg, p = 0.0453;
Cont vs 0.06 µg, p = 0.9317;
Cont vs 0.03 µg, p = 0.9990Fig. 3B, bin 3 Nonparametric Steel–Dwass Cont vs 0.25 µg, p = 0.1044;
Cont vs 0.13 µg, p = 0.2141;
Cont vs 0.06 µg, p = 0.8898;
Cont vs 0.03 µg, p = 0.8352Fig. 3B, bin 4 Nonparametric Steel–Dwass Cont vs 0.25 µg, p = 0.0098;
Cont vs 0.13 µg, p = 0.0196;
Cont vs 0.06 µg, p = 0.3581;
Cont vs 0.03 µg, p = 0.9985Fig. 3B, bin 5 Nonparametric Steel–Dwass Cont vs 0.25 µg, p = 0.8286;
Cont vs 0.13 µg, p = 0.7255;
Cont vs 0.06 µg, p = 0.8286;
Cont vs 0.03 µg, p = 1.0000Fig. 3B, bin 6 Nonparametric Steel–Dwass Cont vs 0.25 µg, p = 0.4412;
Cont vs 0.13 µg, p = 0.4412;
Cont vs 0.06 µg, p = 0.9667;
Cont vs 0.03 µg, p = 0.9999Fig. 3C Nonparametric Steel–Dwass Cont vs 0.25 µg, p = 0.6147;
Cont vs 0.13 µg, p = 0.9493;
Cont vs 0.06 µg, p = 0.7574;
Cont vs 0.03 µg, p = 0.9162Fig. 3D Nonparametric Steel–Dwass Cont vs 0.25 µg, p = 0.0015;
Cont vs 0.13 µg, p = 0.0015;
Cont vs 0.06 µg, p = 0.0015;
Cont vs 0.03 µg, p = 0.1825Graph Data structure Type of test p Fig. 4B Nonparametric Mann–Whitney U bin 1: 1.1 × 10⁻⁵
bin 2: 0.0074
bin 3: 0.1023
bin 4: 0.0058
bin 5: 0.0837
bin 6: 0.0275Fig. 4C Nonparametric Mann–Whitney U 0.9869 Fig. 4D Nonparametric Mann–Whitney U 0.2789 Graph Data structure Type of test p Fig. 5D, bin 1 Nonparametric Steel–Dwass Cont vs ODN 2088, p = 0.8335;
Cont vs pDNA, p = 5.6 × 10⁻⁶;
pDNA vs. pDNA + ODN 2088, p = 2.4 × 10⁻⁴;
Cont vs pDNA + ODN 2088, p = 2.1 × 10⁻⁵Fig. 5D, bin 2 Nonparametric Steel–Dwass Cont vs ODN 2088, p = 0.6401;
Cont vs pDNA, p = 1.3 × 10⁻⁵;
pDNA vs. pDNA + ODN 2088, p = 0.0627;
Cont vs pDNA + ODN 2088, p = 0.0163Fig. 5D, bin 3 Nonparametric Steel–Dwass Cont vs ODN 2088, p = 0.9781;
Cont vs pDNA, p = 8.2 × 10⁻⁵;
pDNA vs. pDNA + ODN 2088, p = 4.7 × 10⁻⁴;
Cont vs pDNA + ODN 2088, p = 0.5691Fig. 5D, bin 4 Nonparametric Steel–Dwass Cont vs ODN 2088, p = 0.9746;
Cont vs pDNA, p = 0.0102;
pDNA vs. pDNA + ODN 2088, p = 0.1967;
Cont vs pDNA + ODN 2088, p = 0.3568Fig. 5D, bin 5 Nonparametric Steel–Dwass Cont vs ODN 2088, p = 0.9276;
Cont vs pDNA, p = 0.0610;
pDNA vs. pDNA + ODN 2088, p = 0.7661;
Cont vs pDNA + ODN 2088, p = 0.5053Fig. 5D, bin 6 Nonparametric Steel–Dwass Cont vs ODN 2088, p = 0.9955;
Cont vs pDNA, p = 0.9158;
pDNA vs. pDNA + ODN 2088, p = 0.7539;
Cont vs pDNA + ODN 2088, p = 0.9840Fig. 5E Nonparametric Steel–Dwass Cont vs ODN 2088, p = 0.8121;
Cont vs pDNA, p = 8.4 × 10⁻⁶;
pDNA vs. pDNA + ODN 2088, p = 0.0374;
Cont vs pDNA + ODN 2088, p = 8.4 × 10⁻⁶Fig. 5F Nonparametric Steel–Dwass Cont vs ODN 2088, p = 0.9966;
Cont vs pDNA, p = 0.9982;
pDNA vs. pDNA + ODN 2088, p = 0.6688;
Cont vs pDNA + ODN 2088, p = 0.7716Graph Data structure Type of test p Fig. 6C, bin 1 Nonparametric Steel–Dwass Cont vs 2.5 ng, p = 0.0012;
Cont vs 250 pg, p = 0.0021;
Cont vs 25 pg, p = 0.0055;
Cont vs 2.5 pg, p = 0.7868Fig. 6C, bin 2 Nonparametric Steel–Dwass Cont vs 2.5 ng, p = 0.4164;
Cont vs 250 pg, p = 0.8867;
Cont vs 25 pg, p = 1.0000;
Cont vs 2.5 pg, p = 0.9924Fig. 6C, bin 3 Nonparametric Steel–Dwass Cont vs 2.5 ng, p = 0.3094;
Cont vs 250 pg, p = 0.9889;
Cont vs 25 pg, p = 0.8691;
Cont vs 2.5 pg, p = 0.9998Fig. 6C, bin 4 Nonparametric Steel–Dwass Cont vs 2.5 ng, p = 0.7372;
Cont vs 250 pg, p = 0.9700;
Cont vs 25 pg, p = 0.3816;
Cont vs 2.5 pg, p = 0.9811Fig. 6C, bin 5 Nonparametric Steel–Dwass Cont vs 2.5 ng, p = 1.0000;
Cont vs 250 pg, p = 0.8700;
Cont vs 25 pg, p = 1.0000;
Cont vs 2.5 pg, p = 0.9986Fig. 6C, bin 6 Nonparametric Steel–Dwass Cont vs 2.5 ng, p = 0.9278;
Cont vs 250 pg, p = 0.6779;
Cont vs 25 pg, p = 0.3559;
Cont vs 2.5 pg, p = 0.9514Fig. 6D Nonparametric Steel–Dwass Cont vs 2.5 ng, p = 0.0015;
Cont vs 250 pg, p = 0.0015;
Cont vs 25 pg, p = 0.0026;
Cont vs 2.5 pg, p = 0.5054Fig. 6E Nonparametric Steel–Dwass Cont vs 2.5 ng, p = 0.0190;
Cont vs 250 pg, p = 0.0845;
Cont vs 25 pg, p = 1.0000;
Cont vs 2.5 pg, p = 0.9994Graph Data structure Type of test p Fig. 7B, bin 1 Nonparametric Steel–Dwass Cont vs 0.5 µg, p = 7.4 × 10⁻⁴;
Cont vs 0.25 µg, p = 0.0017;
Cont vs 0.13 µg, p = 0.9880;Fig. 7B, bin 2 Nonparametric Steel–Dwass Cont vs 0.5 µg, p = 0.0018;
Cont vs 0.25 µg, p = 0.0557;
Cont vs 0.13 µg, p = 0.9880;Fig. 7B, bin 3 Nonparametric Steel–Dwass Cont vs 0.5 µg, p = 0.0018;
Cont vs 0.25 µg, p = 0.5785;
Cont vs 0.13 µg, p = 1.0000;Fig. 7B, bin 4 Nonparametric Steel–Dwass Cont vs 0.5 µg, p = 0.1122;
Cont vs 0.25 µg, p = 0.6280;
Cont vs 0.13 µg, p = 0.9880;Fig. 7B, bin 5 Nonparametric Steel–Dwass Cont vs 0.5 µg, p = 0.5457;
Cont vs 0.25 µg, p = 0.3241;
Cont vs 0.13 µg, p = 0.8824;Fig. 7B, bin 6 Nonparametric Steel–Dwass Cont vs 0.5 µg, p = 0.9691;
Cont vs 0.25 µg, p = 0.9887;
Cont vs 0.13 µg, p = 0.9773;Fig. 7C Nonparametric Steel–Dwass Cont vs 0.5 µg, p = 0.9011;
Cont vs 0.25 µg, p = 0.9593;
Cont vs 0.13 µg, p = 0.9994;Fig. 7D Nonparametric Steel–Dwass Cont vs 0.5 µg, p = 9.0 × 10⁻⁴;
Cont vs 0.25 µg, p = 9.0 × 10⁻⁴;
Cont vs 0.13 µg, p = 0.7593Fig. 7G, bin 1 Nonparametric Steel–Dwass Cont vs pDNA, p = 3.0 × 10⁻⁶;
pDNA vs. pDNA + ODN 2088, p = 5.2 × 10⁻⁶;
Cont vs pDNA + ODN 2088, p = 0.0429Fig. 7G, bin 2 Nonparametric Steel–Dwass Cont vs pDNA, p = 7.0 × 10⁻⁶;
pDNA vs. pDNA + ODN 2088, p = 1.1 × 10⁻⁵;
Cont vs pDNA + ODN 2088, p = 0.4461Fig. 7G, bin 3 Nonparametric Steel–Dwass Cont vs pDNA, p = 6.9 × 10⁻⁵;
pDNA vs. pDNA + ODN 2088, p = 4.3 × 10⁻⁴;
Cont vs pDNA + ODN 2088, p = 0.2716Fig. 7G, bin 4 Nonparametric Steel–Dwass Cont vs pDNA, p = 0.0047;
pDNA vs. pDNA + ODN 2088, p = 0.0900;
Cont vs pDNA + ODN 2088, p = 0.2895Fig. 7G, bin 5 Nonparametric Steel–Dwass Cont vs pDNA, p = 0.5717;
pDNA vs. pDNA + ODN 2088, p = 0.3952;
Cont vs pDNA + ODN 2088, p = 0.8520Fig. 7G, bin 6 Nonparametric Steel–Dwass Cont vs pDNA, p = 0.9469;
pDNA vs. pDNA + ODN 2088, p = 0.9472;
Cont vs pDNA + ODN 2088, p = 0.9965Fig. 7H Nonparametric Steel–Dwass Cont vs pDNA, p = 0.6872;
pDNA vs. pDNA + ODN 2088, p = 0.9550;
Cont vs pDNA + ODN 2088, p = 0.7672Fig. 7I Nonparametric Steel–Dwass Cont vs pDNA, p = 2.6 × 10⁻⁵;
pDNA vs. pDNA + ODN 2088, p = 0.5896;
Cont vs pDNA + ODN 2088, p = 9.2 × 10⁻⁵
Movies
- Movie 1.
Live-imaging of microglia in plasmid DNA-treated brains. Live imaging of microglia in a cortical slice derived from a CX3CR1-GFP mouse brain transfected with Lyn-mCherry. Time-lapse imaging covers a period of 10 h (1 image/10 min). Green, CX3CR1-GFP; magenta, Lyn-mCherry. Scale bar, 100 µm.
- Movie 2.
Live-imaging of microglia in plasmid DNA and ODN 2088 coinjected brains. Live imaging of microglia in a cortical slice derived from a CX3CR1-GFP mouse brain transfected Lyn-mCherry with coadministration of ODN 2088. Time-lapse imaging covers a period of 10 h (1 image/10 min). Green, CX3CR1-GFP; magenta, Lyn-mCherry. Scale bar, 100 µm.
Figure 7-1.
Graph depicting the number of pallial microglia positioned in each 40 µm bin comparing six groups: Fig. 5D Cont., Fig. 5D plasmid DNA, Fig. 5D plasmid DNA + ODN 2088, Fig. 7G Cont., Fig. 7G endotoxin-free plasmid DNA, and Fig. 7G endotoxin-free plasmid DNA + ODN 2088. Data represent mean ± SD (Steel–Dwass test). Download Figure 7-1, EPS file.
Figure 7-2.
Graph showing density of microglia adhered to the choroid plexus comparing six groups, Fig. 5E Cont., Fig. 5E plasmid DNA, Fig. 5E plasmid DNA + ODN 2088, Fig. 7I Cont., Fig. 7I endotoxin-free plasmid DNA, and Fig. 7I endotoxin-free plasmid DNA + ODN 2088. Data represent mean ± SD (Steel–Dwass test). Download Figure 7-2, EPS file.
In this issue


