
Main menu

  • HOME
  • CONTENT
    • Early Release
    • Featured
    • Current Issue
    • Issue Archive
    • Blog
    • Collections
    • Podcast
  • TOPICS
    • Cognition and Behavior
    • Development
    • Disorders of the Nervous System
    • History, Teaching and Public Awareness
    • Integrative Systems
    • Neuronal Excitability
    • Novel Tools and Methods
    • Sensory and Motor Systems
  • ALERTS
  • FOR AUTHORS
  • ABOUT
    • Overview
    • Editorial Board
    • For the Media
    • Privacy Policy
    • Contact Us
    • Feedback
  • SUBMIT

User menu

Search

  • Advanced search
eNeuro
eNeuro

Advanced Search


  • HOME
  • CONTENT
    • Early Release
    • Featured
    • Current Issue
    • Issue Archive
    • Blog
    • Collections
    • Podcast
  • TOPICS
    • Cognition and Behavior
    • Development
    • Disorders of the Nervous System
    • History, Teaching and Public Awareness
    • Integrative Systems
    • Neuronal Excitability
    • Novel Tools and Methods
    • Sensory and Motor Systems
  • ALERTS
  • FOR AUTHORS
  • ABOUT
    • Overview
    • Editorial Board
    • For the Media
    • Privacy Policy
    • Contact Us
    • Feedback
  • SUBMIT
PreviousNext
Research ArticleNew Research, Disorders of the Nervous System

In Vivo Volume Dynamics of Dendritic Spines in the Neocortex of Wild-Type and Fmr1 KO Mice

Kazuhiko Ishii, Akira Nagaoka, Yutaro Kishida, Hitoshi Okazaki, Sho Yagishita, Hasan Ucar, Noriko Takahashi, Nobuhito Saito and Haruo Kasai
eNeuro 19 October 2018, 5 (5) ENEURO.0282-18.2018; https://doi.org/10.1523/ENEURO.0282-18.2018
Kazuhiko Ishii
1Laboratory of Structural Physiology, Center for Disease Biology and Integrative Medicine, Graduate School of Medicine, The University of Tokyo, Bunkyo-ku, Tokyo 113-0033, Japan
2Department of Neurosurgery, Graduate School of Medicine, The University of Tokyo, Bunkyo-ku Tokyo 113-0033, Japan
  • Find this author on Google Scholar
  • Find this author on PubMed
  • Search for this author on this site
  • ORCID record for Kazuhiko Ishii
Akira Nagaoka
1Laboratory of Structural Physiology, Center for Disease Biology and Integrative Medicine, Graduate School of Medicine, The University of Tokyo, Bunkyo-ku, Tokyo 113-0033, Japan
  • Find this author on Google Scholar
  • Find this author on PubMed
  • Search for this author on this site
Yutaro Kishida
1Laboratory of Structural Physiology, Center for Disease Biology and Integrative Medicine, Graduate School of Medicine, The University of Tokyo, Bunkyo-ku, Tokyo 113-0033, Japan
3International Research Center for Neurointelligence, The University of Tokyo Institutes for Advanced Study, The University of Tokyo, Bunkyo-ku, Tokyo 113-0033, Japan
  • Find this author on Google Scholar
  • Find this author on PubMed
  • Search for this author on this site
Hitoshi Okazaki
1Laboratory of Structural Physiology, Center for Disease Biology and Integrative Medicine, Graduate School of Medicine, The University of Tokyo, Bunkyo-ku, Tokyo 113-0033, Japan
3International Research Center for Neurointelligence, The University of Tokyo Institutes for Advanced Study, The University of Tokyo, Bunkyo-ku, Tokyo 113-0033, Japan
  • Find this author on Google Scholar
  • Find this author on PubMed
  • Search for this author on this site
Sho Yagishita
1Laboratory of Structural Physiology, Center for Disease Biology and Integrative Medicine, Graduate School of Medicine, The University of Tokyo, Bunkyo-ku, Tokyo 113-0033, Japan
3International Research Center for Neurointelligence, The University of Tokyo Institutes for Advanced Study, The University of Tokyo, Bunkyo-ku, Tokyo 113-0033, Japan
  • Find this author on Google Scholar
  • Find this author on PubMed
  • Search for this author on this site
Hasan Ucar
1Laboratory of Structural Physiology, Center for Disease Biology and Integrative Medicine, Graduate School of Medicine, The University of Tokyo, Bunkyo-ku, Tokyo 113-0033, Japan
3International Research Center for Neurointelligence, The University of Tokyo Institutes for Advanced Study, The University of Tokyo, Bunkyo-ku, Tokyo 113-0033, Japan
  • Find this author on Google Scholar
  • Find this author on PubMed
  • Search for this author on this site
  • ORCID record for Hasan Ucar
Noriko Takahashi
4Department of Physiology, Kitasato University School of Medicine, Sagamihara 252-0374, Japan
  • Find this author on Google Scholar
  • Find this author on PubMed
  • Search for this author on this site
Nobuhito Saito
2Department of Neurosurgery, Graduate School of Medicine, The University of Tokyo, Bunkyo-ku Tokyo 113-0033, Japan
  • Find this author on Google Scholar
  • Find this author on PubMed
  • Search for this author on this site
Haruo Kasai
1Laboratory of Structural Physiology, Center for Disease Biology and Integrative Medicine, Graduate School of Medicine, The University of Tokyo, Bunkyo-ku, Tokyo 113-0033, Japan
3International Research Center for Neurointelligence, The University of Tokyo Institutes for Advanced Study, The University of Tokyo, Bunkyo-ku, Tokyo 113-0033, Japan
  • Find this author on Google Scholar
  • Find this author on PubMed
  • Search for this author on this site
  • ORCID record for Haruo Kasai
  • Article
  • Figures & Data
  • Info & Metrics
  • eLetters
  • PDF
Loading

Article Figures & Data

Figures

  • Tables
  • Extended Data
  • Figure1
    • Download figure
    • Open in new tab
    • Download powerpoint
  • Figure 1.
    • Download figure
    • Open in new tab
    • Download powerpoint
    Figure 1.

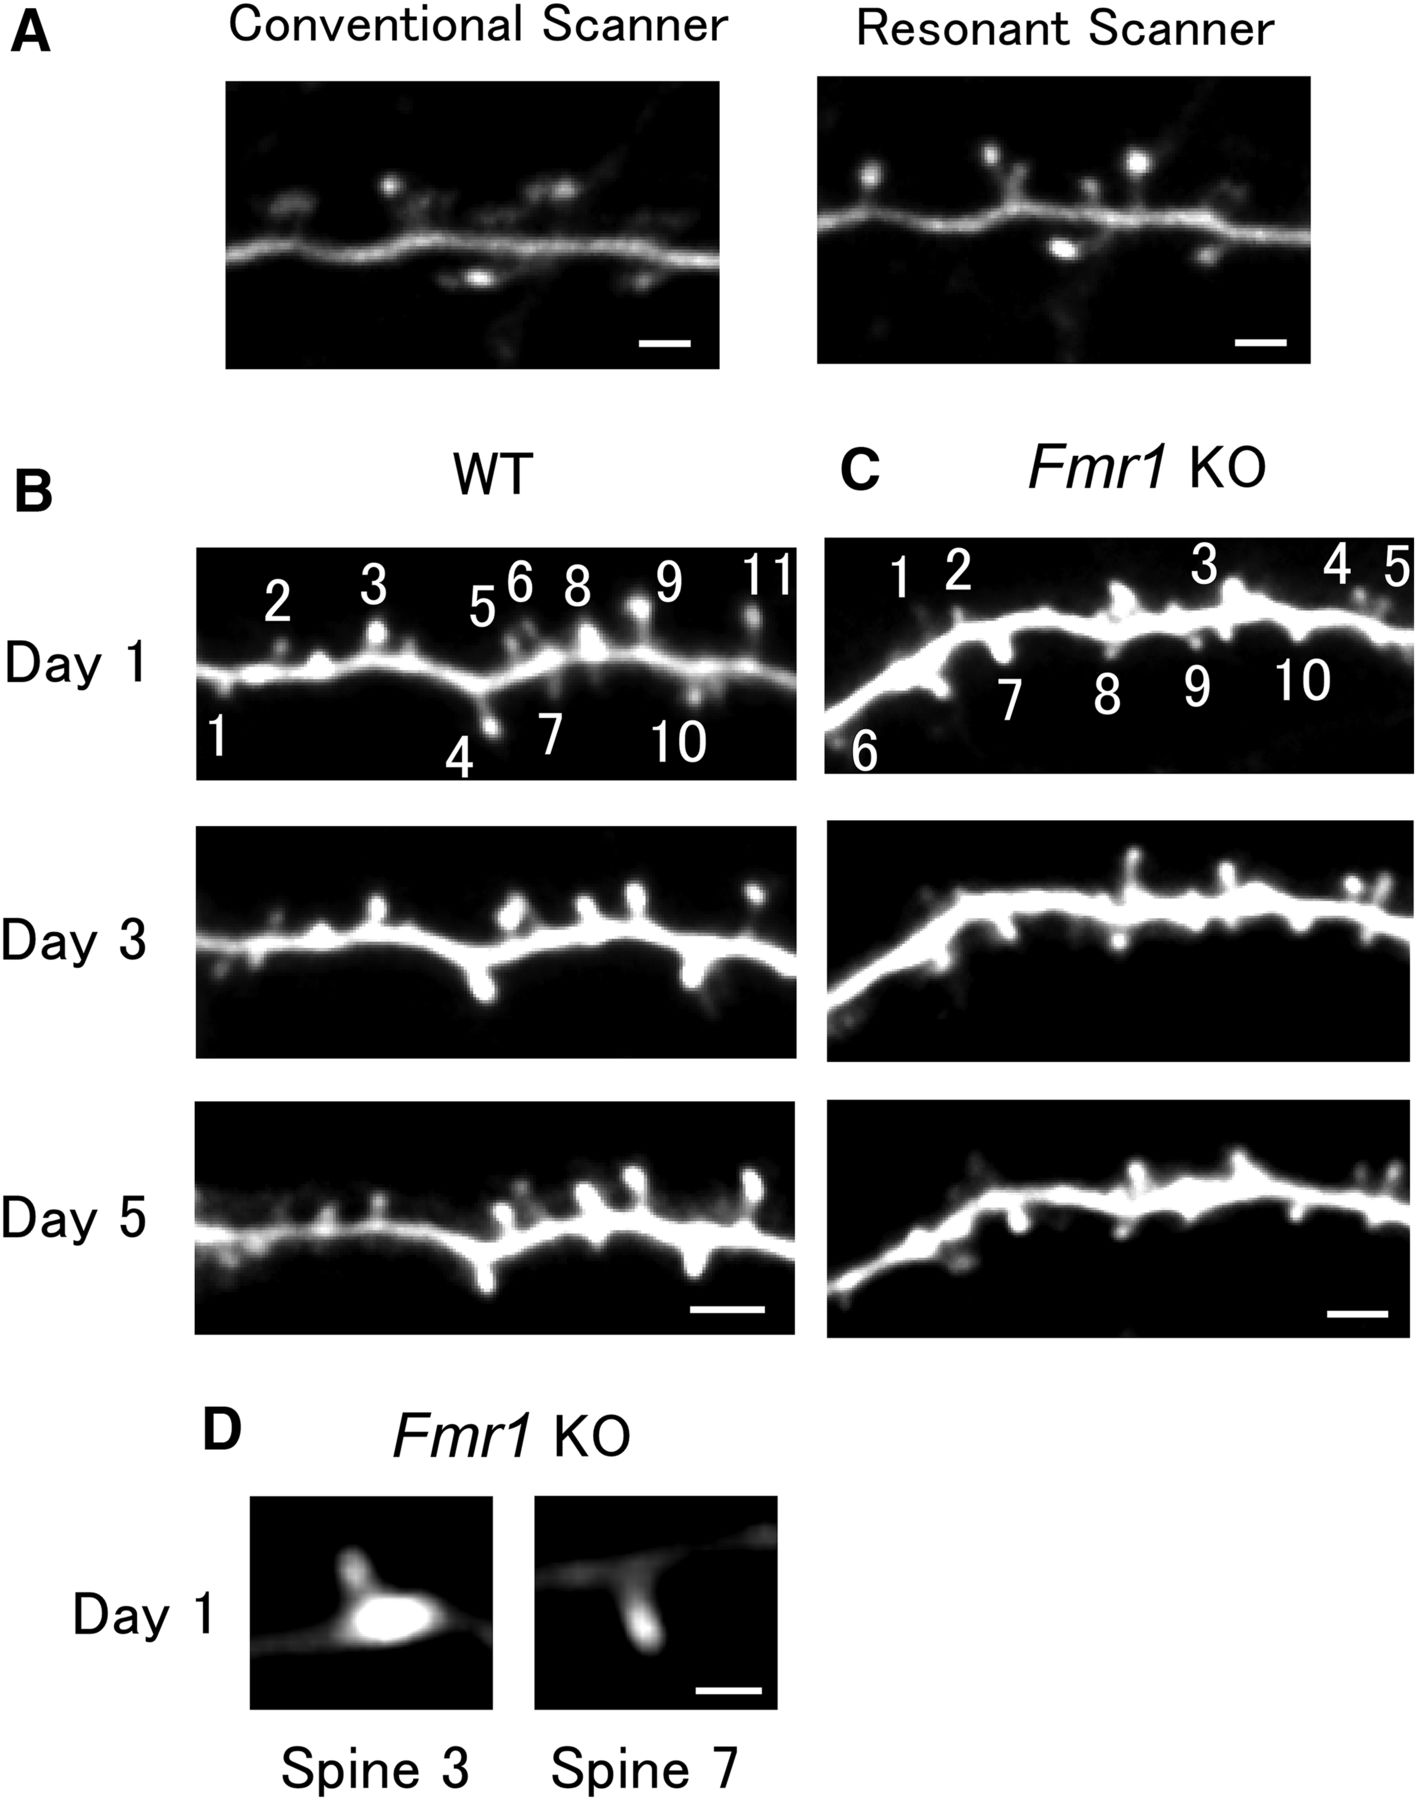
    Apical dendritic spines of M-line mice in the mouse visual cortex imaged at an interval of 2 d. A, Sample images of a mouse with considerable pulsation artifacts obtained with conventional and resonant Galvano scanners. The resonant scanner was relatively robust in response to motion artifacts. Scale bar, 2 μm. B, C, Examples of a time-lapse series of dendrite images from WT (B) and KO (C) mice. Spine numbers correspond to the respective traces in the volume–time courses in Figure 2, A and B. Scale bar, 3 μm. D, Spines 3 and 7 in C are displayed at a different brightness level from that used in C. Scale bar, 1 μm.

  • Figure 2.
    • Download figure
    • Open in new tab
    • Download powerpoint
    Figure 2.

    Changes in spine volumes in the mouse visual cortex per 2 d. A, B, Time course of spine volume changes for the spines shown in Figure 1, B and C. Trace numbers correspond to the spines numbered in Figure 1, B and C. C, D, Spine-head volume changes (ΔV) per 2 d in WT (C) and Fmr1 KO (D) mice. Data were obtained from 754 spines from 15 dendrites in five WT mice and from 878 spines from 20 dendrites in five KO mice.

  • Figure 3.
    • Download figure
    • Open in new tab
    • Download powerpoint
    Figure 3.

    Slow dynamics of spine-head volume measured per 2 d. A, B, The dynamics of spine-head volumes in WT (A) and KO (B) mice plotted against V. Each plotted point represents the SD of spine-head volume changes in 32 pooled spines of similar volume. Error bars represent 95% confidence intervals of the estimated SD. The red lines represent the least squares fits. The red line for WT mice (A) is represented by 0.21V 2/3 + 0.041, and for KO mice (B) it is represented by 0.32V 2/3 + 0.041. Note that the values of σ were below the red lines for small spines. C, D, Double logarithmic plots of the dynamics of spine-head volumes shown in A and B. Each plotted point represents the SD of spine-head volume changes in 32 pooled spines of similar volume. Error bars represent 95% confidence intervals of the estimated SD. The black lines with a slope of two-thirds fit well with the data. The red lines are reference lines with a slope of 1. E, F, Slow spine-head volume changes in WT (E) and Fmr1 KO (F) mice plotted against V 2/3 (note that the numbers and scales on the x-axis represent V). Each plotted point represents the SD of spine-head volume changes in 32 pooled spines of similar volume. The solid line is a fit to the data, and can be decomposed into a slow component (dashed lines; Eq. 6, confidence interval of the slope 0.18–0.22) and a fast component, obtained using measurements at 10 min intervals (dotted lines; Eq. 4) for E, and Equation 7 (95% confidence interval of the slope 0.24–0.32) for F. The slope of the fitted line for KO mice is significantly larger than that for WT mice (generalized linear model, t statistic = −3.67, p = 0.0006a). G, H, The drift of the spine-head volume changes in WT (G) and Fmr1 KO (H) mice plotted against the initial V value. The abscissa is linear in V 2/3, while the numbers and scales represent V as in E and F. Each plotted point represents the mean of spine-head volume changes in 32 pooled spines of similar volume. Error bars represent the SEM. The lines are the same for the pooled data in WT and KO mice (Eq. 8).

  • Figure 4.
    • Download figure
    • Open in new tab
    • Download powerpoint
    Figure 4.

    Fast volume changes in apical dendritic spines in the mouse visual cortex. A, B, Spine-head volume changes in WT (A) and KO (B) mice measured at an interval of 10 min. C, Spine-head volume changes in a fixed sample imaged at an interval of 2 d. D, E, Head volume changes (ΔV) per 10 min in WT (D) and Fmr1 KO (E) mice. Data were obtained from 475 spines from two dendrites in two WT mice, and from 1433 spines from four dendrites in three KO mice.

  • Figure 5.
    • Download figure
    • Open in new tab
    • Download powerpoint
    Figure 5.

    Fast dynamics of spine-head volume. A, B, The fast component of the dynamics of spine-head volume in WT (A) and KO (B) mice plotted against V 2/3. Each plotted point represents the SD of spine-head volume changes in 30 pooled spines of similar volume. Error bars represent 95% confidence intervals of the estimated SD. The line represents the least squares fit of the pooled data for WT and KO (Eq. 4). C, D, Fast component of the drift of spine-head volume in WT (C) and KO (D) mice plotted against V 2/3. Each point represents the mean of spine volume changes in 30 spines of similar volume. Error bars represent SEM values. Because the drifts were very small, they were fitted by zero (line).

  • Figure 6.
    • Download figure
    • Open in new tab
    • Download powerpoint
    Figure 6.

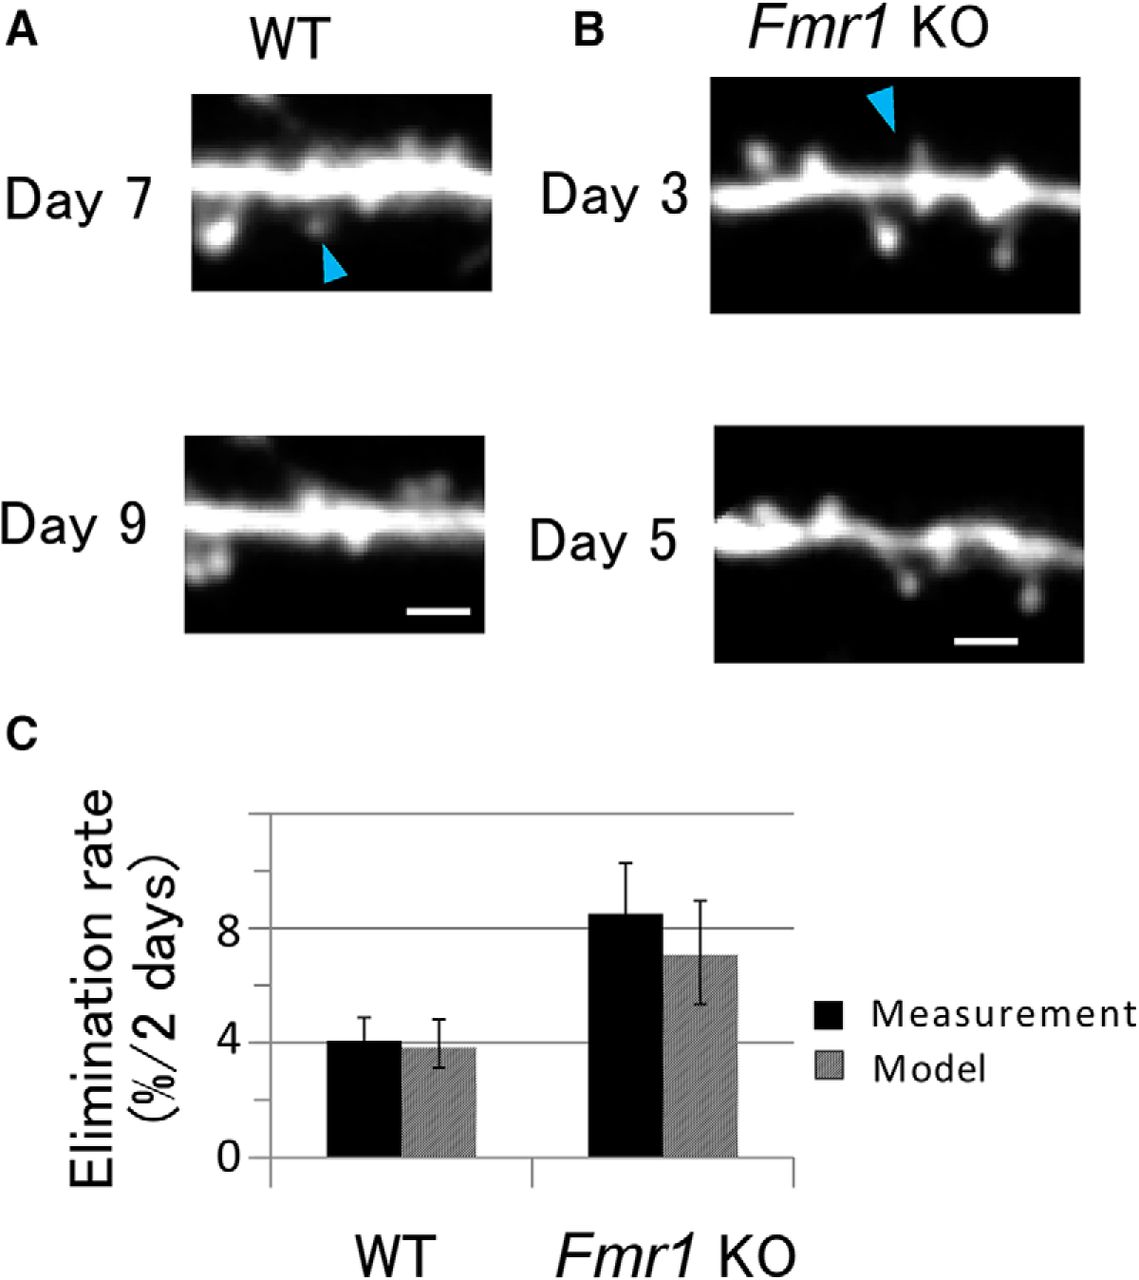
    Elimination of dendritic spines per 2 d. A, B, Example of a time-lapse series of images of a dendrite in WT (A) and KO (B) mice at an interval of 2 d. Arrowheads indicate eliminated spines. Scale bar, 2 μm. C, The elimination rates of dendritic spines per 2 d. Solid bars represent measurement data. Error bars represent SEM values from 6 and 12 dendrites for WT and Fmr1 KO mice, respectively. KO mice seemed to have a higher elimination rate, although the difference was not significant (Mann–Whitney U test, U = 17, p = 0.08b). Hatched bars represent elimination rates calculated from the model shown with the dashed lines (Fig. 3E,F; Eqs. 6–8). Error bars represent 95% confidence intervals.

  • Figure 7.
    • Download figure
    • Open in new tab
    • Download powerpoint
    Figure 7.

    The volume distributions of spine-head volumes. A, B, The spine-head volume of WT (A) and KO (B) mice. The histogram represents data for 1368 spines (A) and 1913 spines (B). The lines represent a model fit by Equations 6, 7, and 11 based on dynamic data obtained (shown in Fig. 3E,F). C, D, Overlays of cumulative probability density distributions for WT and KO data (C) and models (D). The volume distribution of KO mice data is significantly different from that of WT mice. ** p = 0.003c with the Kolmogorov-Smirnov test (χ2 = 13.1, df = 2).

Tables

  • Figures
  • Extended Data
    • View popup
    Table 1:

    Statistics

    Data structureType of testPower
    aNot normalGeneralized linear modelNot applicable
    bNot normalMann–Whitney U testNot applicable
    cNot normalKolmogorov–Smirnov testNot applicable

Extended Data

  • Figures
  • Tables
  • Extended Data 1

    Code used for simulation of large-scale brain dynamics and scripts for subsequent postprocessing analyses. Download Extended Data 1, ZIP file.

Back to top

In this issue

eneuro: 5 (5)
eNeuro
Vol. 5, Issue 5
September/October 2018
  • Table of Contents
  • Index by author
Email

Thank you for sharing this eNeuro article.

NOTE: We request your email address only to inform the recipient that it was you who recommended this article, and that it is not junk mail. We do not retain these email addresses.

Enter multiple addresses on separate lines or separate them with commas.
In Vivo Volume Dynamics of Dendritic Spines in the Neocortex of Wild-Type and Fmr1 KO Mice
(Your Name) has forwarded a page to you from eNeuro
(Your Name) thought you would be interested in this article in eNeuro.
CAPTCHA
This question is for testing whether or not you are a human visitor and to prevent automated spam submissions.
Print
View Full Page PDF
Citation Tools
In Vivo Volume Dynamics of Dendritic Spines in the Neocortex of Wild-Type and Fmr1 KO Mice
Kazuhiko Ishii, Akira Nagaoka, Yutaro Kishida, Hitoshi Okazaki, Sho Yagishita, Hasan Ucar, Noriko Takahashi, Nobuhito Saito, Haruo Kasai
eNeuro 19 October 2018, 5 (5) ENEURO.0282-18.2018; DOI: 10.1523/ENEURO.0282-18.2018

Citation Manager Formats

  • BibTeX
  • Bookends
  • EasyBib
  • EndNote (tagged)
  • EndNote 8 (xml)
  • Medlars
  • Mendeley
  • Papers
  • RefWorks Tagged
  • Ref Manager
  • RIS
  • Zotero
Respond to this article
Share
In Vivo Volume Dynamics of Dendritic Spines in the Neocortex of Wild-Type and Fmr1 KO Mice
Kazuhiko Ishii, Akira Nagaoka, Yutaro Kishida, Hitoshi Okazaki, Sho Yagishita, Hasan Ucar, Noriko Takahashi, Nobuhito Saito, Haruo Kasai
eNeuro 19 October 2018, 5 (5) ENEURO.0282-18.2018; DOI: 10.1523/ENEURO.0282-18.2018
Twitter logo Facebook logo Mendeley logo
  • Tweet Widget
  • Facebook Like
  • Google Plus One

Jump to section

  • Article
    • Visual Abstract
    • Abstract
    • Significance Statement
    • Introduction
    • Materials and Methods
    • Results
    • Discussion
    • Acknowledgments
    • Footnotes
    • References
    • Synthesis
    • Author Response
  • Figures & Data
  • Info & Metrics
  • eLetters
  • PDF

Keywords

  • ASD
  • autism
  • dendritic spine
  • fragile X mental retardation
  • synaptic plasticity
  • two-photon microscopy

Responses to this article

Respond to this article

Jump to comment:

No eLetters have been published for this article.

Related Articles

Cited By...

More in this TOC Section

New Research

  • A Very Fast Time Scale of Human Motor Adaptation: Within Movement Adjustments of Internal Representations during Reaching
  • Hsc70 Ameliorates the Vesicle Recycling Defects Caused by Excess α-Synuclein at Synapses
  • TrkB Signaling Influences Gene Expression in Cortistatin-Expressing Interneurons
Show more New Research

Disorders of the Nervous System

  • Investigating the Role of Cortical Microglia in a Mouse Model of Viral Infection-Induced Seizures
  • Functional-Structural Coupling: Brain Reorganization in Presbycusis Is Related to Cognitive Impairment
  • GABAB Receptor signaling in CA1 Pyramidal Cells is not Regulated by Aging in the APP/PS1 Mouse Model of Amyloid Pathology
Show more Disorders of the Nervous System

Subjects

  • Disorders of the Nervous System
  • Home
  • Alerts
  • Follow SFN on BlueSky
  • Visit Society for Neuroscience on Facebook
  • Follow Society for Neuroscience on Twitter
  • Follow Society for Neuroscience on LinkedIn
  • Visit Society for Neuroscience on Youtube
  • Follow our RSS feeds

Content

  • Early Release
  • Current Issue
  • Latest Articles
  • Issue Archive
  • Blog
  • Browse by Topic

Information

  • For Authors
  • For the Media

About

  • About the Journal
  • Editorial Board
  • Privacy Notice
  • Contact
  • Feedback
(eNeuro logo)
(SfN logo)

Copyright © 2026 by the Society for Neuroscience.
eNeuro eISSN: 2373-2822

The ideas and opinions expressed in eNeuro do not necessarily reflect those of SfN or the eNeuro Editorial Board. Publication of an advertisement or other product mention in eNeuro should not be construed as an endorsement of the manufacturer’s claims. SfN does not assume any responsibility for any injury and/or damage to persons or property arising from or related to any use of any material contained in eNeuro.