

Abstract
The quick and reliable detection and identification of a tastant in the mouth regulate nutrient uptake and toxin expulsion. Consistent with the pivotal role of the gustatory system, taste category information (e.g., sweet, salty) is represented during the earliest phase of the taste-evoked cortical response (Crouzet et al., 2015), and different tastes are perceived and responded to within only a few hundred milliseconds, in rodents (Perez et al., 2013) and humans (Bujas, 1935). Currently, it is unknown whether taste detection and discrimination are sequential or parallel processes, i.e., whether you know what it is as soon as you taste it. To investigate the sequence of processing steps involved in taste perceptual decisions, participants tasted sour, salty, bitter, and sweet solutions and performed a taste-detection and a taste-discrimination task. We measured response times (RTs) and 64-channel scalp electrophysiological recordings and tested the link between the timing of behavioral decisions and the timing of neural taste representations determined with multivariate pattern analyses. Irrespective of taste and task, neural decoding onset and behavioral RTs were strongly related, demonstrating that differences between taste judgments are reflected early during chemosensory encoding. Neural and behavioral detection times were faster for the iso-hedonic salty and sour tastes than their discrimination time. No such latency difference was observed for sweet and bitter, which differ hedonically. Together, these results indicate that the human gustatory system detects a taste faster than it discriminates between tastes, yet hedonic computations may run in parallel (Perez et al., 2013) and facilitate taste identification.
Significance Statement
Perception and action reflects the culmination of multiple processing stages. In gustation, these stages and their sequence are understudied. We show strong correspondences between neural decoding onset and behavioral response times, demonstrating that differences between taste judgments are reflected early during chemosensory encoding, rather than resulting from higher-level cognitive processing. Moreover, we find that the processing sequence of detection and discrimination varies with taste contrast: detection precedes discrimination for sour-salty while both processes occur without time lag for bitter-sweet, which vary in hedonics. We suggest that hedonic features are processed in parallel to purely sensory computations with the potential to facilitate stimulus identification in taste perception, supporting the concept of a flexible sequence of gustatory coding states.
Introduction
The innate ability to discriminate between basic taste categories (Cowart, 1981; Steiner et al., 2001) reflects the ecological imperative of the mammalian sense of taste and underlines its role in nutrient sensing and the avoidance of harmful substances. Indeed, sweet taste indicates the availability of carbohydrates, salty taste allows electrolyte detection, umami taste serves protein recognition, and sour and bitter tastes alert us to acids and potentially harmful substances like alkaloids, respectively (Breslin, 2013).
Each taste category is detected by specific receptors, mostly on the tongue (Roper and Chaudhari, 2017), and taste-specific information is transduced to the brainstem, eventually arriving at dissociable cortical representations (Katz et al., 2002; Schoenfeld et al., 2004; Pavao et al., 2014; Crouzet et al., 2015; Wallroth et al., 2018). Despite detailed descriptions of peripheral and central sites of gustatory information processing, the emergence of the taste processing cascade, such as the detection of and discrimination between tastes, is not yet understood.
Early investigations of human taste behavior demonstrated that tastes can be detected within only 200 ms (Lester and Halpern, 1979; Yamamoto and Kawamura, 1981), and that more complex taste judgments such as identification and discrimination take 100–200 ms longer (for an overview, see Halpern, 1986). Interestingly, Kuznicki and Turner (1986) hypothesized that taste discrimination times are intimately linked with the time required to detect individual tastants (termed “time criterion strategy”). Accordingly, during the discrimination of tastes with different detection latencies, the faster taste serves as a cue that triggers the response, which results in an apparent speed-up of the discriminatory decision for the slower taste. Contrarily, when tastes with similar detection latencies are to be discriminated, the absence of such a response cue slows the discriminatory decision considerably as compared to their individual detection times (Kuznicki and Turner, 1986).
Generally, differential timing between simple and more complex evaluations (e.g., detection of a taste or judging its intensity) has been largely attributed to central processing, as neither correlations of the temporal properties of the taste periphery nor chemical properties of the tastants could account for the magnitude of the observed differences (Halpern, 1986; Kelling and Halpern, 1986). However, given that behavioral outputs reflect the culmination of several processing stages, prior work was unable to address whether the observed timing differences between taste judgments, particularly taste detection and identification, are a consequence of early central processing associated with chemosensory encoding or later central processing associated with higher-level cognition, such as decision making. To this end, investigating the occurrence of taste-related responses in ongoing neural activity (e.g., via electrophysiological recordings) provides an ideal tool to address whether attentional modulation affects early sensory processing or higher-level cognition such as memory, response selection, etc. (Luck and Hillyard, 1999). So far, our mechanistic understanding of the taste processing sequence is based on rodents, where single neuron recordings in the gustatory cortex revealed separable stages of taste-nonspecific action potential bursts, which likely represent oral somatosensation, and more complex, taste-specific responses (Katz et al., 2001; Baez-Santiago et al., 2016), although these findings cannot be readily transferred to humans given differences between species and experimental protocols. Further findings suggest that gustatory responses are not represented by stationary sensory codes but are subject to contextual modulations such as attention and expectation (Fontanini and Katz, 2006, 2009; Samuelsen et al., 2012).
In comparison with other sensory systems, the olfactory sense may afford the most relatable insights, as major perceptual computations conclude within a time frame akin to the gustatory sense (cf. Crouzet et al., 2015; Jiang et al., 2017), with a temporal advantage for detection over discrimination performance of comparable magnitude (∼200 ms; cf. Halpern, 1986; Olofsson et al., 2013). In olfaction, response-time data suggest a cascade with distinct processing stages for detection, identification, and edibility, which unfold in a causal, sequential manner, while valence computations may also run, at least in part, in parallel to identification (Olofsson et al., 2013). In contrast, detection and categorization of visual objects (such as “bird” or “car”) may in fact occur simultaneously (Grill-Spector and Kanwisher, 2005), although it has also been suggested that detection and identification are not intrinsically linked but rather are contingent on a variety of task factors (Mack et al., 2008).
Here, we investigated the processing sequence of two distinct taste judgments: detection and discrimination. Specifically, we tested whether temporal differences between taste detection and discrimination are already reflected at the early stages of sensory encoding or only manifest during later stages related to higher-level cognitive processing, using multivariate pattern analysis of gustatory electroencephalography (EEG) and psychomotor response times (RTs).
Materials and Methods
Participants
Twenty-one healthy and normal-weight individuals participated in the experiment and received monetary compensation or class credits. Exclusion criteria were heavy smoking, pregnancy, impaired sense of taste, hearing aid, and past or current neurologic or psychological disorders; the information was self-report based. One subject was excluded from all analyses due to technical difficulties during data collection. One participant completed only the EEG part and did not participate in the rating procedure; we kept this partial data set. Accordingly, data from 20 participants, 16 women, 18–34 years old (mean age 25.27 ± 4.04 SD; mean BMI 21.82 ± 2.66 SD), are reported for the EEG and behavioral data, and data from 19 participants, 15 women, 18–34 years old (mean age 25.40 ± 4.10 SD; mean BMI 21.97 ± 2.64 SD), are reported for the ratings. The study conformed to the revised version of the Declaration of Helsinki and was approved by the ethics board of the German Psychological Society. Participants provided written informed consent before participation.
Materials
Four solutions with a clear taste were presented to participants: 0.684 M sodium chloride (salty; local supermarket, REWE, Köln, >97% purity), 0.052 M citric acid (sour; SAFC, CAS#77-92-9, Sigma-Aldrich, Inc.), 0.003 M quinine monohydrate (bitter; CAS#207671-44-1, Sigma-Aldrich, Inc.), and 0.075 M Splenda (sweet; Tate & Lyle*). Solutions were prepared daily by dissolving the chemical in distilled water.
Taste and rinse solutions were delivered with the GU002 gustometer (Burghart Messtechnik GmbH), which stores solutions in separate bottles that each supply a syringe pump with a check valve (Iannilli et al., 2015). From there, solutions are transported via separate, 5-m-long Teflon tubes to a manifold outlet where they mount together with compressed air to a spray nozzle that atomizes the liquids to an even spray. The spray nozzle is positioned 1–1.5 cm above the slightly extended tongue so that the spray covers a large area of the anterior, slightly extended tongue’s surface. All tubes ran inside a hose filled with water at 38°C until the manifold to keep the solutions at a constant temperature and to minimize any thermal sensations. During the experiment, the participant comfortably leaned against a forehead rest, which stabilized the head and held the spray nozzle in place. In this position, liquids were applied to the slightly extended tongue and not swallowed but collected in a bowl underneath the chin. The position was monitored online via camera to monitor positioning of the tongue and movements.
The gustometer was set to apply regular, distinct spray pulses. During each pulse, 70 µl of liquid were dispensed during 100 ms; this period was followed by a pause of 200 ms, which served to separate consecutive spray pulses. Each taste stimulus consisted of three such pulses and amounted to a bolus of 210 µl delivered over a period of 900 ms (flow rate: 233 µl/s). The timing and flow rate were optimized to minimize mixing of individual spray pulses and to elicit the experience of a continuous flow of liquid to the tongue. The distinct spray pulses permit to embed a tastant in the “flow” of control or water stimuli without tactile cue. Notably, participants experience a tactile “pulsing” only for a few seconds until the lingual somatosensory system is habituated. During the development of this procedure, we determined the time required for lingual habituation; we measured the time to the abolishment of the lingual somatosensory steady-state response and confirmed our findings with verbal reports of numbing of the tongue. The steady-state response was abolished within <10 s. As a result, we present water pulses for at least 10 s at the beginning of each experimental block or experiment (Tzieropoulos et al., 2013; Crouzet et al., 2015). The time between the TTL pulses controlling the syringe plungers, which push the liquids through the tubes and the spray nozzle, until the aerosol reaches the tongue’s surface, was measured by the supplier for the experimental setting described here following a previously proposed conductivity measurement (Kelling and Halpern, 1986). It revealed a time lag of 36 ms (SD = 2 ms), which the stimulus onset in the EEG data were corrected for.
Design
Participants completed two forced choice RT tasks, which alternated block-wise and each repeated four times for a total of eight blocks (see Figure 1). In the “detection” task, participants were asked to decide whether they received a tastant (any of the four) or water, and to respond with the appropriate button press as quickly as possible. There were 160 tastant trials (40 per tastant) and 160 water trials, for a total of 320 detection trials. In the “discrimination” task, participants were asked to decide between two pairs of tastes. There were 160 discrimination trials in total (40 per tastant). The discrimination was performed for two pairs: salty versus sour and sweet versus bitter. The tastant pairs were selected based on three criteria: (1) same type of taste receptors: salty and sour taste are signaled via ion channels, and for sweet and bitter via G protein-coupled receptors (GPCRs), which convey information at different speeds (Pfaffmann, 1955); (2) similar behavioral response speed: taste detection responses are faster for salty and sour than for sweet and bitter (Yamamoto and Kawamura, 1981; Kuznicki and Turner, 1986), which, according to the time criterion hypothesis, would lead to the faster taste serving as a response cue in a discrimination; (3) similar cortical response latencies: similarly to reaction times, salty and sour evoked earlier cortical responses than sweet and bitter (Kobayakawa et al., 1999; Crouzet et al., 2015).
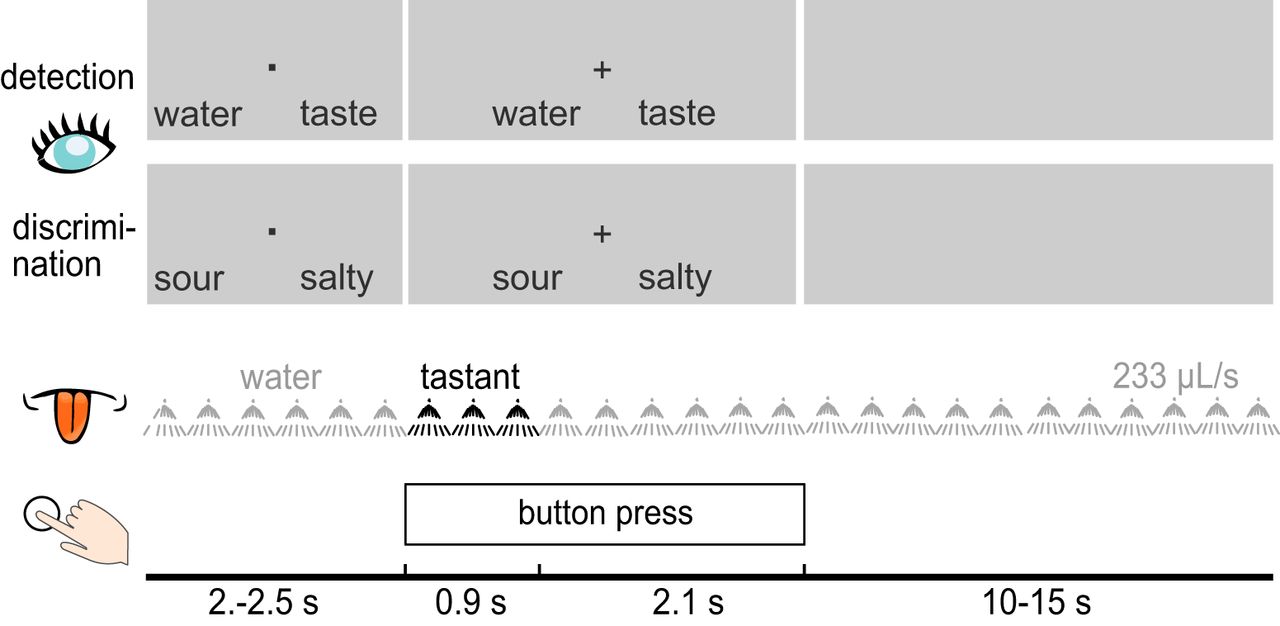
Schematic illustration of the experimental design during the detection and discrimination tasks. The first two rows portray examples of visual cues displayed to participants during detection and discrimination trials. During each trial, a liquid tastant (black) was embedded in a sequence of water pulses. Participants were to speededly respond by button press during both tasks.
At the beginning of each trial, a fixation dot was displayed along with two answer options, with the option on the left corresponding to the leftmost button on the button box, and the option on the right corresponding to the rightmost button. The response mappings were pseudo-randomized across trials and equiprobable. A fixation cross replaced the fixation dot after 2–2.5 s to indicate that the gustatory stimulus (taste or water) was being administered, and that participants should respond with the respective button press. After 3 s, a gray screen was displayed until the next trial. The rinsing period between trials was 15 s for discrimination, and was shortened to 10s in the detection task, due to the inclusion of water trials. Rinsing started immediately after tastant presentation and continued until the next tastant. After the eight task blocks, participants completed a short evaluation block, in which each tastant was presented once more in pseudo-random order and participants were to rate intensity and pleasantness on a horizontal 101-point visual analog scale anchored with 0 (corresponding to no sensation) and 100 (extremely intense) and with −50 (extremely unpleasant) and 50 (extremely pleasant), respectively. The experiment lasted ∼120 min, including breaks.
EEG data acquisition
Participants were seated in a sound-attenuated recording booth (Studiobox GmbH) with the gustometer positioned outside. The EEG was recorded with an activCHamp amplifier system (Brain Products GmbH) at a sampling rate of 500 Hz with analog 0.01-Hz high-pass and 200-Hz low-pass filters using PyCorder (Brain Vision LLC) with 64 Ag/AgCl active electrodes placed in an elastic cap according to the extended 10/10 system.
EEG data preprocessing
The EEG data were processed offline using custom MATLAB- and Python-based scripts with functions from EEGLAB (Delorme and Makeig, 2004) and Autoreject (Jas et al., 2017), respectively. Data were first down-sampled to 200 Hz to improve the signal-to-noise ratio and computation speed. Slow drifts were corrected with linear de-trending and line noise (50 Hz) was removed with a set of multi-tapers over sliding time windows. The continuous data were then segmented into epochs spanning from −0.5 to 3 s relative to stimulus onset and Autoreject was applied to interpolate noisy channels within epochs. Next, an extended Infomax independent component analysis (ICA; Makeig et al., 1997) was computed to identify artifactual components with manual inspection guided by ADJUST (Mognon et al., 2011), which uses temporal and spatial characteristics of the independent components (ICs) to detect outliers. ICs representing common artifacts were subtracted from the data. The data were then re-referenced to the average of all electrodes. Finally, we applied zero-phase Hamming-windowed sinc finite impulse response filters (cutoff: −6 dB, maximum passband deviation: 0.2%, stopband attenuation: −53 dB) to isolate the frequency spectrum below 6 ± 2 Hz (order: 330) and above 0.5 ± 1 Hz (order: 660), and subsequently shortened the epochs to −.2 s to 1.5 s. The frequency cutoff was based on recent findings showing that taste quality information is encoded within the power and phase information of the δ and lower θ frequency bands (roughly up to 6 Hz; Hardikar et al., 2018; Wallroth et al., 2018; see also Pavao et al., 2014). Trials were then normalized by subtracting the average of each electrode’s baseline period (−200 ms to stimulus onset) before decoding analysis. No trials were excluded from the data.
Descriptive EEG analysis
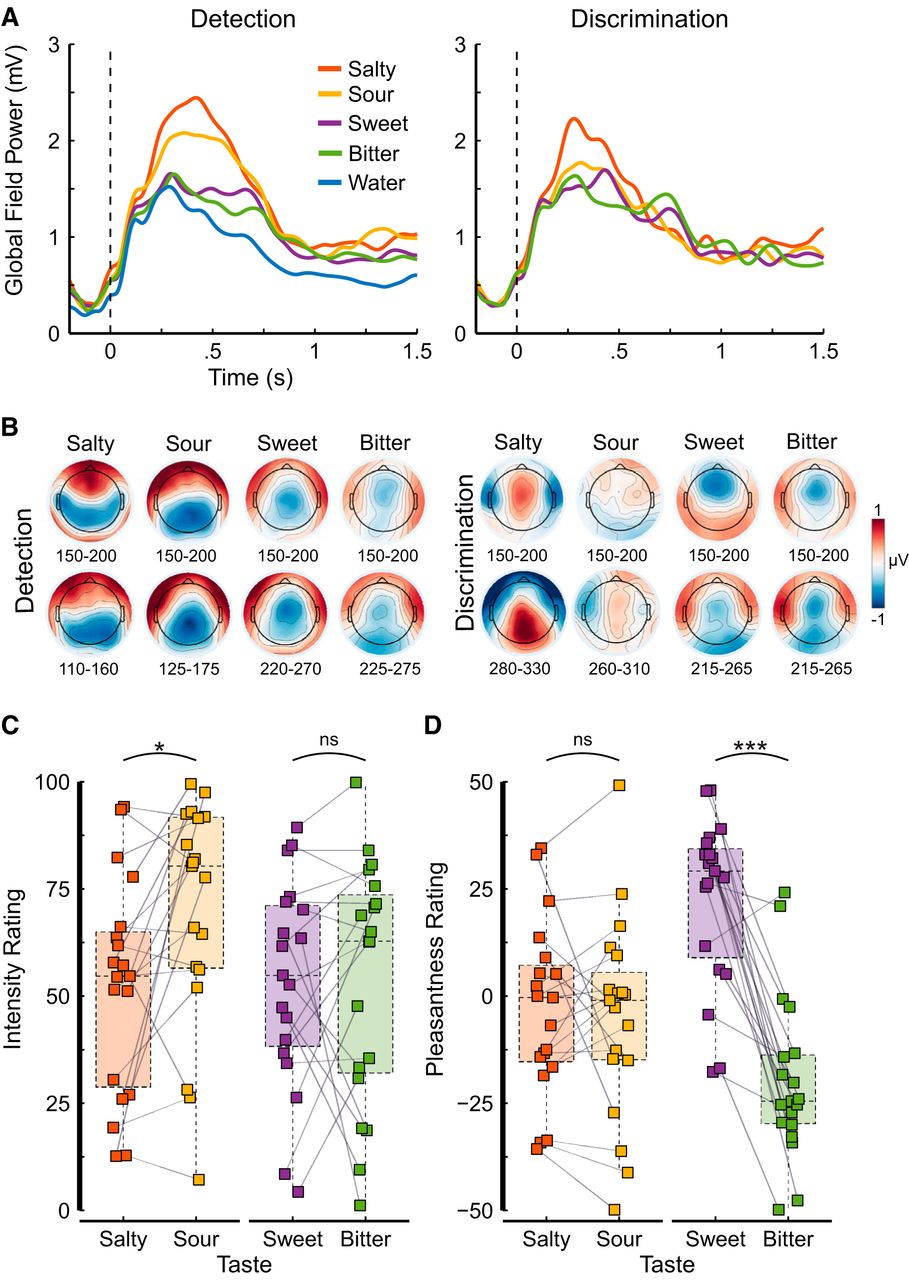
To quantify the strength of the electrophysiological signal for each experimental condition, we computed the global field power (GFP), a reference-free index of electric field strength, per task and taste. The GFP is a measure of variance (i.e., the average of the standard deviations of the event-related potentials at each of the 64 electrodes) and expresses how much electrical activity (averaged across participants) occurs in response to an event (Fig. 2A). To illustrate the electric field distributions, we computed topographical voltage maps for each taste and task. Each map represents the grand-averaged, mean voltage from 150 to 200 ms and 50 ms surrounding the mean decoding onset time relative to water (Fig. 2B). Difference maps were computed to remove the visual evoked response elicited by the display of the fixation cross.

A, Signal strength quantified as the average GFP computed within-subjects as the standard deviation of the event-related potentials over 64 electrodes for each of the tastants and water over detection trials (left) and discrimination trials (right). Salty and sour tastants show a stronger signal than sweet and bitter tastants, but less strongly so for discrimination trials. Note that the onset of the liquid stimulation (for all tastes and for water) coincided with the presentation of the fixation cross, resulting in a clear GFP response for water as well. B, Topographical voltage maps for each taste and task represent the grand-averaged mean over a 50-ms time window, early during processing (upper row) and surrounding the decoding onset (lower row) shown in Table 2 and Figure 3C relative to water. Intensity (0–100; C) and pleasantness ratings (-50–50; D) for the two tastant pairs, salty-sour and sweet-bitter. The colored squares show individual participant ratings, the gray lines between two squares indicate that these ratings were given by the same participant. Semitransparent and colored boxplots entail the ratings of all participants (N = 19); the horizontal dashed line within each box represents the median, the bottom and top of the box represent the first and third quartiles, respectively; whiskers show 1.5 times the interquartile range. The colors represent the taste. Significance is indicated above the plot area: ns p > 0.05; *p < 0.05; ***p < 0.001.
Decoding analysis
To determine the time point at which information related to detection and discrimination of tastes is represented at the single-trial level, we performed a time-resolved multivariate pattern analysis on the amplitudes of all 64 electrodes (MVPA; Kriegeskorte, 2011) embedded in a temporal generalization method (King and Dehaene, 2014). For each participant, the MVPA was implemented with multiple binary L2-regularized logistic regression classifiers (Fan et al., 2008). To mimic the behavioral tasks, four classifiers were trained to detect one of the tastants contrasted to water (using trials from the detection task), and two classifiers were trained to discriminate the two tastant pairs (salty-sour and sweet-bitter, using trials from the discrimination task). The procedure was implemented with a stratified leave-one-trial-out cross-validation (i.e., on every iteration, a trial of each taste is left out). Trials with incorrect behavioral responses were excluded from decoding.
Using the temporal generalization method, a taste-related activity pattern learned at one time point on the population level of trials (reflecting an average) is generalized backward and forward in time, given the time series of a single trial. The resulting classification performance reflects the correspondence between single and average trial activity across time. Unlike the common MVPA approach with pattern learning and testing performed exclusively at identical time points, this generalization approach is better suited to determine activity onsets at the single-trial level by fully taking into account the trial-to-trial variability of gustatory processing states (cf. Jones et al., 2007). Hence, trial-level taste-related activation patterns before or after the average taste response can still be detected.
To determine the onset of the taste-signal at the single-trial level, we used a searchlight approach in line with the “maximum cluster area” statistic (i.e., a predefined number of neighboring time-points exceed a statistical threshold; cf. Bullmore et al., 1999). Given that the sigmoid function of the logistic regression naturally quantifies the certainty with which a classifier makes its decision, we defined a classification as accurate when the correct choice was made with a certainty exceeding the 95% confidence interval of the binomial threshold (a common statistic in classification analysis because it adapts the chance level to the sample size; cf. Combrisson and Jerbi, 2015). Because the decisional certainty is strongly affected by the hyperparameter C (the regularization constant), with negligible influence on the overall performance, we fixed the parameter at C = 0.005, which essentially shrinks the standard deviation of the normal distribution of decision values (as compared to the default of C = 1) for more robust onset estimations. The cluster size is a free parameter which was defined as 50 ms of a stable pattern average (x-direction) and 100 ms of 95% successful generalization (y-direction). This cluster-asymmetry reflects our prioritization of stable estimates at the single-trial level over average pattern stability. The taste-signal onset was defined as the earliest generalization timepoint in the first cluster of significant decoding performance.
Notably, this type of temporal clustering is more liberal with respect to the adjustment for multiple null hypothesis testing than the alternative permutation-based approach (cf. Maris and Oostenveld, 2007). However, the latter (stricter) procedure is better suited to identify whether or not an effect is present, rather than when it first occurs. Given previous findings that taste qualities can be successfully decoded from EEG recordings (cf. Crouzet et al., 2015; Hardikar et al., 2018; Wallroth et al., 2018), our chief concern was to find an adjustment procedure which balances Type I and Type II error rates such that we would identify the taste-signal onset as accurately as possible (i.e., with a minimal number of false alarms but also as few misses of the true signal). To summarize, our present motivation was to explore exactly when a taste-signal emerges at the single-trial level, rather than to investigate whether a taste-signal occurs at all.
The classifier performance was summarized for grand-average visualization as the area under the receiver operating characteristic curve (AUC), and for the statistical analysis of the single-trial results the accuracy was defined as the percentage of trials for which an onset was determined successfully.
Statistical analysis
Statistical analyses were performed with R (R Core Team, 2017). Ratings were analyzed using Student’s t tests to compare the tastes within a pair, sour with salty and sweet with bitter and the degree of pleasantness (positive, neutral, or negative) was tested using one-sample t tests against a null hypothesis of zero, with zero corresponding to neutral on the rating scale. For each of the dependent variables RT, accuracy, decoding onset, and decoding accuracy and for each taste pair (sour-salty or sweet-bitter), a two-way repeated measures ANOVA with the factors TASK (detection, discrimination) and TASTE were computed. Paired samples Student’s t tests of the difference between discrimination and detection were used to resolve TASTE v TASK interactions. One-sided Pearson correlations were computed of the difference values between detection and discrimination decoding onset and RTs to verify the correspondence between neural and behavioral effects. The α-level was a priori set to 0.05; for violations of sphericity Greenhouse–Geisser correction was applied to the degrees of freedom. We report uncorrected degrees of freedom and the absolute values of Cohen’s d effect size estimations.
Results
Ratings
Stimulus concentrations were chosen based on previous studies such that all tastants are clearly perceivable, that tastants within a pair were similarly intense, and that tastants were acceptable (Fig. 2C,D). Overall, all tastes were moderately intense (mean intensity range, 52.35–69.97; Fig. 2A). Bitter and sweet were iso-intense (t(18) = 0.03, p = 0.978, d = 0.01); yet sour was more intense than salty (t(18) = −2.83, p = 0.022, d = 0.43). As expected, salty and sour were neutral in pleasantness (t test against zero; salty: t(18) = −0.67, p = 0.680, d = 0.22; sour: t(18) = −0.92, p = 0.594, d = 0.30), and both were similarly pleasant (t(18) = 0.41, p = 0.784, d = 0.05). Bitter and sweet, on the other hand, varied strongly in pleasantness (t(18) = −7.13, p < 0.001, d = 0.99) such that bitter was clearly unpleasant (t(18) = −4.44, p < 0.001, d = 1.44) and sweet was clearly pleasant (t(18) = 5.00, p < 0.001, d = 1.62), which was to be expected (Fig. 2D).
Behavioral data
In line with the study design, statistical analyses were conducted separately for the taste pairs “sour-salty” and “sweet-bitter.” RTs and accuracy are summarized in Table 1 and shown in Figure 3B.

A, Average within-subject decoding generalization across time for each of the four tastes by task. Detection performance is obtained for the classification of a tastant against water (detection task trials); discrimination performance is obtained for the classification between two tastants (discrimination task trials). The diagonals of the matrices (identical training and testing time) correspond to the common decoding approach. The x-axis displays training times which represents the stability of an average taste pattern. The y-axis displays generalization or testing times which represents the emergence of the average pattern (x-axis) within individual trials. Warm colors reflect average performance increases as compared to chance level (50%), cold colors reflect decreases; black contour lines indicate statistical significance of the grand average as assessed via one-sided cluster-adjusted binomial tests (p < 0.05). Salty and sour show earlier and better detection performance than sweet and bitter, whereas discrimination performance is less pronounced than detection performance in either case. B, Behavioral data of the button press RTs of correct responses and accuracy (average per participant, N = 20) color-coded for tasks (blue indicating detection trials, gray discrimination trials). The horizontal line in each boxplot represents the median, the bottom and top of the box represent the first and third quartiles, respectively; whiskers show 1.5 times the interquartile range, dots indicate outliers. Participants are faster and more accurate at detecting salty and sour than they are at discriminating the two tastants. Sweet and bitter show no difference in RTs but higher accuracy at discriminating the two as opposed to detection from water. C, Neural data of onset times of above-chance performance (determined at the single-trial level; averaged per participant; N = 20 for sweet and bitter tastes, and N = 18 for salty and sour tastes) and of the accuracy indicating the percentage of trials for which such an onset was determinable (boxplot parameters as in B). The neural findings correspond closely to the behavioral data in that salty and sour are classified faster and more accurately in detection trials. Sweet and bitter show no significant difference between the two tasks. D, Correlations of the difference values between the average discrimination and detection neural onset times and button press RTs (each point in a graph represents one participant). Color-coded dashed lines represent linear regression models; horizontal and vertical gray dashed lines indicate the points of no difference between discrimination and detection latencies on the respective axis. The observed effects were significantly positively correlated for three of four tastes, such that an early neural difference (or lack thereof) corresponded to the same behavioral effect.
Descriptive statistics of RTs and accuracies
For the salty and sour contrast, detection RTs were significantly faster than discrimination RTs (F(1,19) = 119.61, p < 0.001, η2 = 0.64), and RTs were similar for both tastes (F(1,19) = 1.08, p = 0.310, η2 = 0.003). A task × taste interaction was observed (F(1,19) = 18.70, p < 0.001, η2 = 0.03), and the comparison of the difference between detection and discrimination revealed that the effect was larger for salty than for sour (t(19) = 4.32, p < 0.001, d = 0.45). Accuracy was significantly higher in the detection than in the discrimination task (F(1,19) = 38.24, p < 0.001, η2 = 0.39) and also higher for sour than for salty (F(1,19) = 6.91, p = 0.020, η2 = 0.05). Again, a task × taste interaction was observed (F(1,19) = 6.26, p = 0.020, η2 = 0.06), and the comparison of the difference between detection and discrimination revealed that the effect was larger for salty than for sour (t(19) = −2.50, p = 0.022, d = 0.79).
For the sweet and bitter contrast, RTs were similar for the detection and discrimination tasks (F(1,19) = 1.62, p = 0.219, η2 = 0.01), and RTs were faster for sweet than for bitter (F(1,19) = 12.07, p = 0.003, η2 = 0.03). Accuracy was significantly higher in the discrimination than in the detection task (F(1,19) = 7.10, p = 0.020, η2 = 0.09), and also higher for sweet than for bitter (F(1,19) = 7.54, p = 0.010, η2 = 0.04). A task × taste interaction was observed (F(1,19) = 8.67, p = 0.008, η2 = 0.07) and a comparison of the difference in accuracy between detection and discrimination revealed that the effect was larger for bitter than for sweet (t(19) = −2.94, p = 0.008, d = 0.56).
Classifier
Statistical analyses were performed on within-subject decoding results which are visualized as the grand-average performance in Figure 3A. Decoding onset times and the accuracy of the classifier, which was defined as the percentage of trials for which an onset was determined (i.e., at some point in time the taste was correctly identified for the predefined cluster period) are summarized in Table 2 and shown in Figure 3C. The contrasts separated the analyses for the taste pairs sour-salty and sweet-bitter in line with the study design as before. Because two participants performed poorly during the behavioral discrimination of salty and sour, too few trials remained for the decoder to learn their respective taste patterns. Hence, the analyses involving salty and sour tastes were computed on lower sample sizes (indicated by the lower number of degrees of freedom).
Descriptive statistics of decoding onset times and accuracies
For the salty and sour contrast, decoding onsets during detection were significantly faster than during discrimination (F(1,17) = 44.75, p < 0.001, η2 = 0.53), and onset times were similar for both tastes (F(1,17) = 0.16, p = 0.692, η2 = 0.001). Likewise, classifier accuracy was significantly higher during detection than discrimination (F(1,17) = 35.01, p < 0.001, η2 = 0.50), and similar for both tastes (F(1,17) = 0.87, p = 0.365, η2 = 0.001).
For the sweet and bitter contrast, decoding onsets were similar for both tasks (F(1,19) = 0.13, p = 0.723, η2 = 0.001) and for both tastes (F(1,19) = 0.04, p = 0.851, η2 = 0.00). Likewise, classifier accuracy did not differ among the tasks (F(1,19) = 0.07, p = 0.794, η2 = 0.001) nor tastes (F(1,19) = 0.03, p = 0.865, η2 = 0.00).
Neural-behavioral correspondence
To verify the correspondence between the task-specific effects observed for decoding onsets and RTs, we calculated Pearson correlations of the taste- and subject-wise difference values between detection and discrimination latencies for decoding onsets and for RTs (Figure 3D). We observed significant positive correlations for salty (r17 = 0.40, p = 0.045), sweet (r18 = 0.57, p = 0.004), bitter (r18 = 0.47, p = 0.017), but no significant correlation for sour (r17 = 0.10, p = 0.343).
Discussion
In this study, we investigated the processing sequence of simple and complex gustatory perceptual decisions, using electrophysiological patterns and behavioral responses elicited by salty, sour, sweet, and bitter tastants. Building on recent findings that taste category information is available within the time period of the earliest evoked response, we examined whether the detection and discrimination of a taste are simultaneous or distinct processing stages, and whether potential differences are represented early or late in the gustatory processing cascade. For the first time, we demonstrate not only a close correspondence between the earliest neural and behavioral responses, but also provide evidence that temporal differences between simple and complex taste-related decisions are established early during chemosensory encoding, rather than later during higher-level cognition. Interestingly, however, the latencies of detection and discrimination were contingent on the specific taste comparison, such that the temporal sequence varied with the hedonic contrast, suggesting that gustatory features may be processed partially in parallel.
For salty and sour, detection times were significantly faster than discrimination times, with a ∼100-ms difference in their neural onsets, and a 300- to 400-ms difference between behavioral responses, suggesting that gustatory features required for the mere detection and for taste category discrimination are processed sequentially so that the depth of processing increases with time. This observation is consistent with previous RT studies which showed that simple taste judgments such as taste detection are 100–200 ms faster than more complex judgments such as taste discrimination (Yamamoto and Kawamura, 1981; Halpern, 1986), and specifically that the discrimination of salty and sour requires even more time (an additional 400–600 ms) as compared to their individual taste detection (Kuznicki and Turner, 1986). The authors attributed this taste-specific increase in discrimination time to the failure of the time criterion strategy, which suggests that discrimination performance is controlled by the detection latency of the faster of two tastes which can be used as a response cue (essentially reducing the processing depth required for actual identification). Accordingly, the difference between taste detection and identification would be underestimated regularly, given that the speed at which a discrimination task is solved benefits from differing detection latencies between tastes, whereas discriminating tastes with similar detection latencies would reflect actual discrimination times. However, probing this hypothesis in gustation is not trivial because matching detection times are typically only observed for the juxtaposition of salty and sour.
In contrast to previous work, we observed no neural and only a minuscule behavioral difference in detection latencies for bitter and sweet, so that the likely failure of the time criterion strategy should have predicted an increase in discrimination time. Crucially, however, we observed similar processing times for the detection of sweet and bitter and their discrimination, both at the neural and behavioral level. The absence of any task dependency when comparing sweet and bitter suggests that a different mechanism, not available in the contrast of salty and sour, diminished the time lag between taste detection and discrimination. Thus, we argue that taste features that facilitate the identification process were available already early during taste processing, in line with the notion that the gustatory processing cascade does not simply constitute an invariant sequence of coding states (Fontanini and Katz, 2006, 2009; Samuelsen et al., 2012).
One apparent difference between the two taste-discrimination contrasts lies in the valence associated with the individual tastants. Whereas salty and sour were virtually identical with respect to their neutral hedonic value, sweet and bitter showed a marked difference, tending toward the positive and negative extremes of the pleasantness scale, respectively. While previous reports suggested that similar detection latencies caused the increase in discrimination times (Kuznicki and Turner, 1986), perhaps it was hedonic similarity that reduced stimulus distinctiveness instead. This would also be consistent with the comparably high error rates in the salty-sour discrimination and suggest that task difficulty increased concomitantly with processing times. Similar observations were made in olfaction, where discrimination of similar odors required additional processing time (Abraham et al., 2004). Likewise, for the sweet-bitter discrimination, valence may have served as the decisive response cue for the discrimination task, essentially substituting the presumed role of individual detection latency, and thereby compensating the need for additional processing time and potential performance impairments. Hence, the putative role of hedonics in taste identification emphasizes that the gustatory processing cascade unlikely unfolds in a purely serial manner but rather that taste detection, identification, and palatability are processed in parallel or with considerable overlap as it has been shown in rodents (Perez et al., 2013).
Anatomic and physiologic evidence from primates suggests that sensory and hedonic features of a taste event are indeed processed largely in parallel (Sewards and Sewards, 2002). In contrast, rodent studies revealed adaptations in the earliest taste response of amygdalar neurons to an aversive compared to a non-aversive taste, which further resulted in increased functional connectivity, implying greater information flow between amygdala and gustatory cortex (Grossman et al., 2008). Given adequate cross-talk within the gustatory network (cf. Katz et al., 2002), and given a faster conclusion of hedonic over chemosensory computations, the discrimination of any of two tastes could benefit from divergent hedonic information, thereby modifying the task to a recognition of taste palatability rather than category (or, alternatively, facilitating sensory identification itself). Evolutionarily, humans were likely to benefit from a taste system which commands a flexible coding mechanism with the capability to quickly incorporate hedonically relevant information. In fact, because the ultimate purpose of tasting is to determine whether an organism should ingest or reject a substance, it is only plausible to assume that this evaluative process relies considerably on hedonic evaluations, which may take precedence over sensory categorization or semantic retrieval. Therefore, the workings of the gustatory system appear to be related to what has been reported in the olfactory system (which largely coincides in its function to determine approach and avoidance), such that hedonic evaluations are processed in parallel to identification (Olofsson et al., 2013), and often precede odor naming (Lawless and Engen, 1977).
An alternative, although speculative, explanation of the taste-contrast specificity may be found in different taste transduction mechanisms starting in the peripheral gustatory system. Bitter and sweet taste are mediated by specialized, taste-specific GPCRs, which are expressed in distinct Type II taste receptor cells (Chandrashekar et al., 2006), and which converge on a common intracellular signaling pathway culminating in ATP release (Roper and Chaudhari, 2017). Interestingly, bitter compounds typically activate numerous bitter taste receptors, possibly to ensure detection of potentially toxic bitter-tasting substances via redundant activation (Meyerhof et al., 2010). Moreover, bitter and sweet are linked to specific behaviors: avoidance and approach, respectively. Hence, it is plausible to assume that the separation of sweet and bitter transduction pathways, along with differential encoding of palatability (whether the taste is pleasant or unpleasant), likely contribute to the superior discriminability of these two tastes, enabling their discrimination as soon as they are tasted.
Salty and sour, on the other hand, are mediated by specific ion-channels expressed in neuron-like Type III cells (Lewandowski et al., 2016). These are depolarized as a result of intra-cellular acidification for sour and possibly also for salty, and convey taste information via action potentials (Roper and Chaudhari, 2017), which may, at least in part, contribute to overall faster taste transduction (and faster resulting behavioral responses) compared to GPCR-mediated taste categories. Moreover, because taste-induced activations overlap for salty and sour, particularly at higher concentrations (Lewandowski et al., 2016), and because taste neurons are more broadly tuned with increasing concentrations (Wu et al., 2015), the downstream responses to these tastes may be somewhat more ambiguous and required additional processing to disentangle the sensory inputs, thereby increasing the processing time for the salty-sour discrimination. Of course, differences in the distribution of quality-specific receptor cells may have contributed to the present findings as well.
In conclusion, our results show a close correspondence between the patterns of taste-related psychomotor and the earliest electrophysiological responses, suggesting that behavioral effects are established early in the gustatory processing cascade during stages associated with chemosensory encoding rather than higher-level cognition such as decision making (Wallroth et al., 2018). While detection and discrimination of gustatory stimuli likely occur sequentially, hedonic computations which run in parallel to the purely sensory computations may facilitate taste identification. Hence, the gustatory processing cascade (including the perceptual stages or “milestones” of detection and discrimination) appears to be a variable sequence of sensory coding states contingent on the specific tastes and potentially other contextual factors.
Acknowledgments
Acknowledgements: We thank Niko Busch for helpful discussions during data analysis and preparation of this manuscript and Sarah Polk and Andrea Katschak for scheduling of participants and acquisition of the data.
Footnotes
The authors declare no competing financial interests.
This work was supported by the German Federal Ministry of Research and Education (BMBF) Grant FKZ: 01EA1408A-G (K.O.).
This is an open-access article distributed under the terms of the Creative Commons Attribution 4.0 International license, which permits unrestricted use, distribution and reproduction in any medium provided that the original work is properly attributed.
References
In this issue


