

Article Figures & Data
Figures
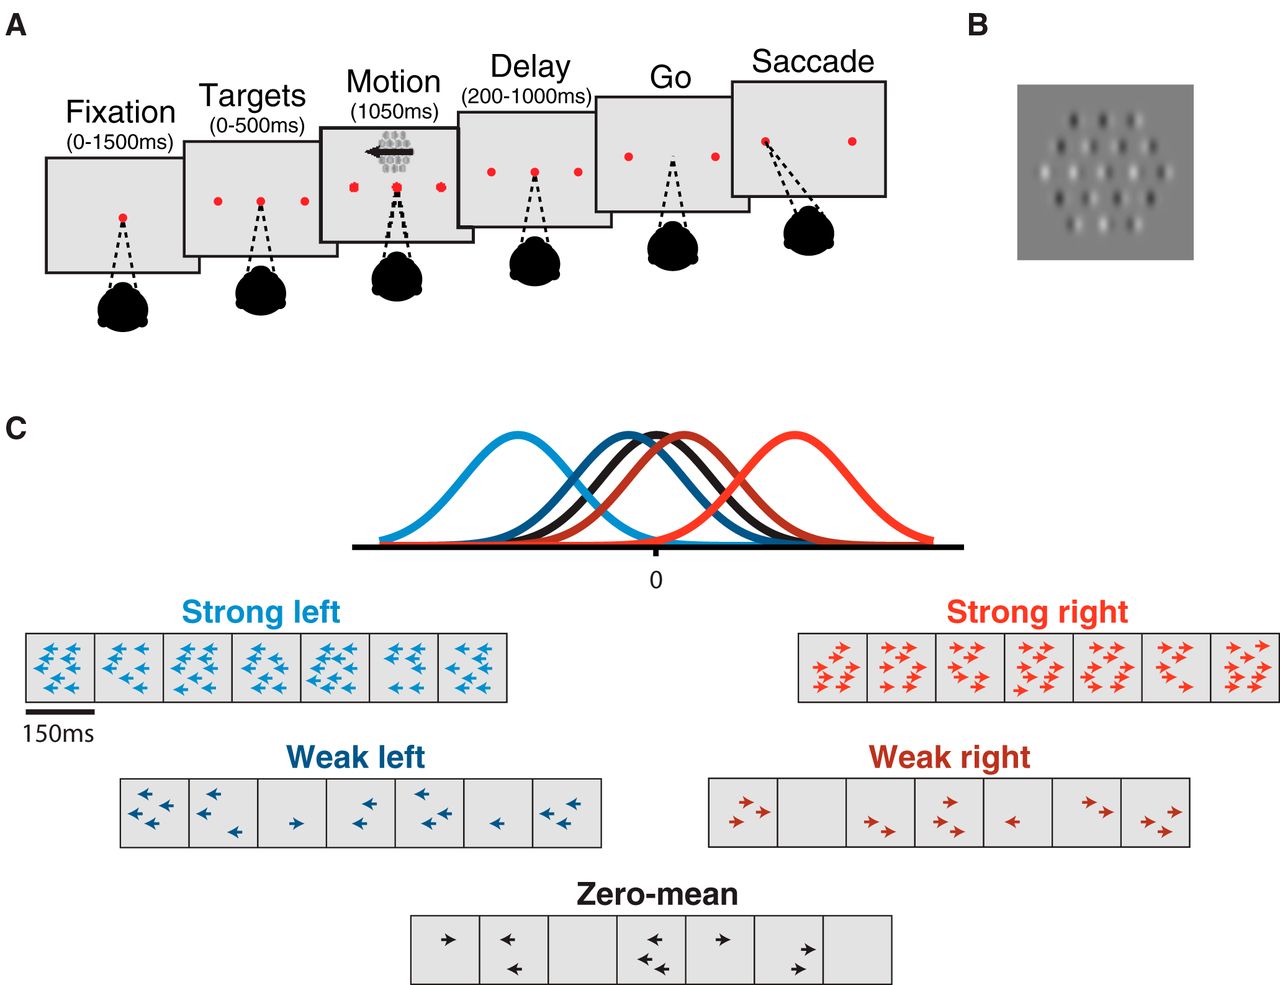
- Figure 1.
Sequence of trial events. A, Subjects fixated on a central point through the appearance of targets and motion stimulus until the disappearance of the fixation point (“go”). Choices were made with saccades to the target corresponding to the perceived net direction of motion. Initial fixation time, target-on duration, and time until fixation point disappearance were randomly varied. B, An example frame of the Gabor motion pulse stimulus. The stimulus is composed of 19 Gabor patches, where motion strength is denoted by the proportion of coherently drifting Gabors out of the total number elements in the stimulus. C, Motion pulse values are generated from Gaussian distributions spanning a large range of possible motion strengths in either direction. A single trial consists of seven motion pulses, each randomly drawn from one of the Gaussians. Example trials with pulses drawn from each Gaussian (strong left/right, weak left/right, and zero-mean) are presented in cartoon form where the number of arrows represents the number of coherently drifting Gabor elements.
- Figure 2.
Temporal weighting profiles and psychometric functions for humans and macaques across flat-, late-, and early-stimulus conditions. A–C, Top: schematic of the Gaussian distributions that generate the motion pulses. In the flat-stimulus (A), Gaussians remain stationary over time. In the late-stimulus (B) and early-stimulus (C) conditions, the distribution means for signal trials are varied over time. Bottom: example sessions for each stimulus condition. Motion pulse values are drawn from their color-matched Gaussians on each pulse such that the mean of many trials (bold line) reflects the temporal structure of the mean of the Gaussians. Motion pulse values in individual trials (semitransparent traces) vary considerably, in accordance with the variance of color-matched Gaussians. D–F, Temporal weighting profiles averaged across all subjects (human and macaque) and sessions within the flat-stimulus (D), late-stimulus (E), and early-stimulus (F) conditions, showing the mean weight assigned to each of the seven motion pulses. Error bars represent ± 1 SEM. G–I, Psychometric performance averaged over all sessions for flat-stimulus (G), late-stimulus (H), and early-stimulus (I) conditions, fitted by a logistic function capturing the dependence of choice on stimulus strength. Error bars represent ± 1 SEM (often occluded by points).
- Figure 3.
Comparison of temporal weighting and psychometric functions within species across stimulus conditions. A, B, Temporal weighting profiles for macaques (A) and humans (B) averaged over all sessions in the early-, flat-, and late-stimulus conditions, fitted by a linear model (semitransparent lines) to capture the overall trend of the weights. Error bars represent ± 1 SEM. C, D, Psychometric behavior of macaques (C) and humans (D) averaged over all sessions in the early-, flat-, and late-stimulus conditions, fitted by a logistic function to capture the dependence of choice on stimulus strength. Error bars represent ± 1 SEM. E, Each subject’s proportion correct for inconsistent trials (where the strongest pulse is in the opposite direction of the full-trial, net direction) and difficulty-matched consistent trials (where the strongest pulse is in the same direction as the full-trial, net direction). Error bars represent 95% binomial confidence intervals.
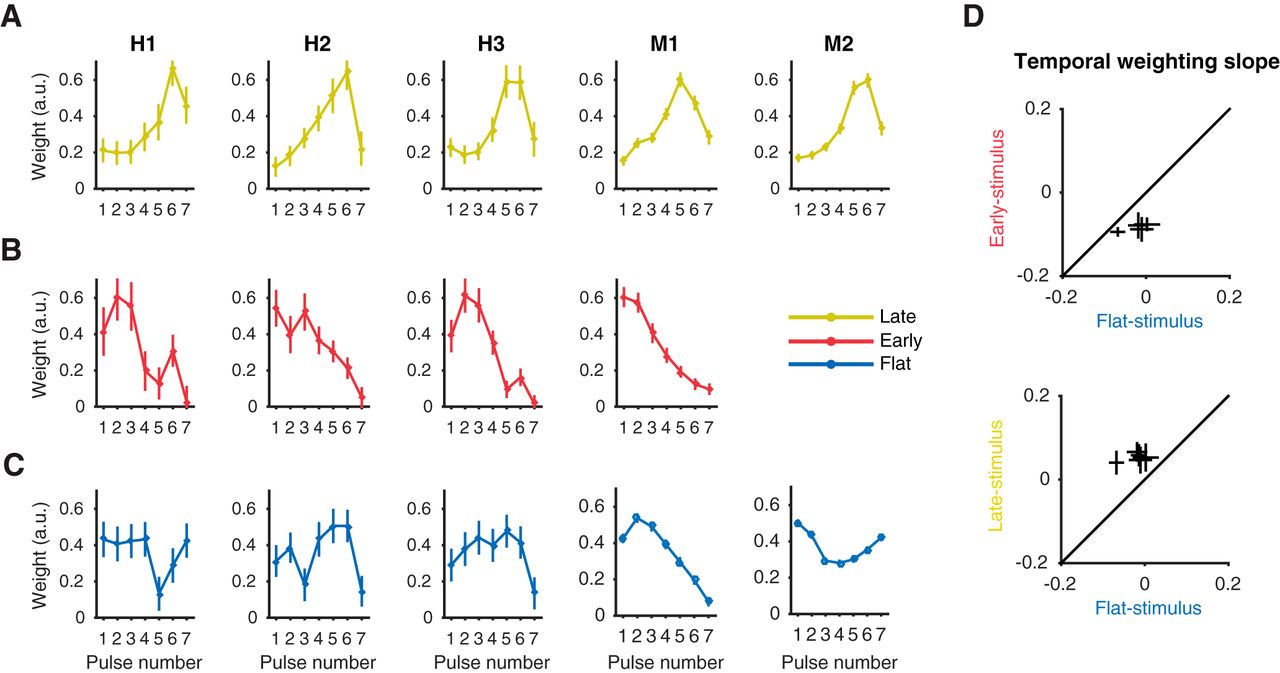
- Figure 4.
Temporal weighting strategies for individual subjects across stimulus conditions. A–C, Average temporal weighting strategies for individual human and macaque subjects (columns) during the late-stimulus (A), early-stimulus (B) and flat-stimulus (C) condition. Error bars represent ± 1 SEM. D, A within-subject comparison of the shift in temporal weighting strategies from flat-stimulus to early (top) and flat-stimulus to late (bottom), represented as the slope of the linear model fit to subject temporal weights. Error bars represent ± 1 SEM.
- Figure 5.
Variability in temporal weighting profiles and psychometric performance. A, Distribution of temporal weighting profiles over sessions and subjects across the early-, flat-, and late-stimulus conditions, represented as the slope of the linear model fit to the temporal weights of each session. Negative slope values indicate an early weighting strategy; positive values indicate late. Triangles denote the median. B, The relationship between psychometric performance (75% psychophysical threshold) and temporal weighting (slope of linear fit to temporal weights), over all sessions across the three stimulus conditions. C, The relationship between psychometric performance (75% psychophysical threshold) and temporal weighting energy (sum of squared errors of temporal weight values from their mean), over all sessions across the three stimulus conditions.


Tables
Test use Test Data structure Power Psychophysical weighting calculated on all trials vs. only zero-mean trials Pearson correlation Linear Subjects: median r = 0.886 [0.819 to 0.952], 1 SEM; single session: median r = 0.846, [0.829 to 0.864], 1 SEM Differences in slope of linear fit to temporal weights between flat-, late-, and early-stimulus conditions in humans and macaques (Fig. 3) Confidence intervals Linear Slope of linear fit, [95% confidence interval]; Macaques: flat: –0.050, [–0.069 to 0.031]; late: 0.051, [0.004 to 0.098]; early: –0.094, [–0.111 to –0.077]; Humans: flat: –0.013, [–0.032 to 0.006]; late: 0.053, [0.006 to 0.100]; early: –0.083, [–0.119 to –0.048] Comparison of slope of linear fit to temporal weights during early-stimulus condition between humans and macaque subjects (Fig. 3) Confidence intervals Linear Slope of linear fit, [95% confidence interval]; Humans: –0.013, [–0.032 to 0.006]; Macaques: –0.050, [–0.069 to –0.031] Comparison of psychometric functions across conditions (Fig. 3) Confidence intervals Linear Slope of psychometric function, [95% confidence interval]; Macaques: early: 3.39 [3.22 to 3.56], flat: 2.16 [2.13 to 2.18], late: 2.9339 [2.83 to 3.03]; Humans: early: 2.77 [2.56 to 2.99], flat: 2.14 [2.00 to 2.28], late: 2.60 [2.43 to 2.77] Average slope of temporal weights for flat-, early-, and late-stimulus conditions compared to 0 (Fig. 5) Wilcoxon sign test Non-Gaussian p < 0.0001, all conditions Comparing group means for slopes of temporal weights for flat-, early-, and late-stimulus conditions (Fig. 5) ANOVA Gaussian p < 0.0001 Comparing variance of slopes during flat stimulus condition vs. late- and early-stimuli (Fig. 5) Bartlett’s test Non-Gaussian Flat-to-early, p < 0.0001; flat-to-late, p < 0.0001 Evaluating linear relationship between psychophysical threshold and slope of temporal weights (Fig. 5) Pearson correlation Linear Flat: r = –0.29, p < 0.001; early: r = 0.46 p = 0.038; late: r = 0.05, p = 0.75 Evaluating linear relationship between psychophysical threshold and energy of temporal weights (Fig. 5) Pearson correlation Linear Flat: r = 0.40, p < 0.0001; early: r = –0.004, p = 0.99; late: r = 0.31, p = 0.048
In this issue


